The Workforce Innovation and Opportunity Act (WIOA) authorizes federal funding for state and local workforce development activities. Through WIOA Title I, states and territories receive formula funds on an annual basis to support workforce development activities for unemployed or underemployed youth, adults, and dislocated workers. Specifically, in FY 2023, Congress provided $948 million to support WIOA Youth Workforce Investment (Youth), $885 million to support Adult Employment and Training (Adult), and $1.095 billion to support Dislocated Worker Employment and Training (Dislocated Worker).
While WIOA Title I funding is critical for Governors to achieve their workforce development goals, state allocations often have significant variance year-over-year (YOY) with little predictability, making forward planning difficult for the public workforce system. The follow chart outlines the differences across WIOA Title I state funding formulas.
WIOA Statutory Formulas for State Allotments
| WIOA Title Program | Formula Funding Description | Minimum Funding Description | Maximum Funding Description |
|---|---|---|---|
| Youth | 1/3: State relative share of total unemployed in areas of substantial unemployment 1/3: State relative share of excess unemployed 1/3: State relative share of disadvantaged youth | State allotment cannot be less than 90% of State relative share of prior year funding and .25% of total funds available for states | 130% of State relative share of prior year funding |
| Adult | Same as Youth Activities, except the Adult Activities formula uses disadvantaged Adults instead of Youth. | Same as Youth Activities | Same as Youth Activities |
| Dislocated Worker | 1/3: State relative share of total unemployed 1/3: State relative share of excess unemployed 1/3: State relative share of long-term unemployed | State allotment cannot be less than 90% of State relative share of prior year funding | State allotment cannot be more than 130% of state relative share of prior year funding |
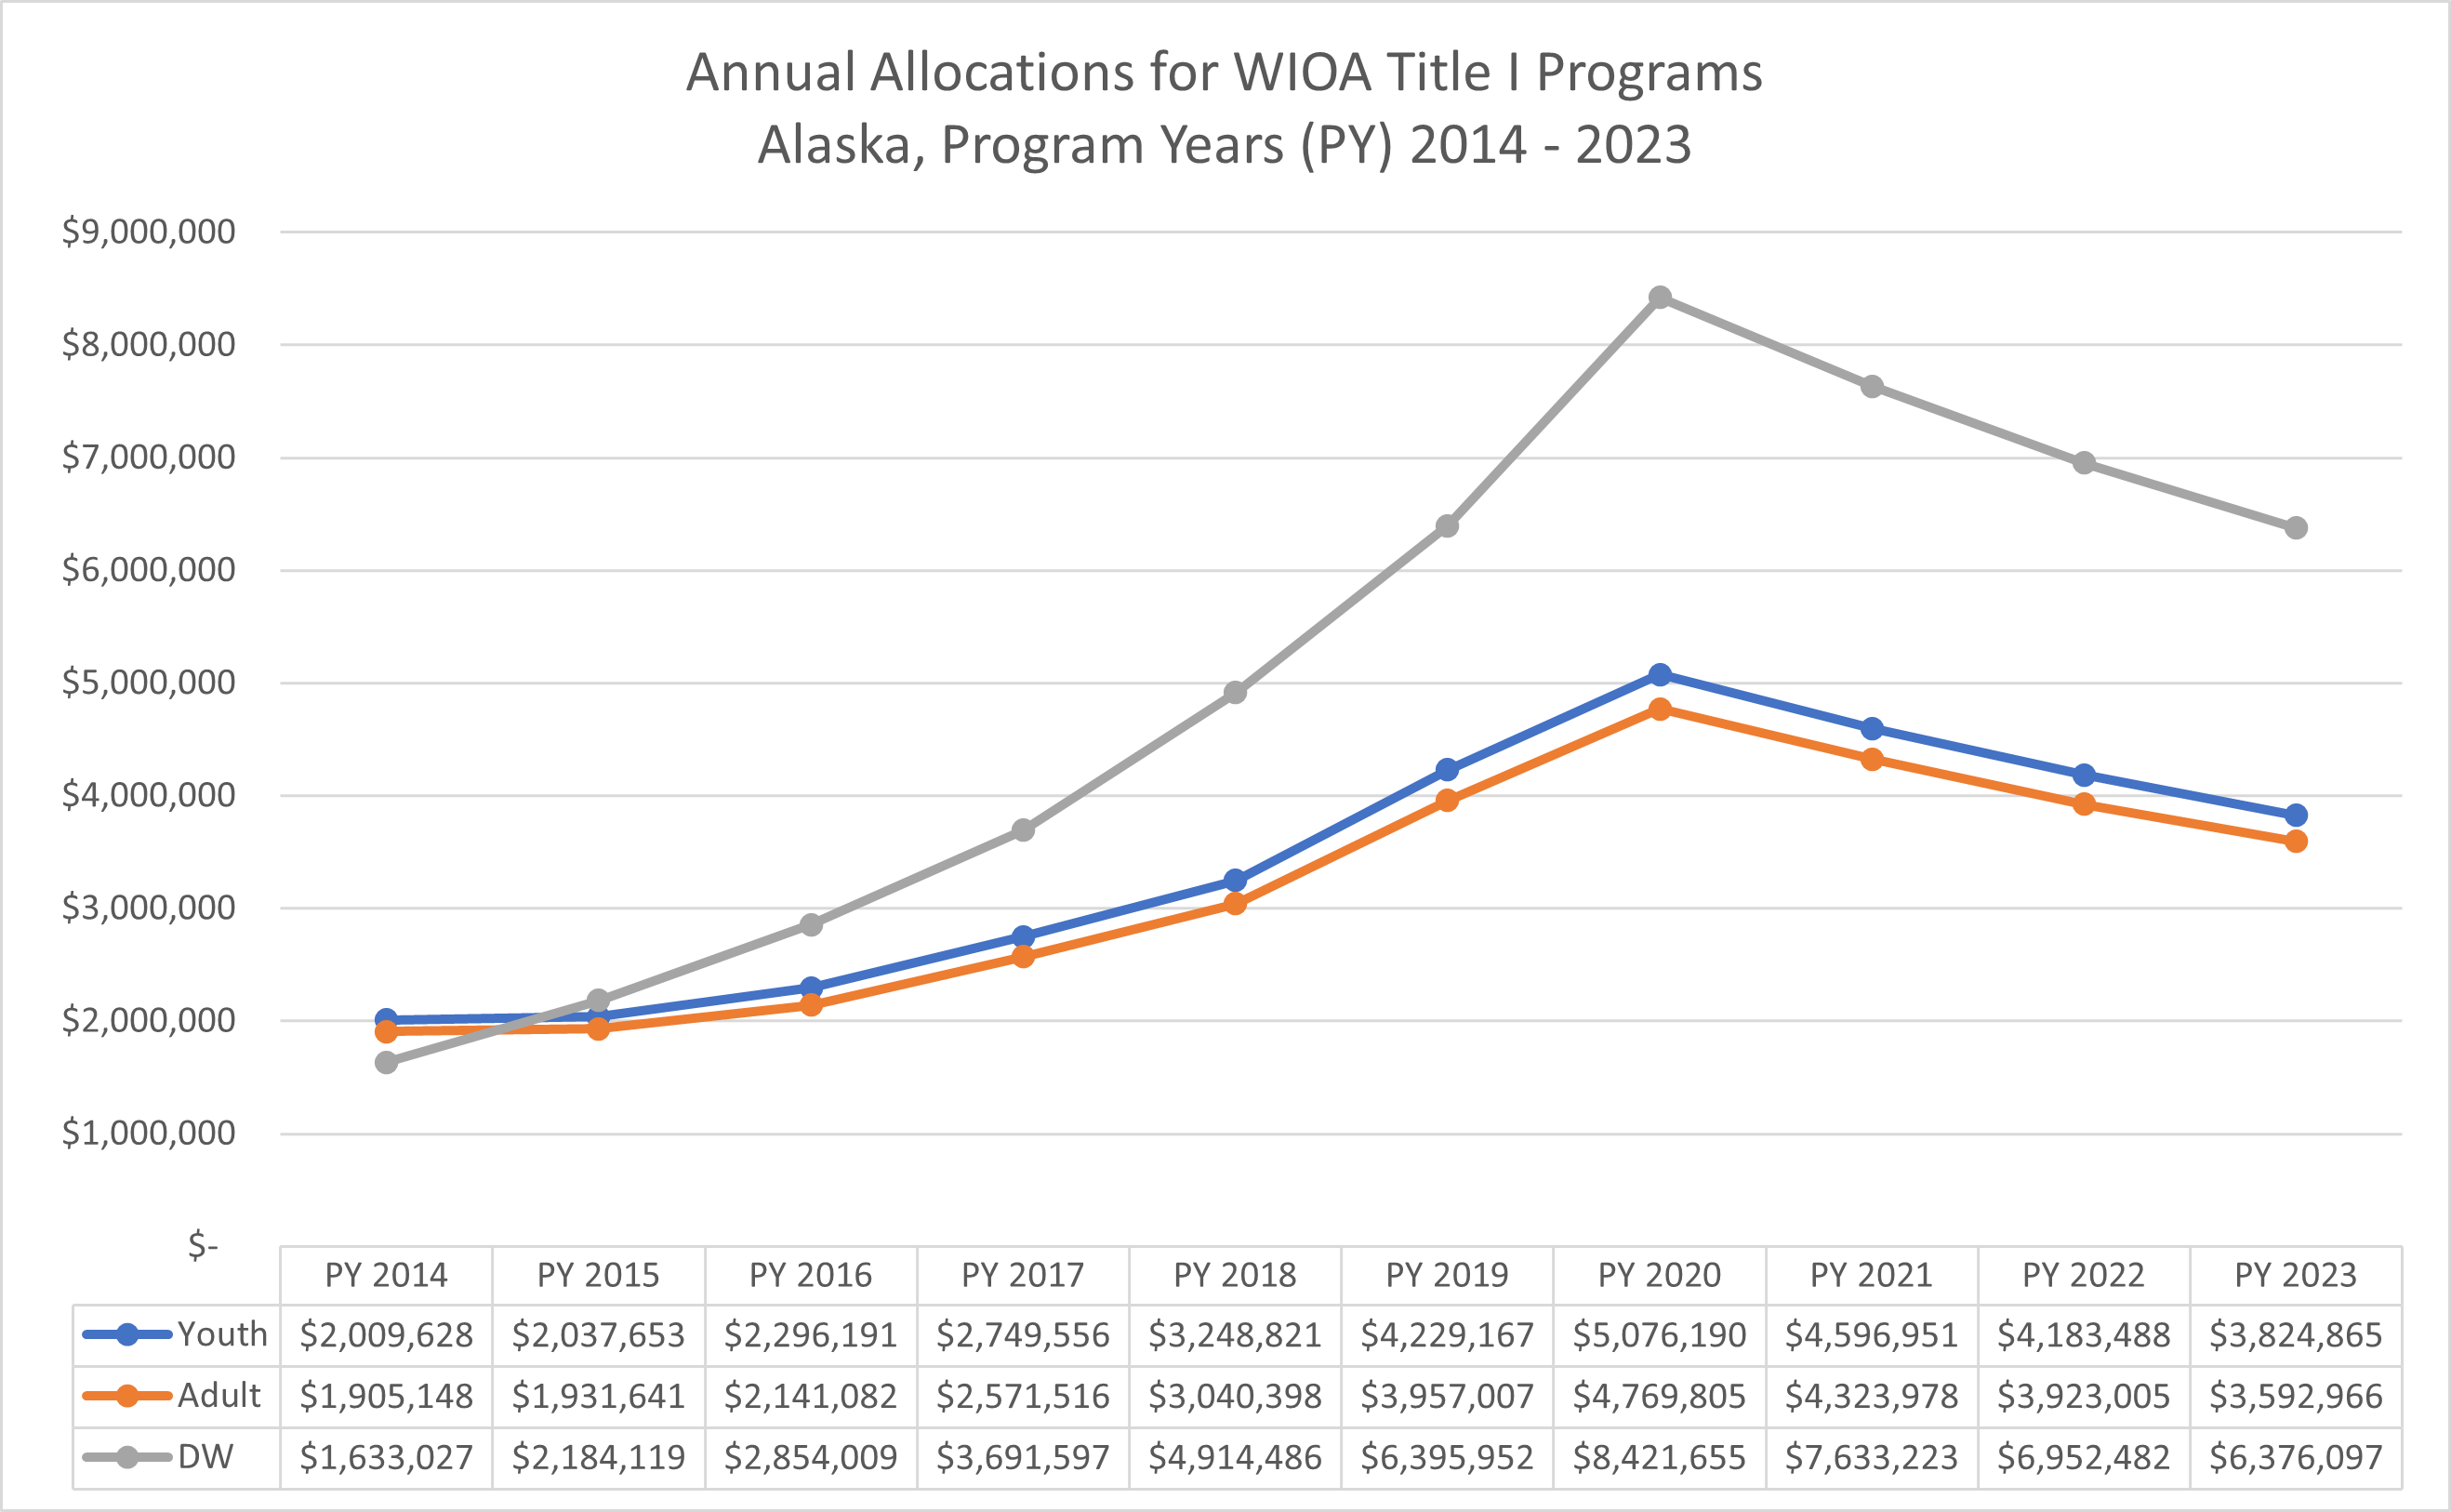
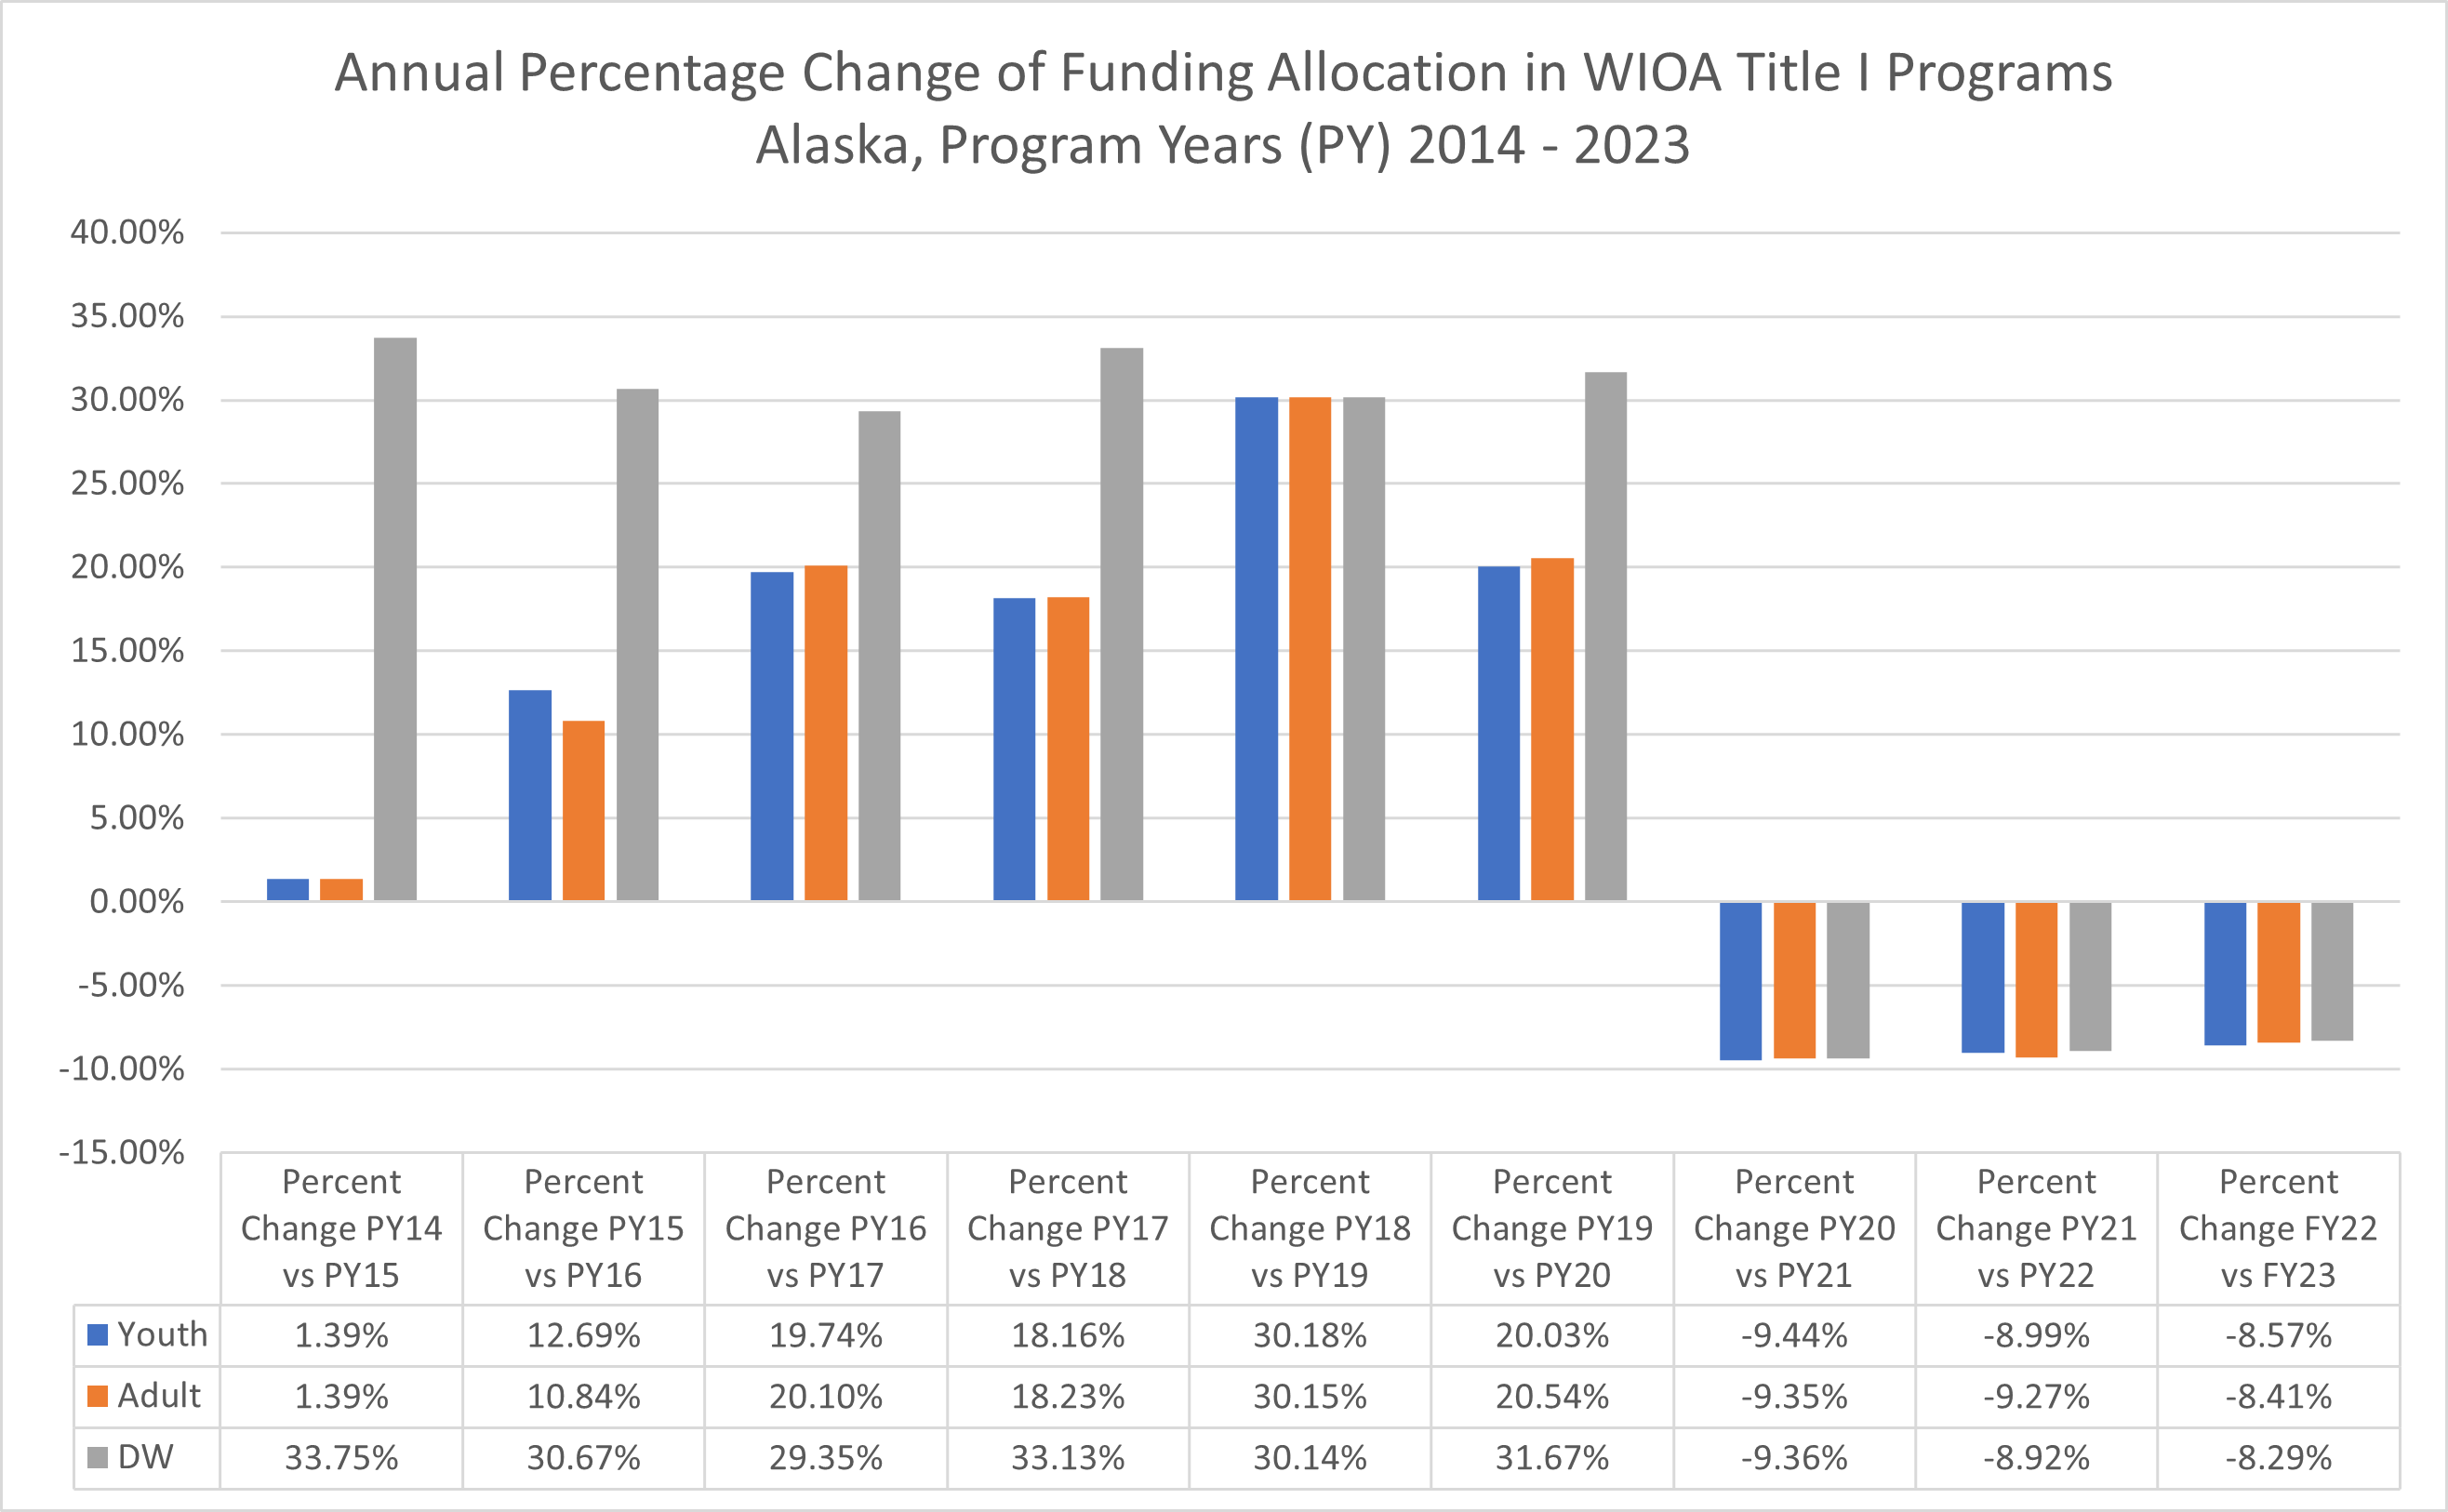
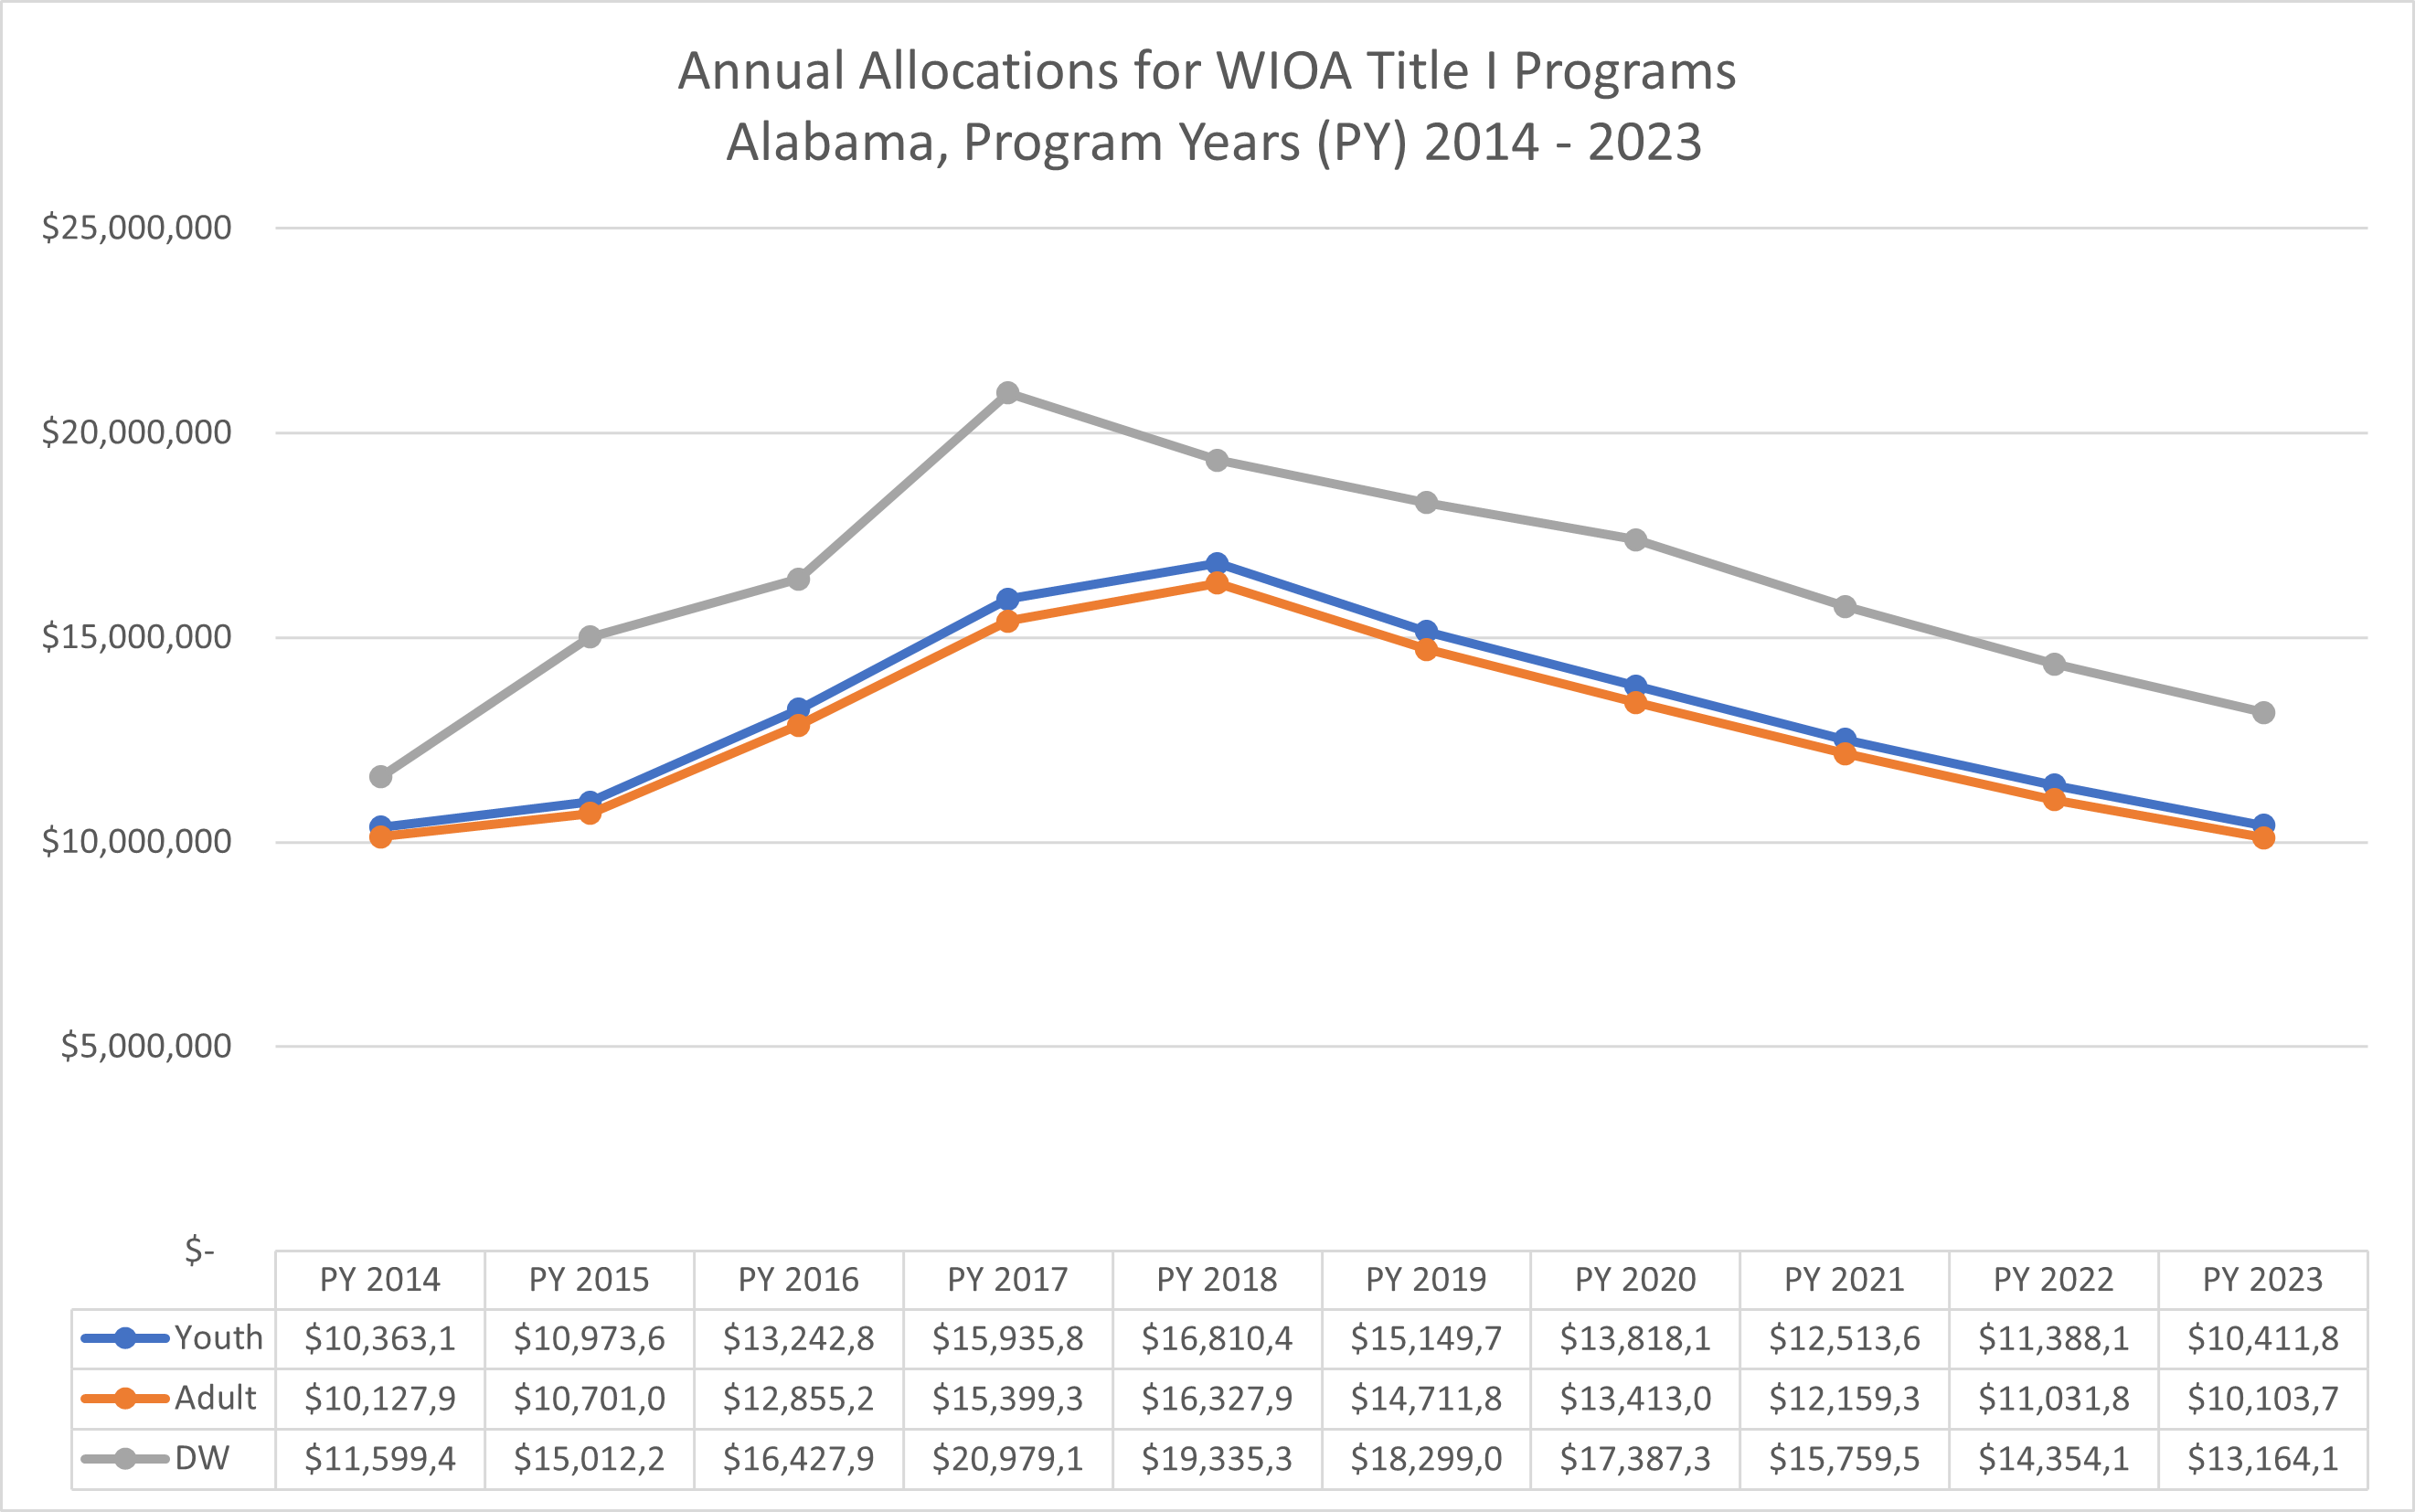
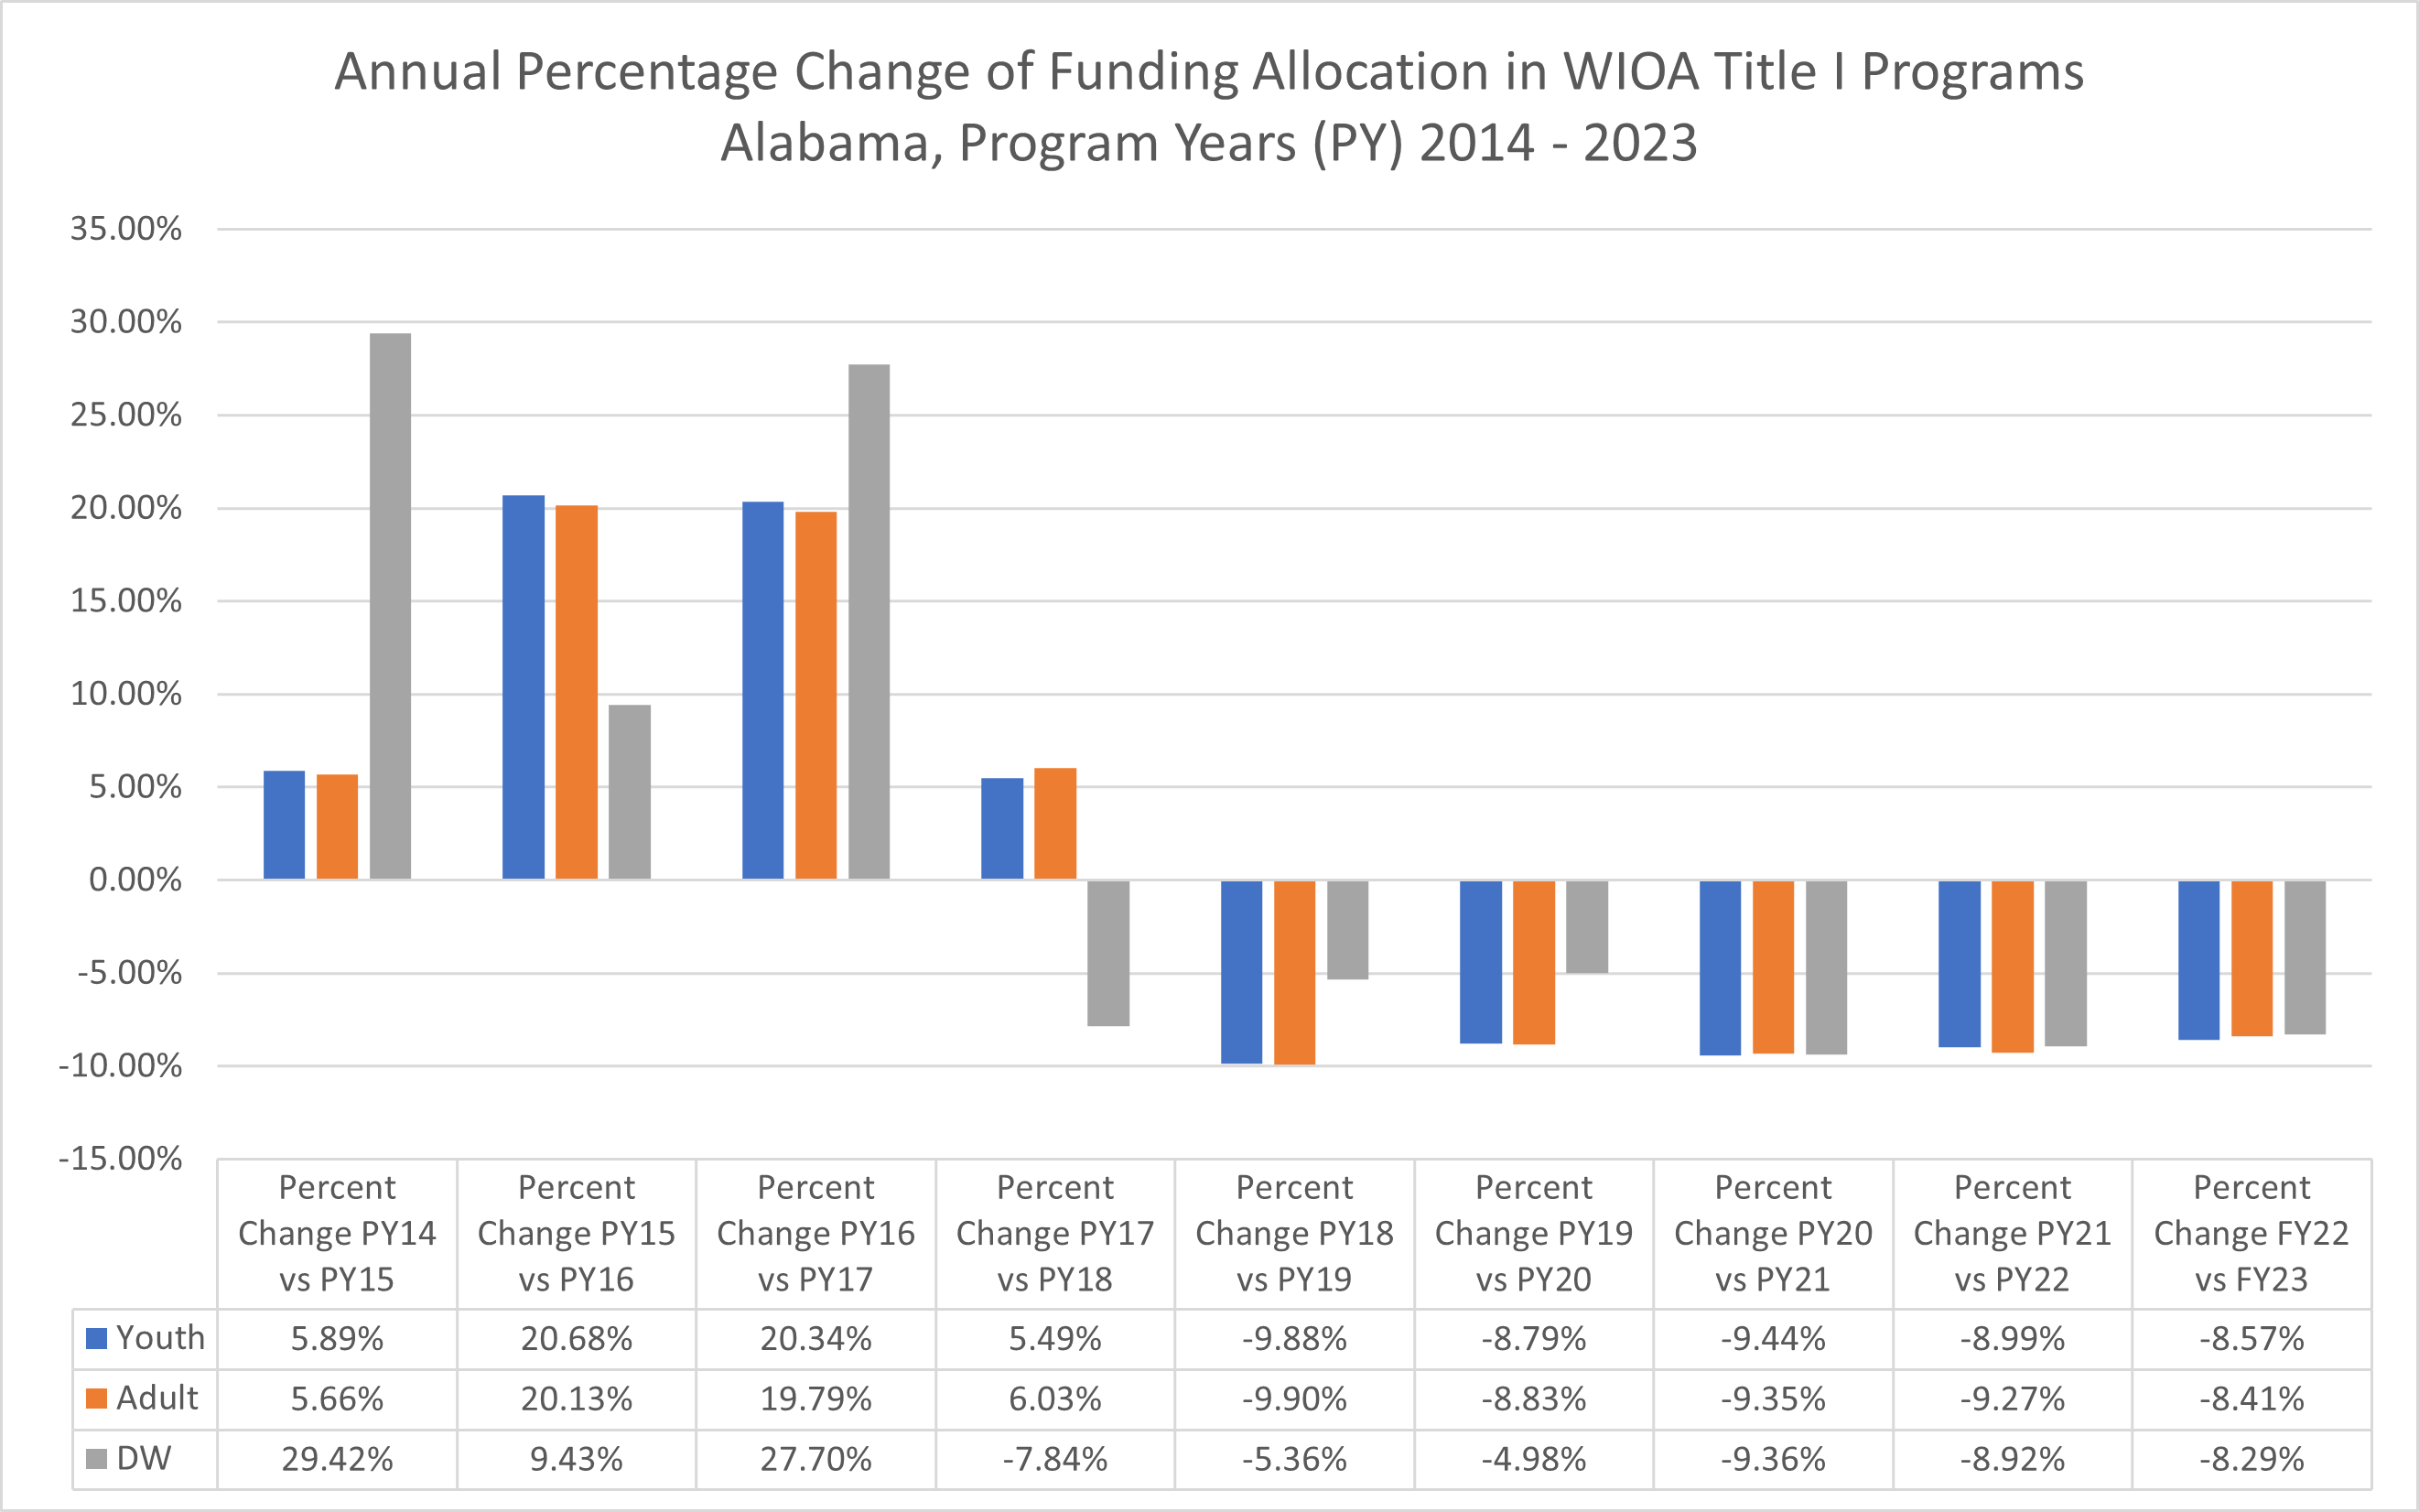
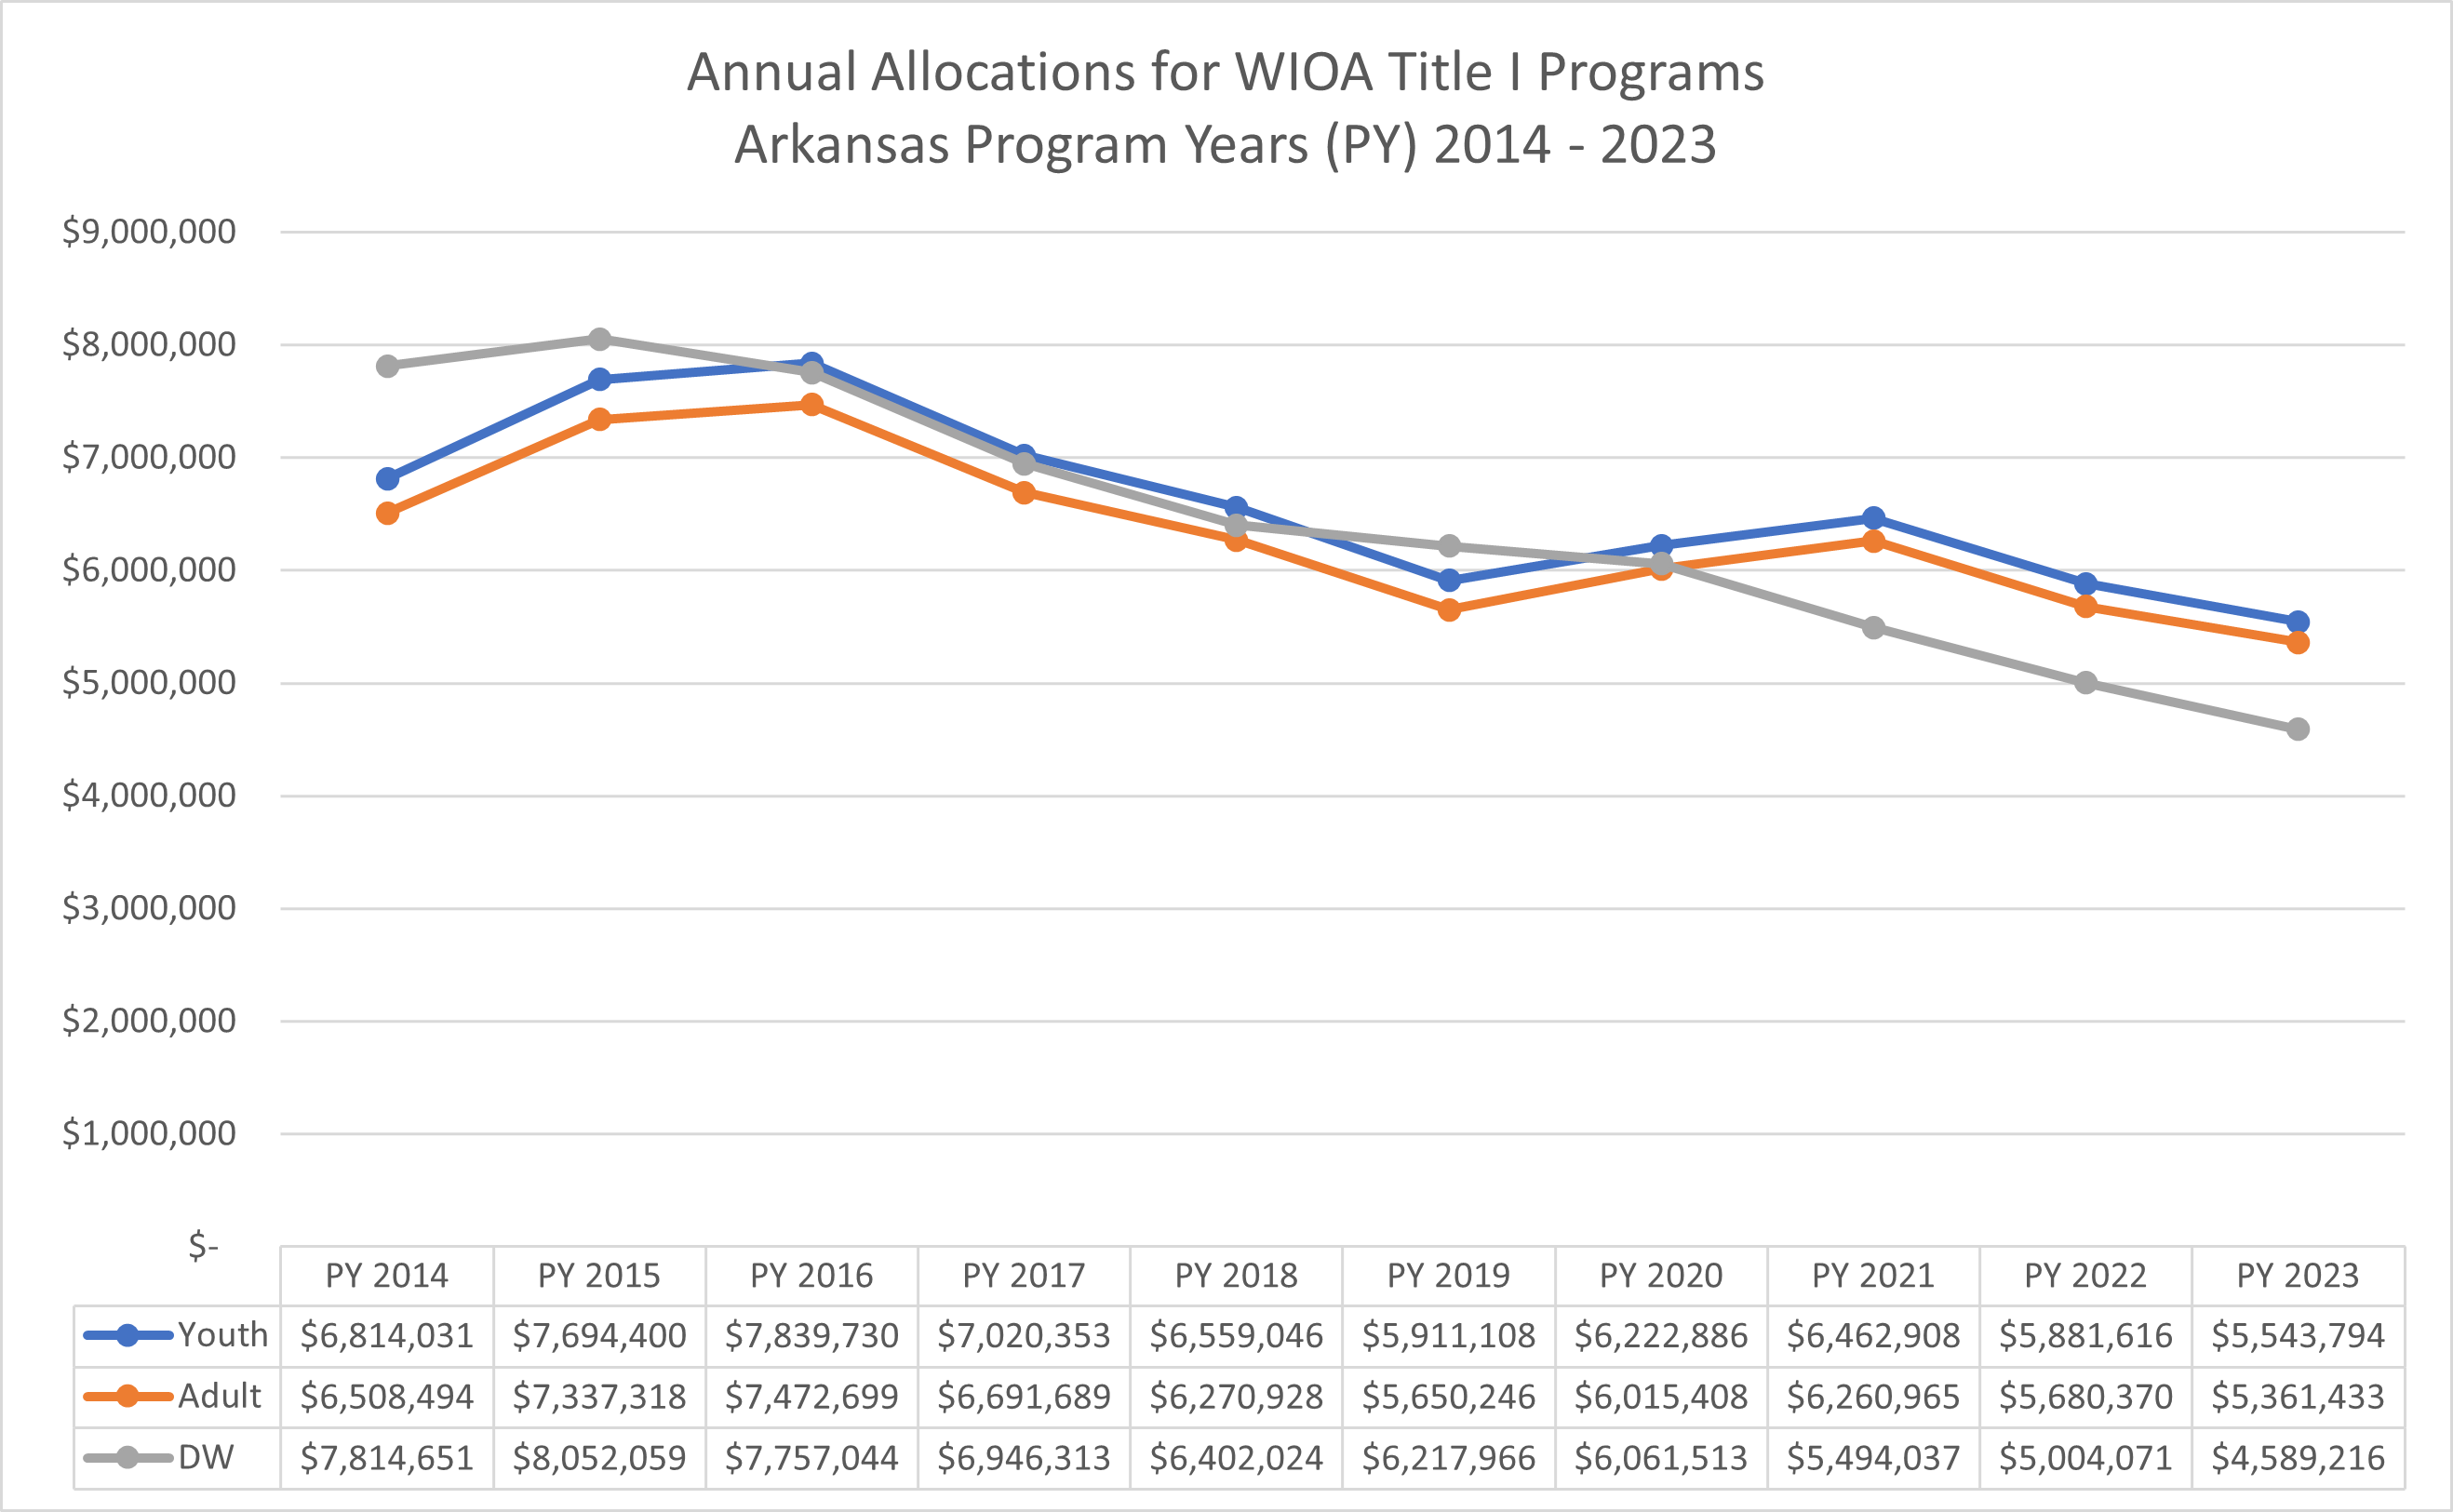
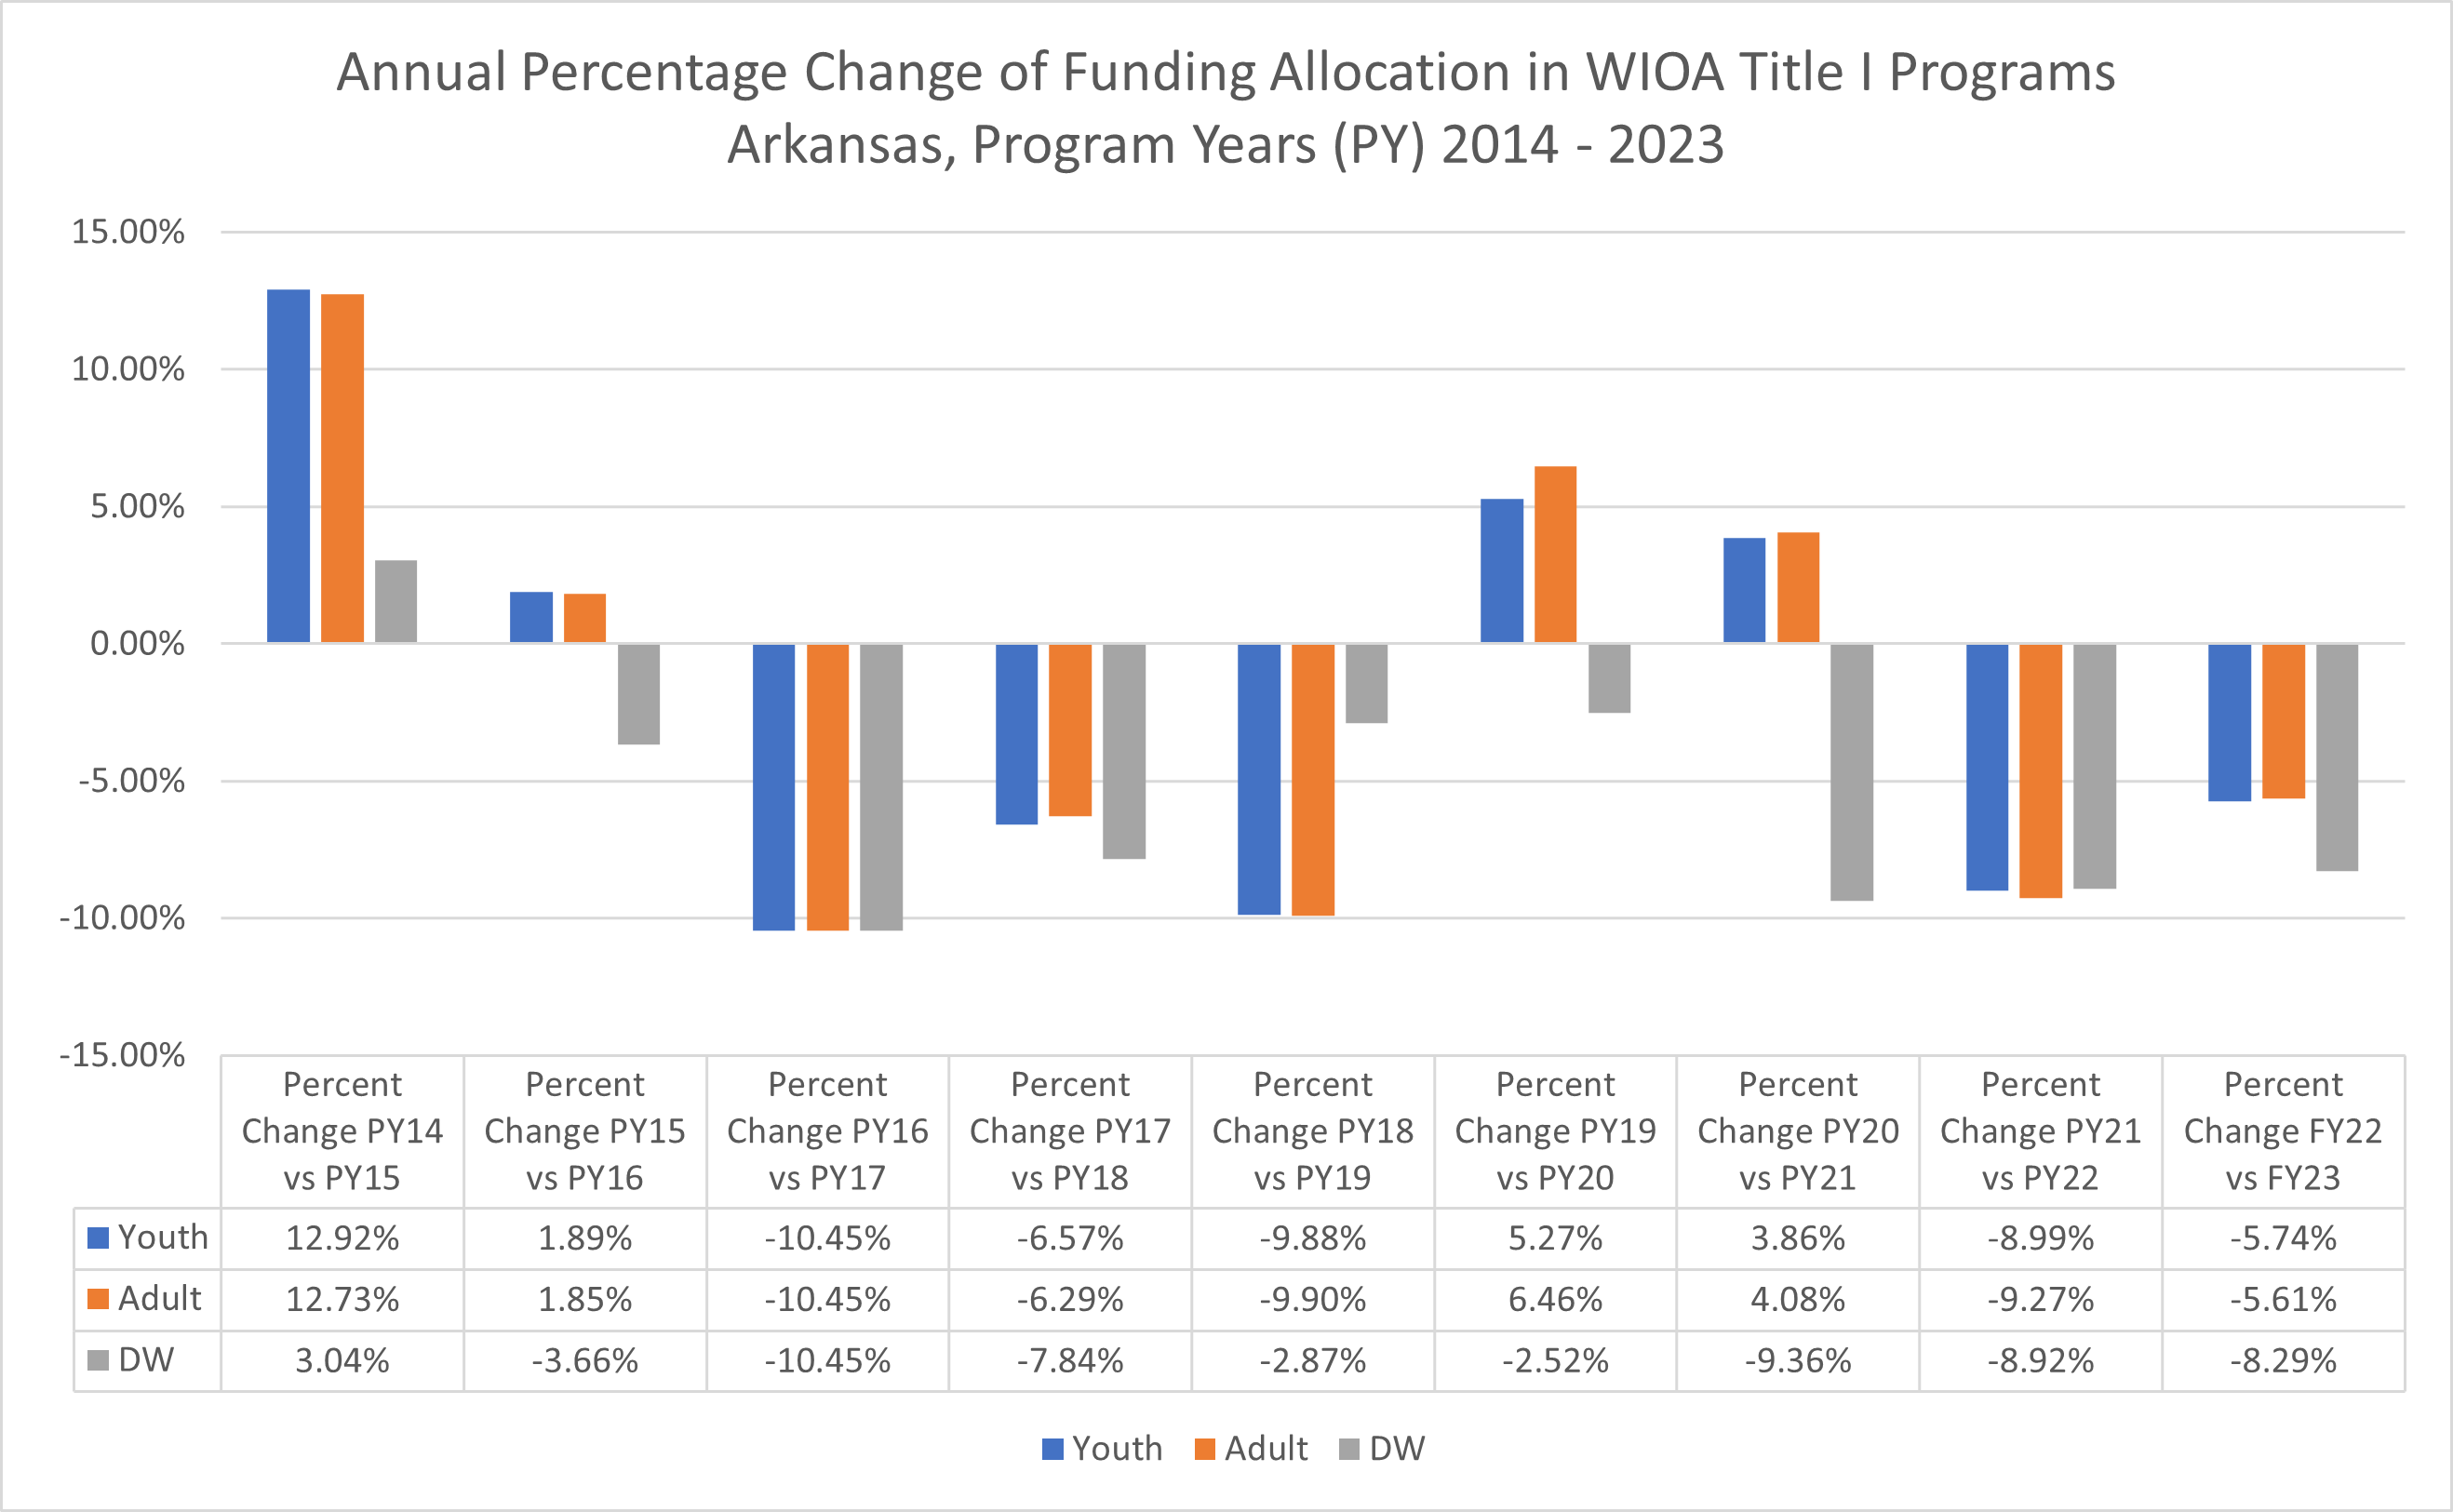
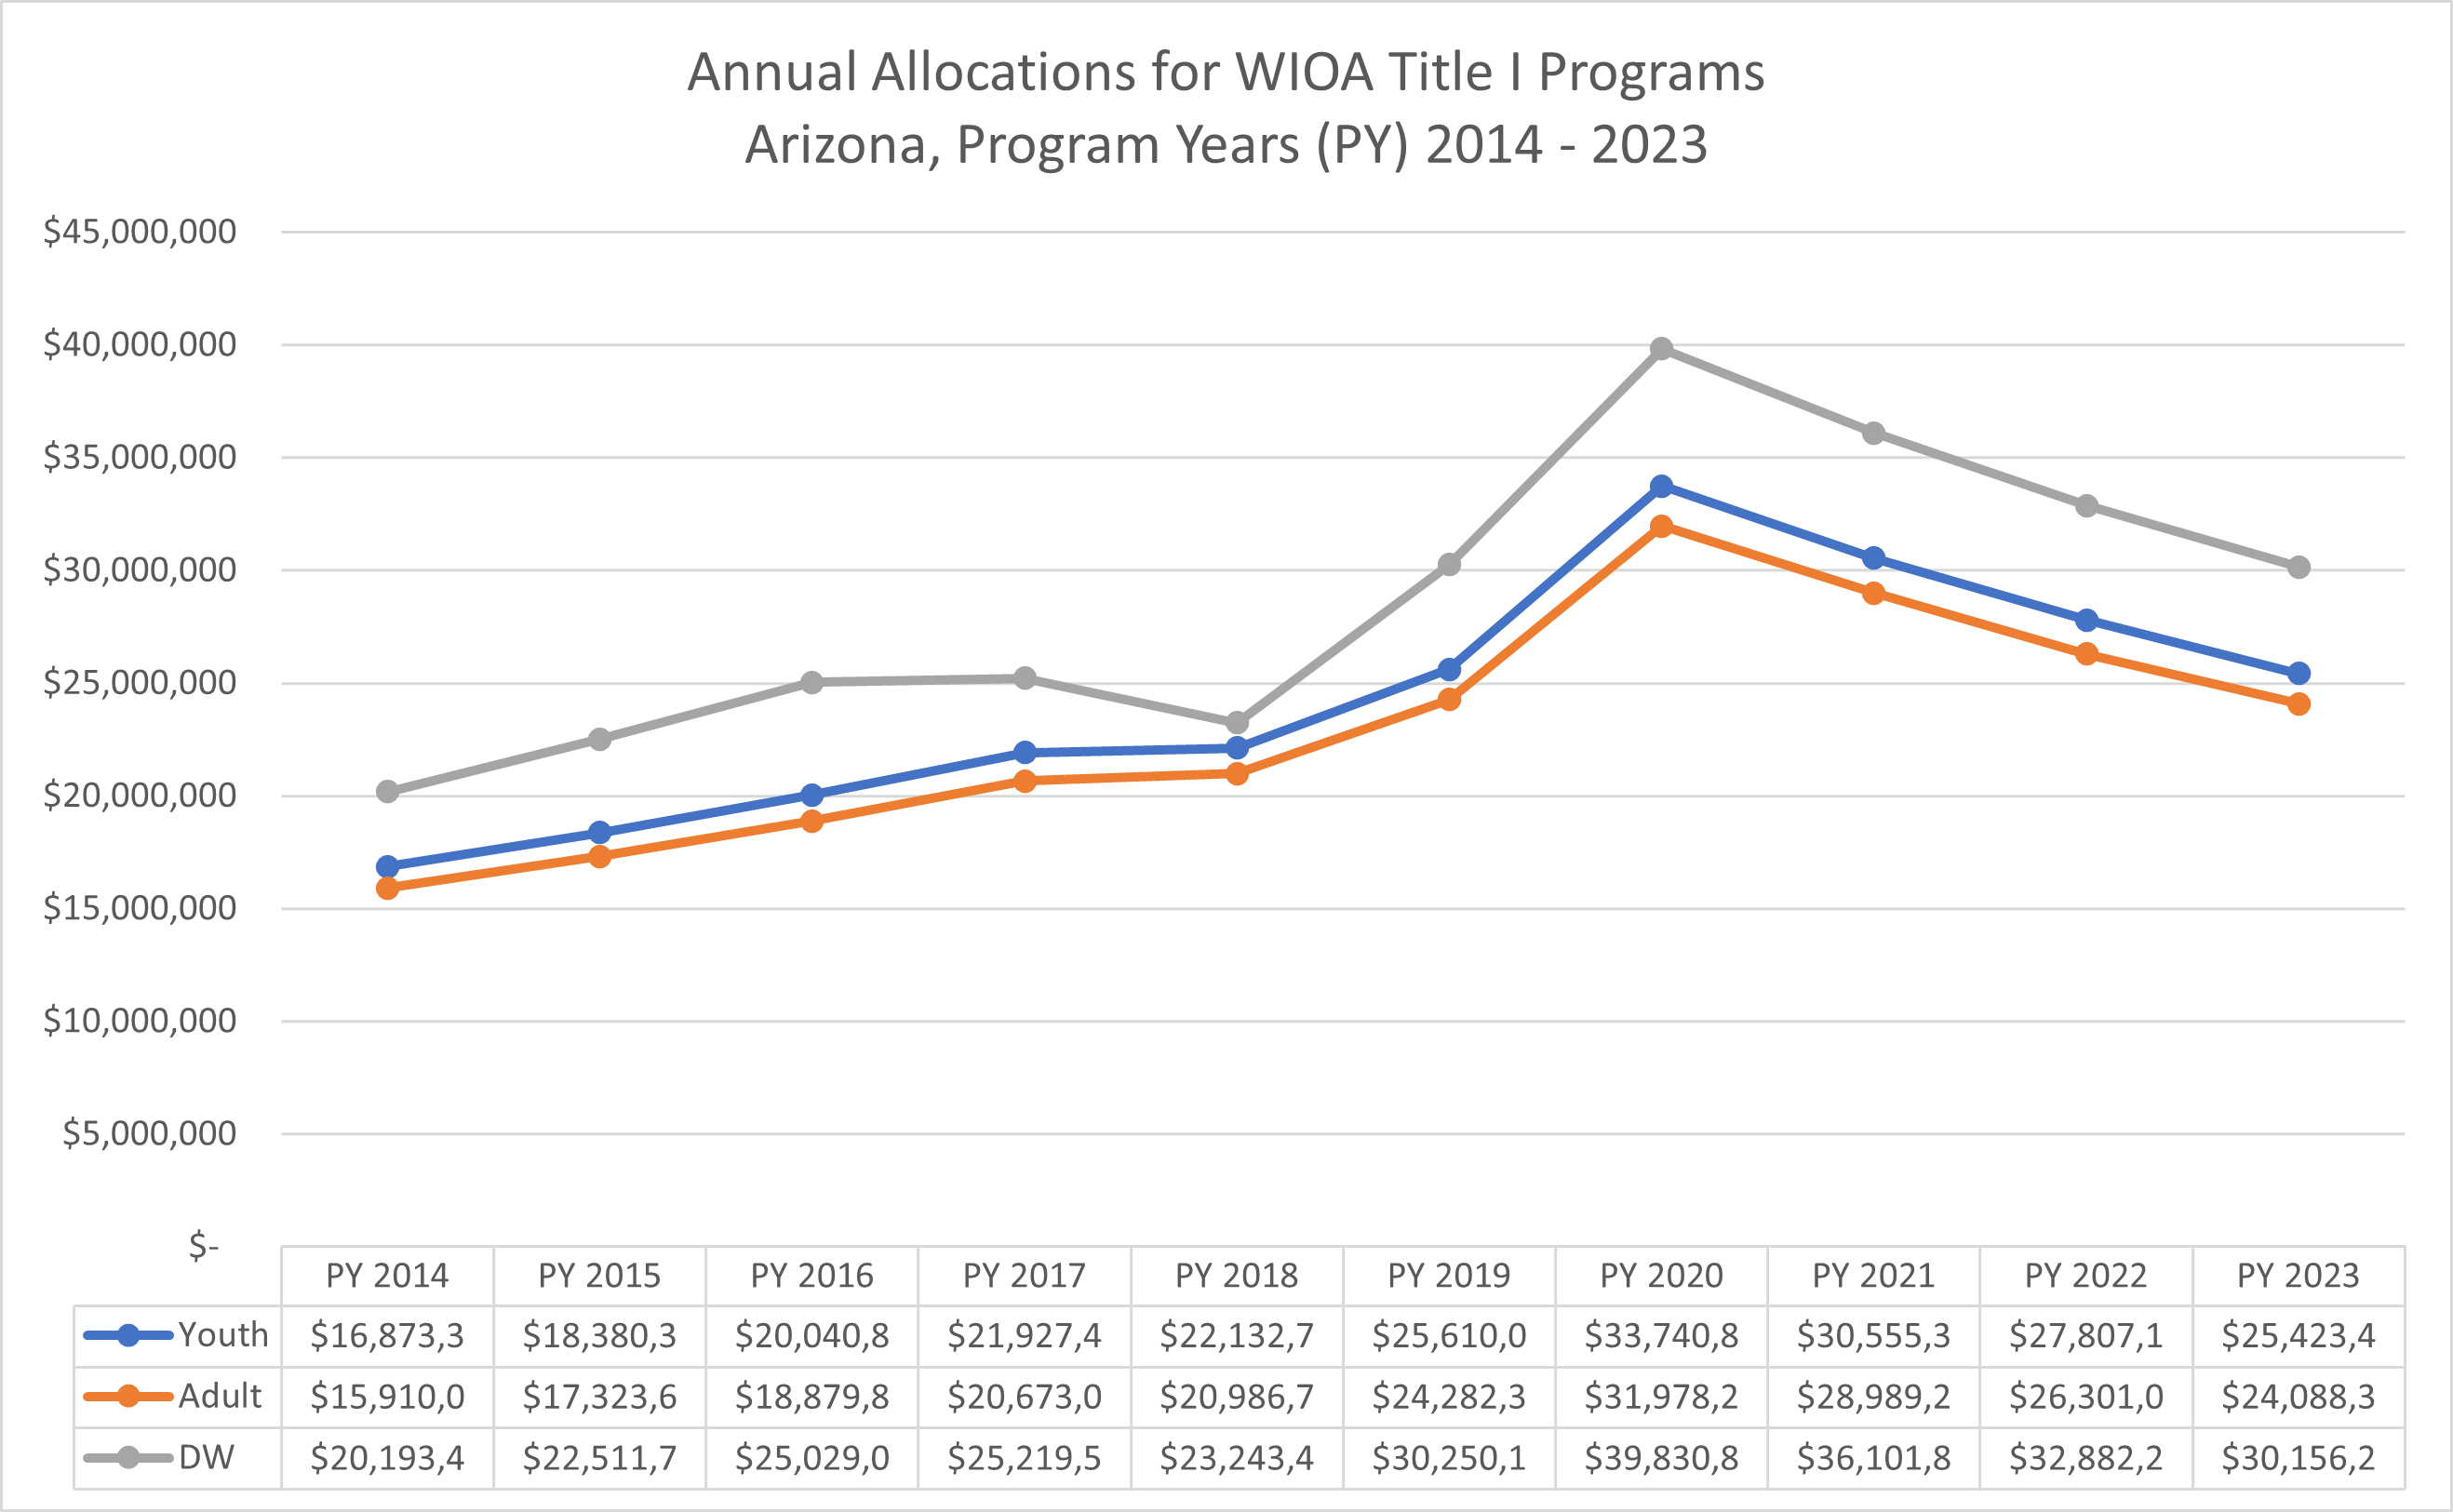
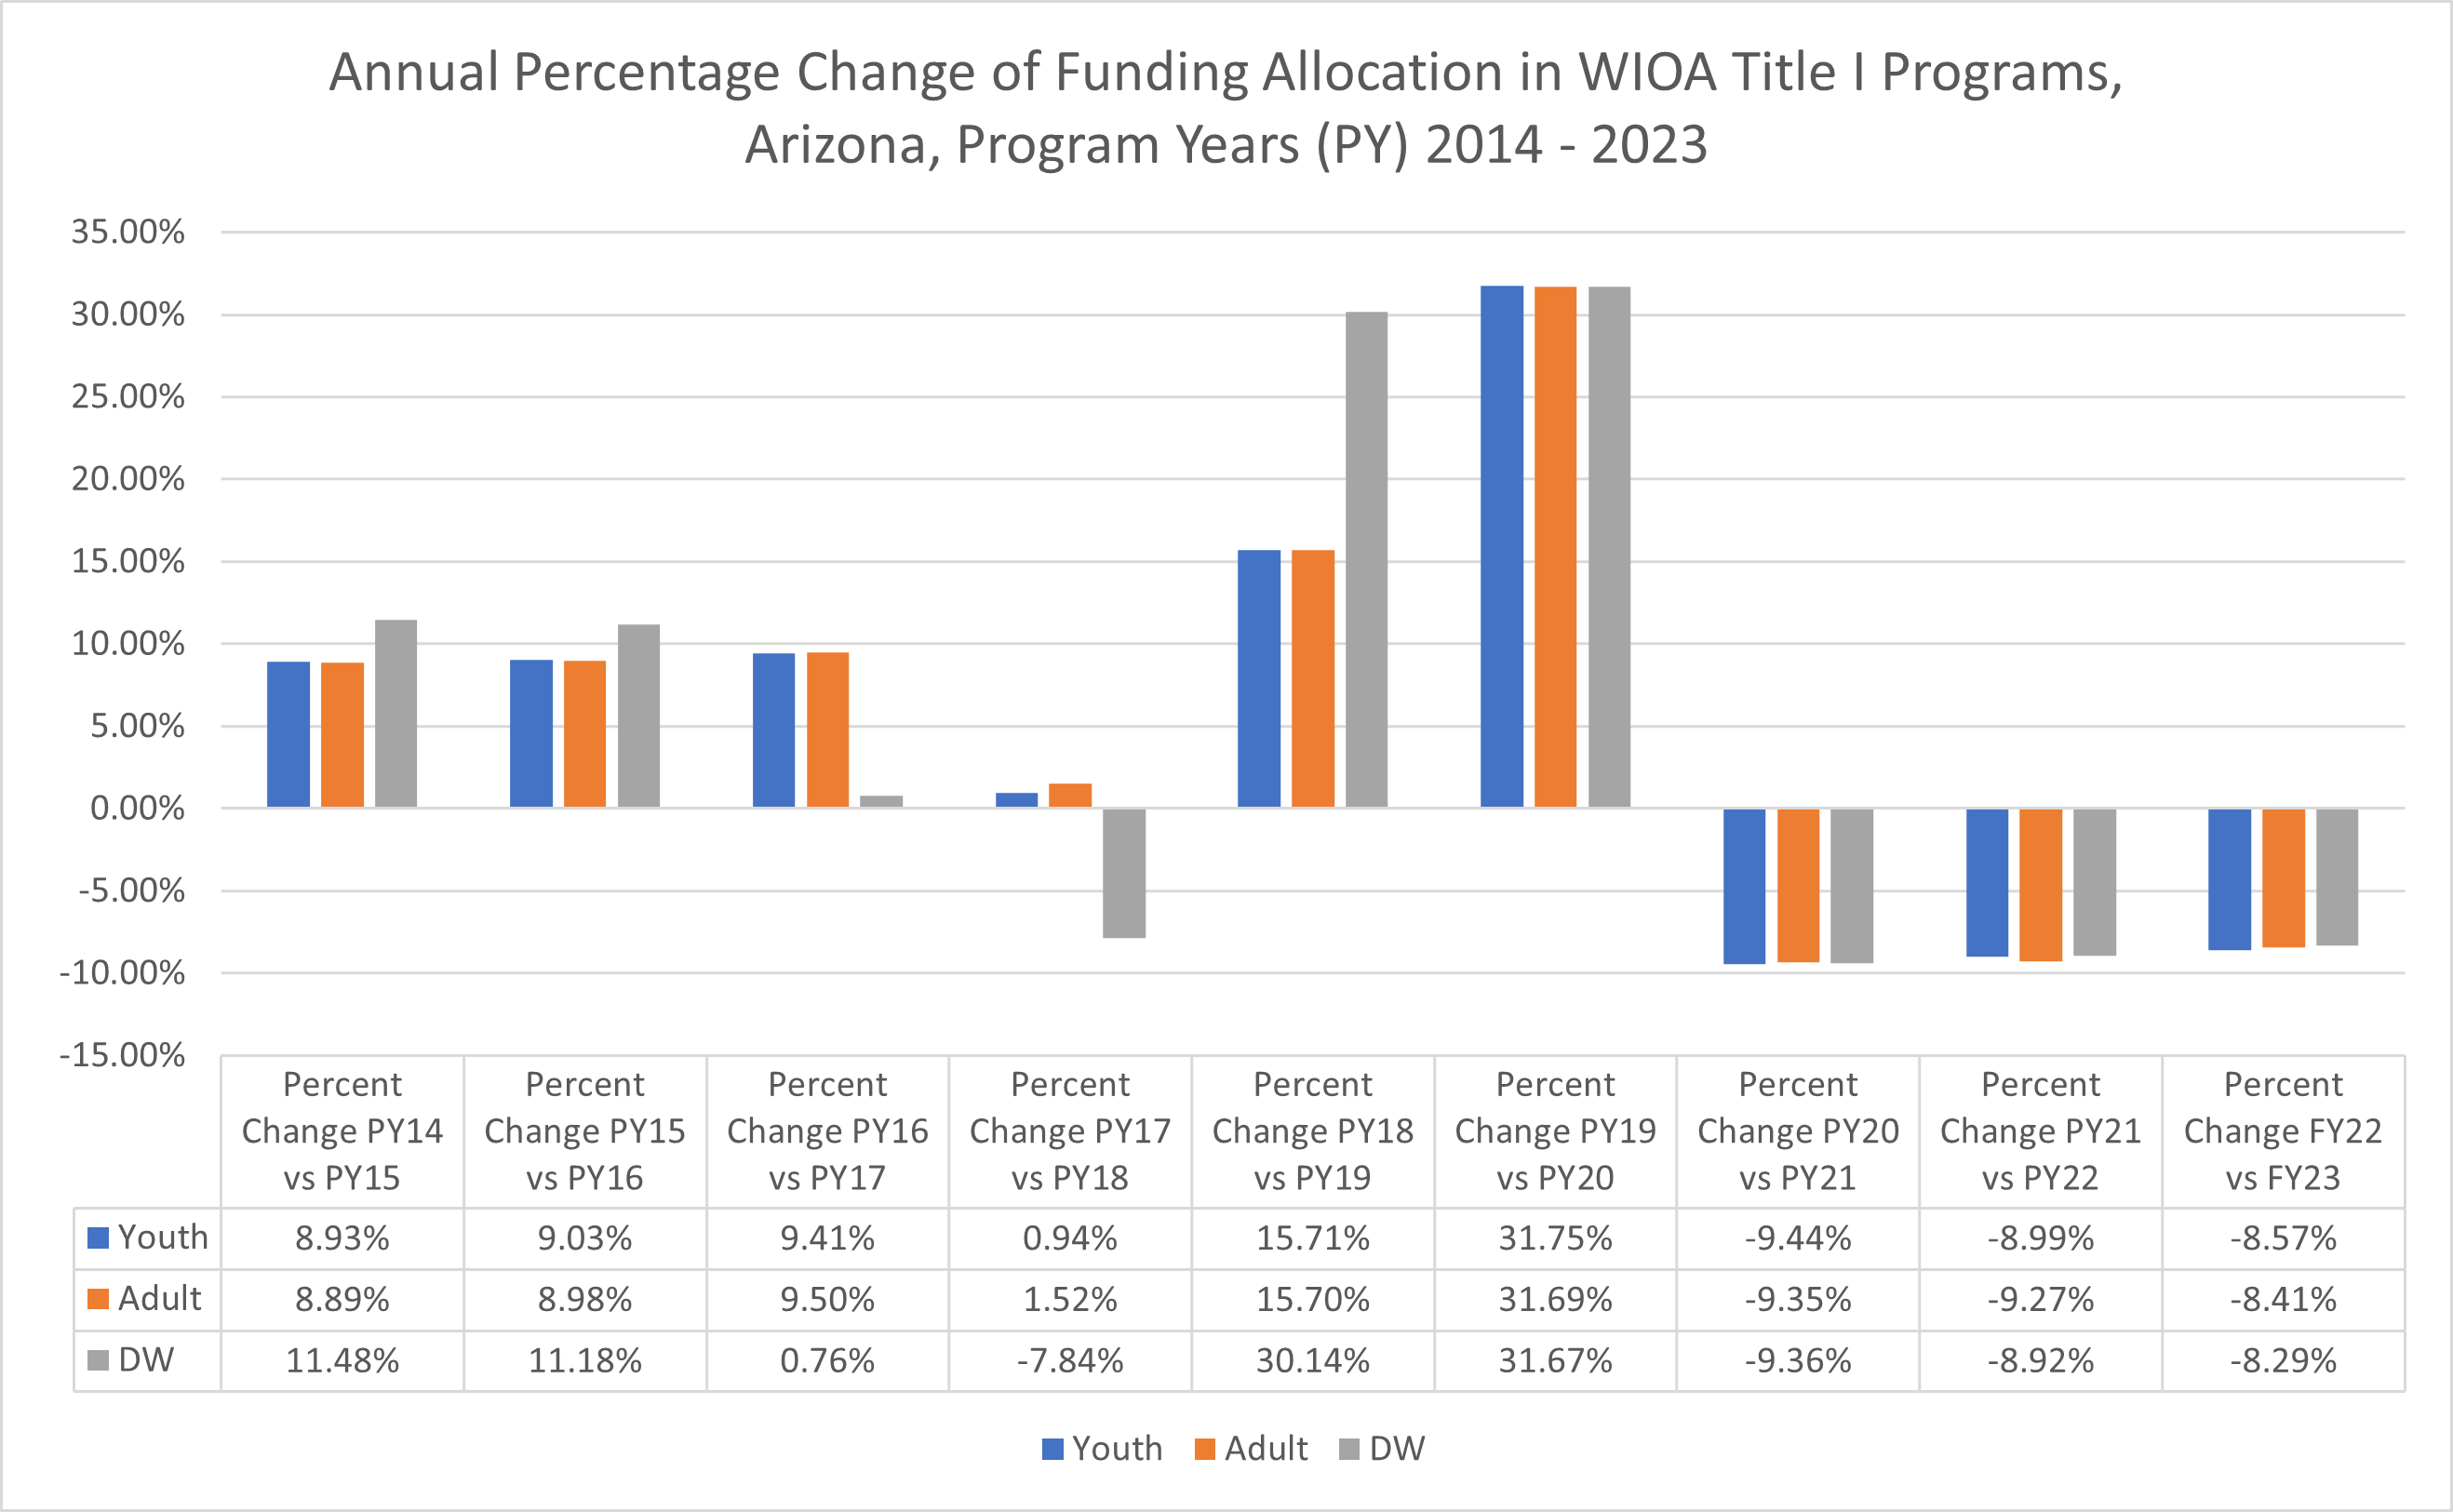
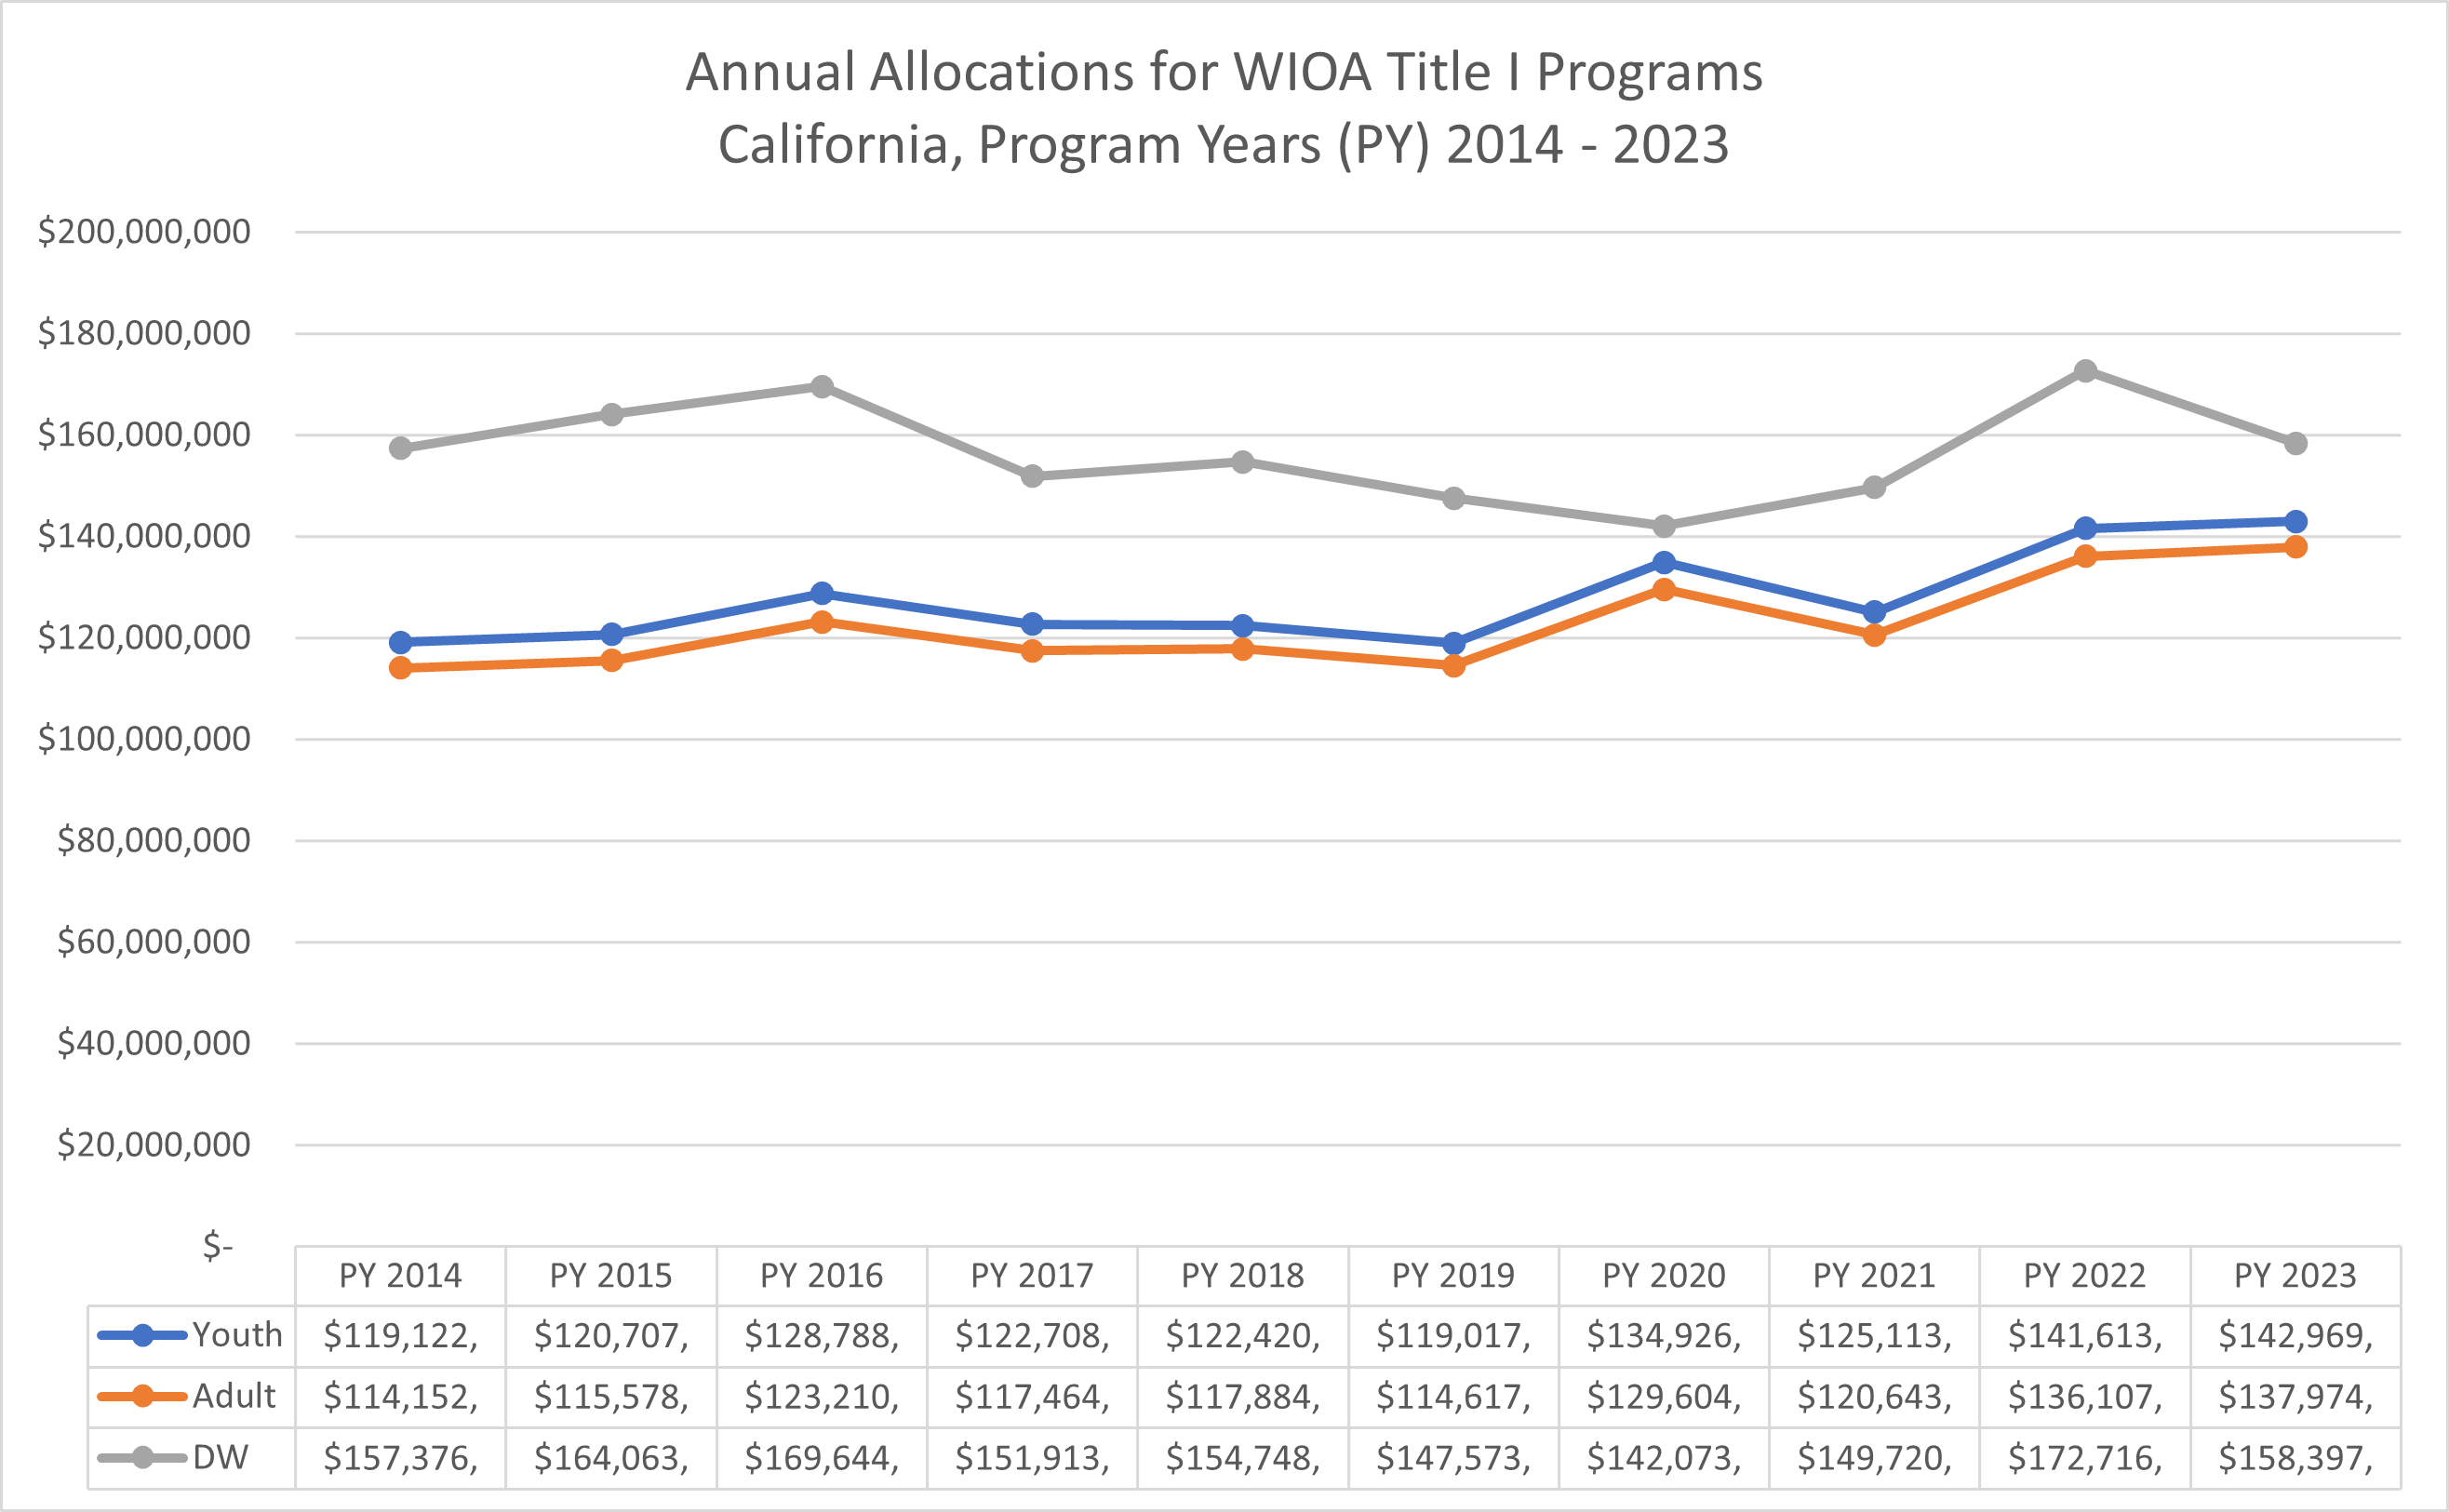
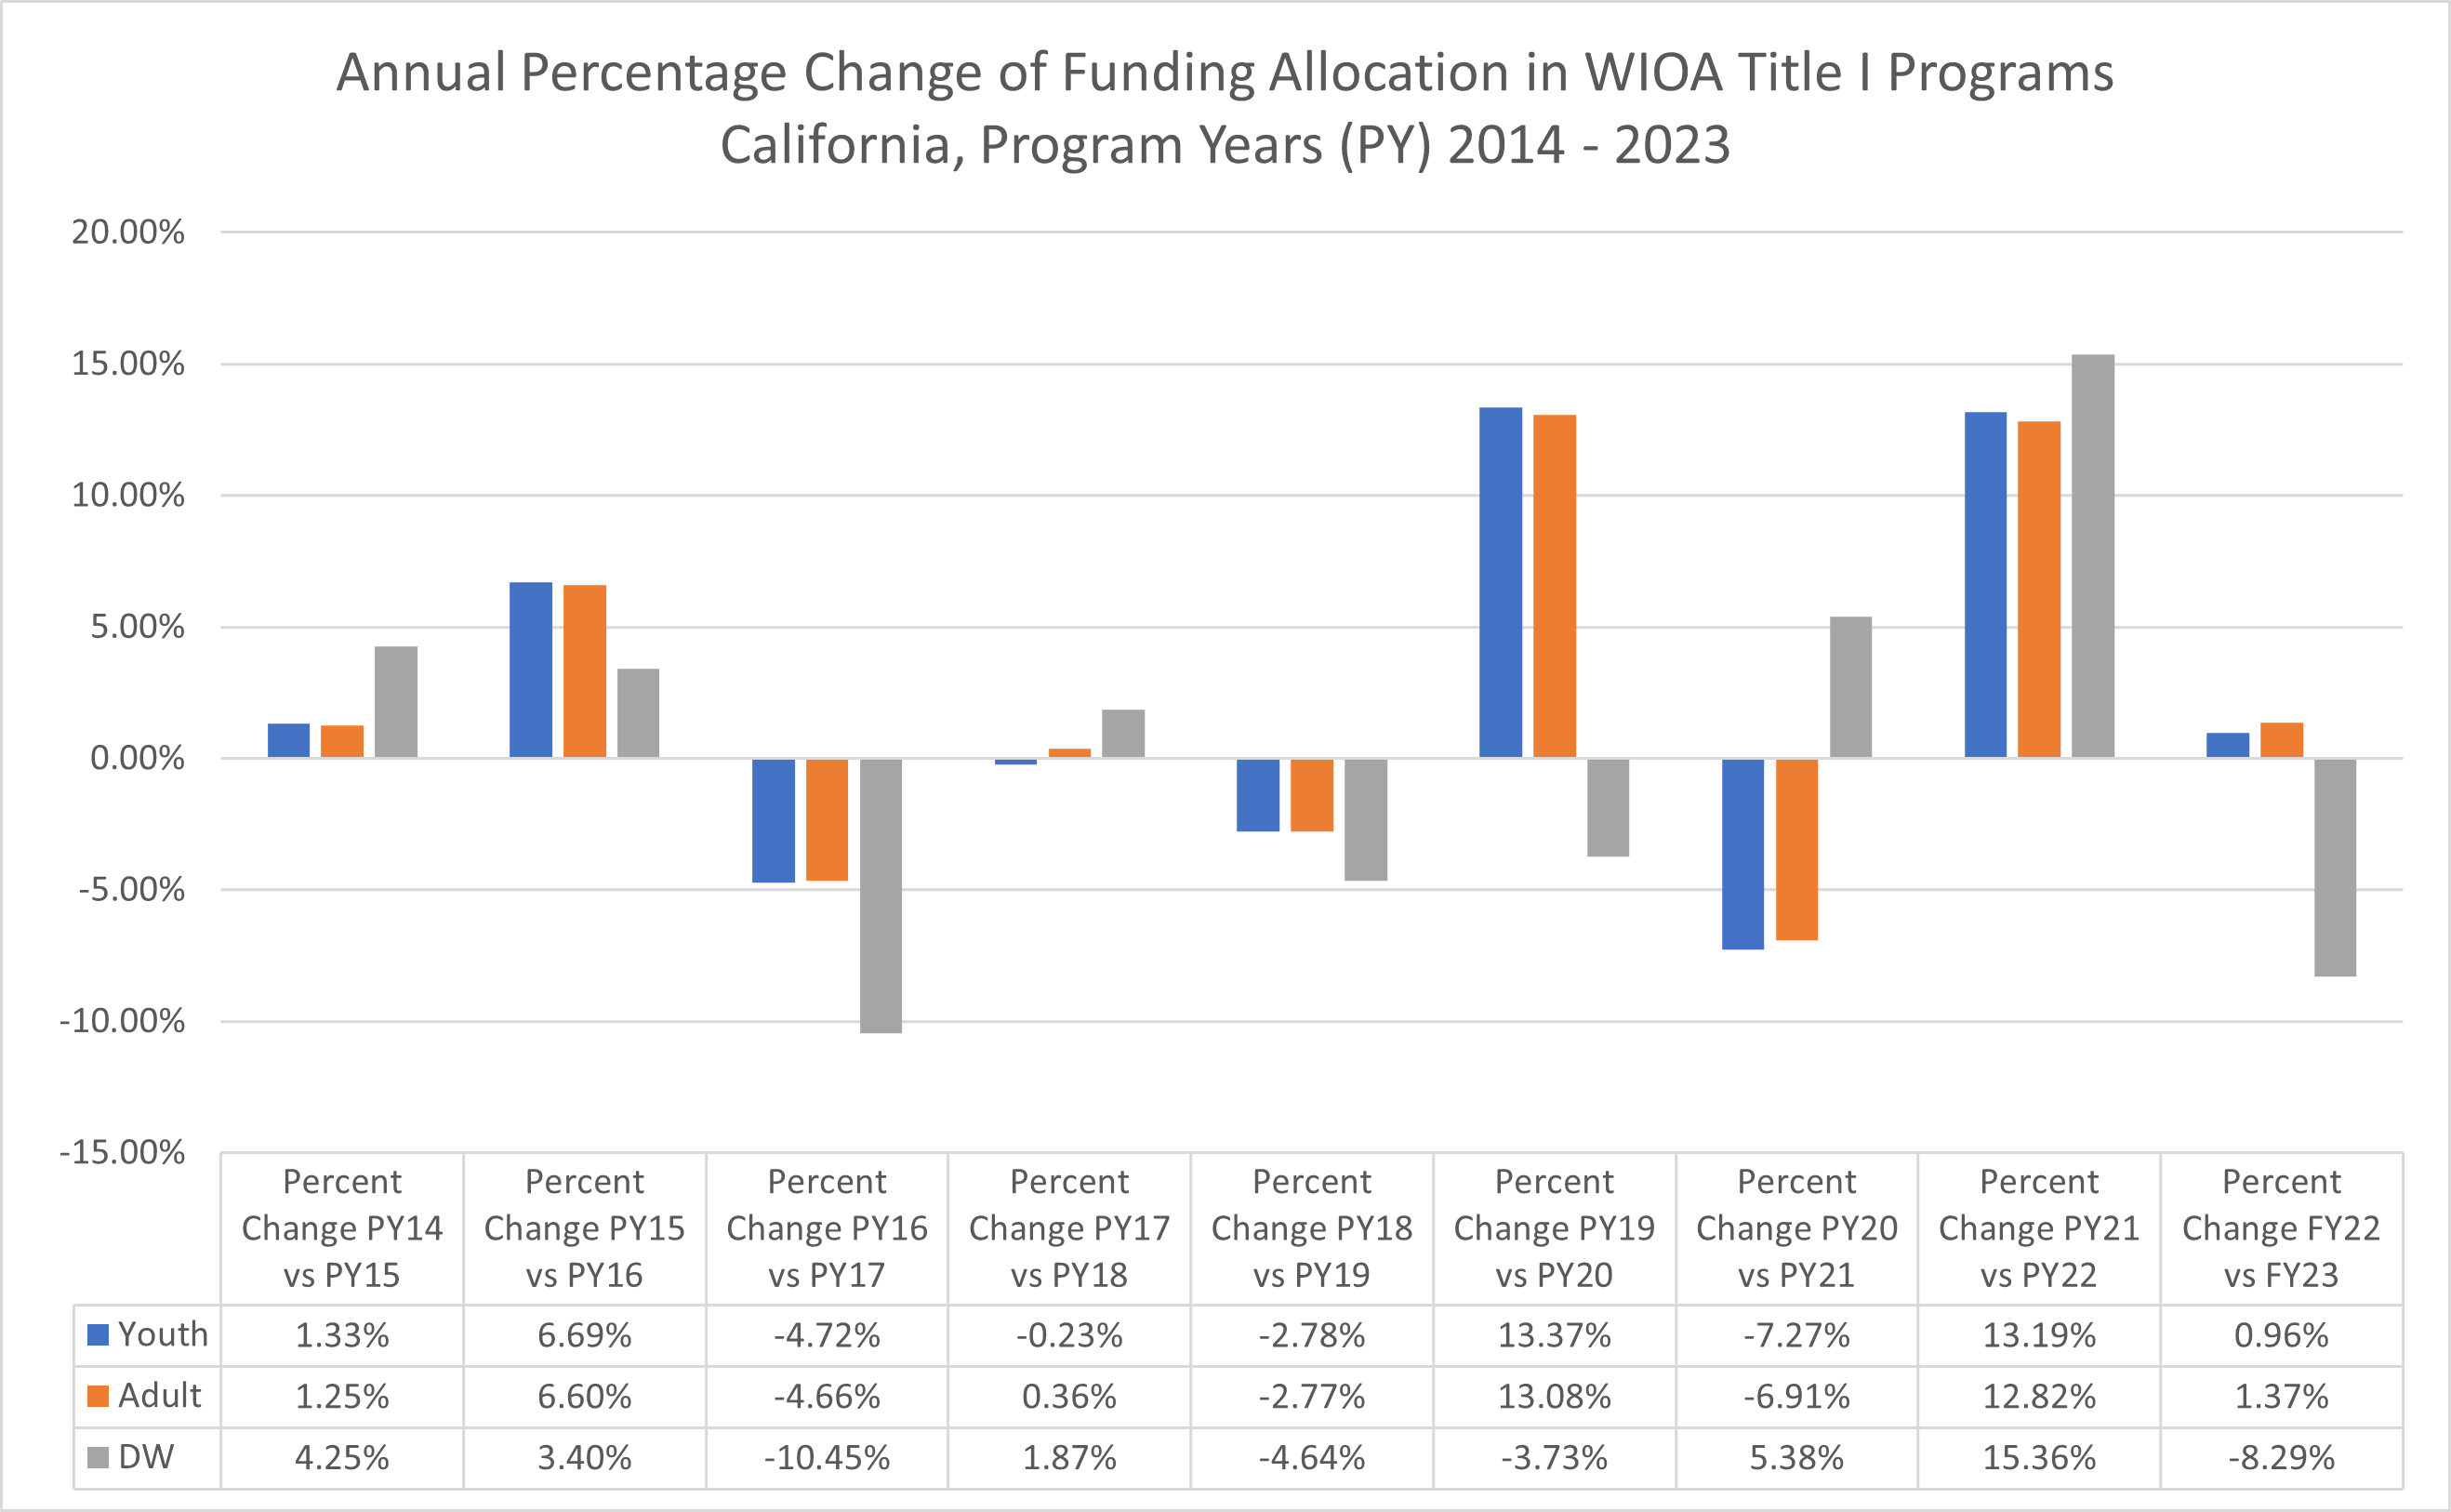
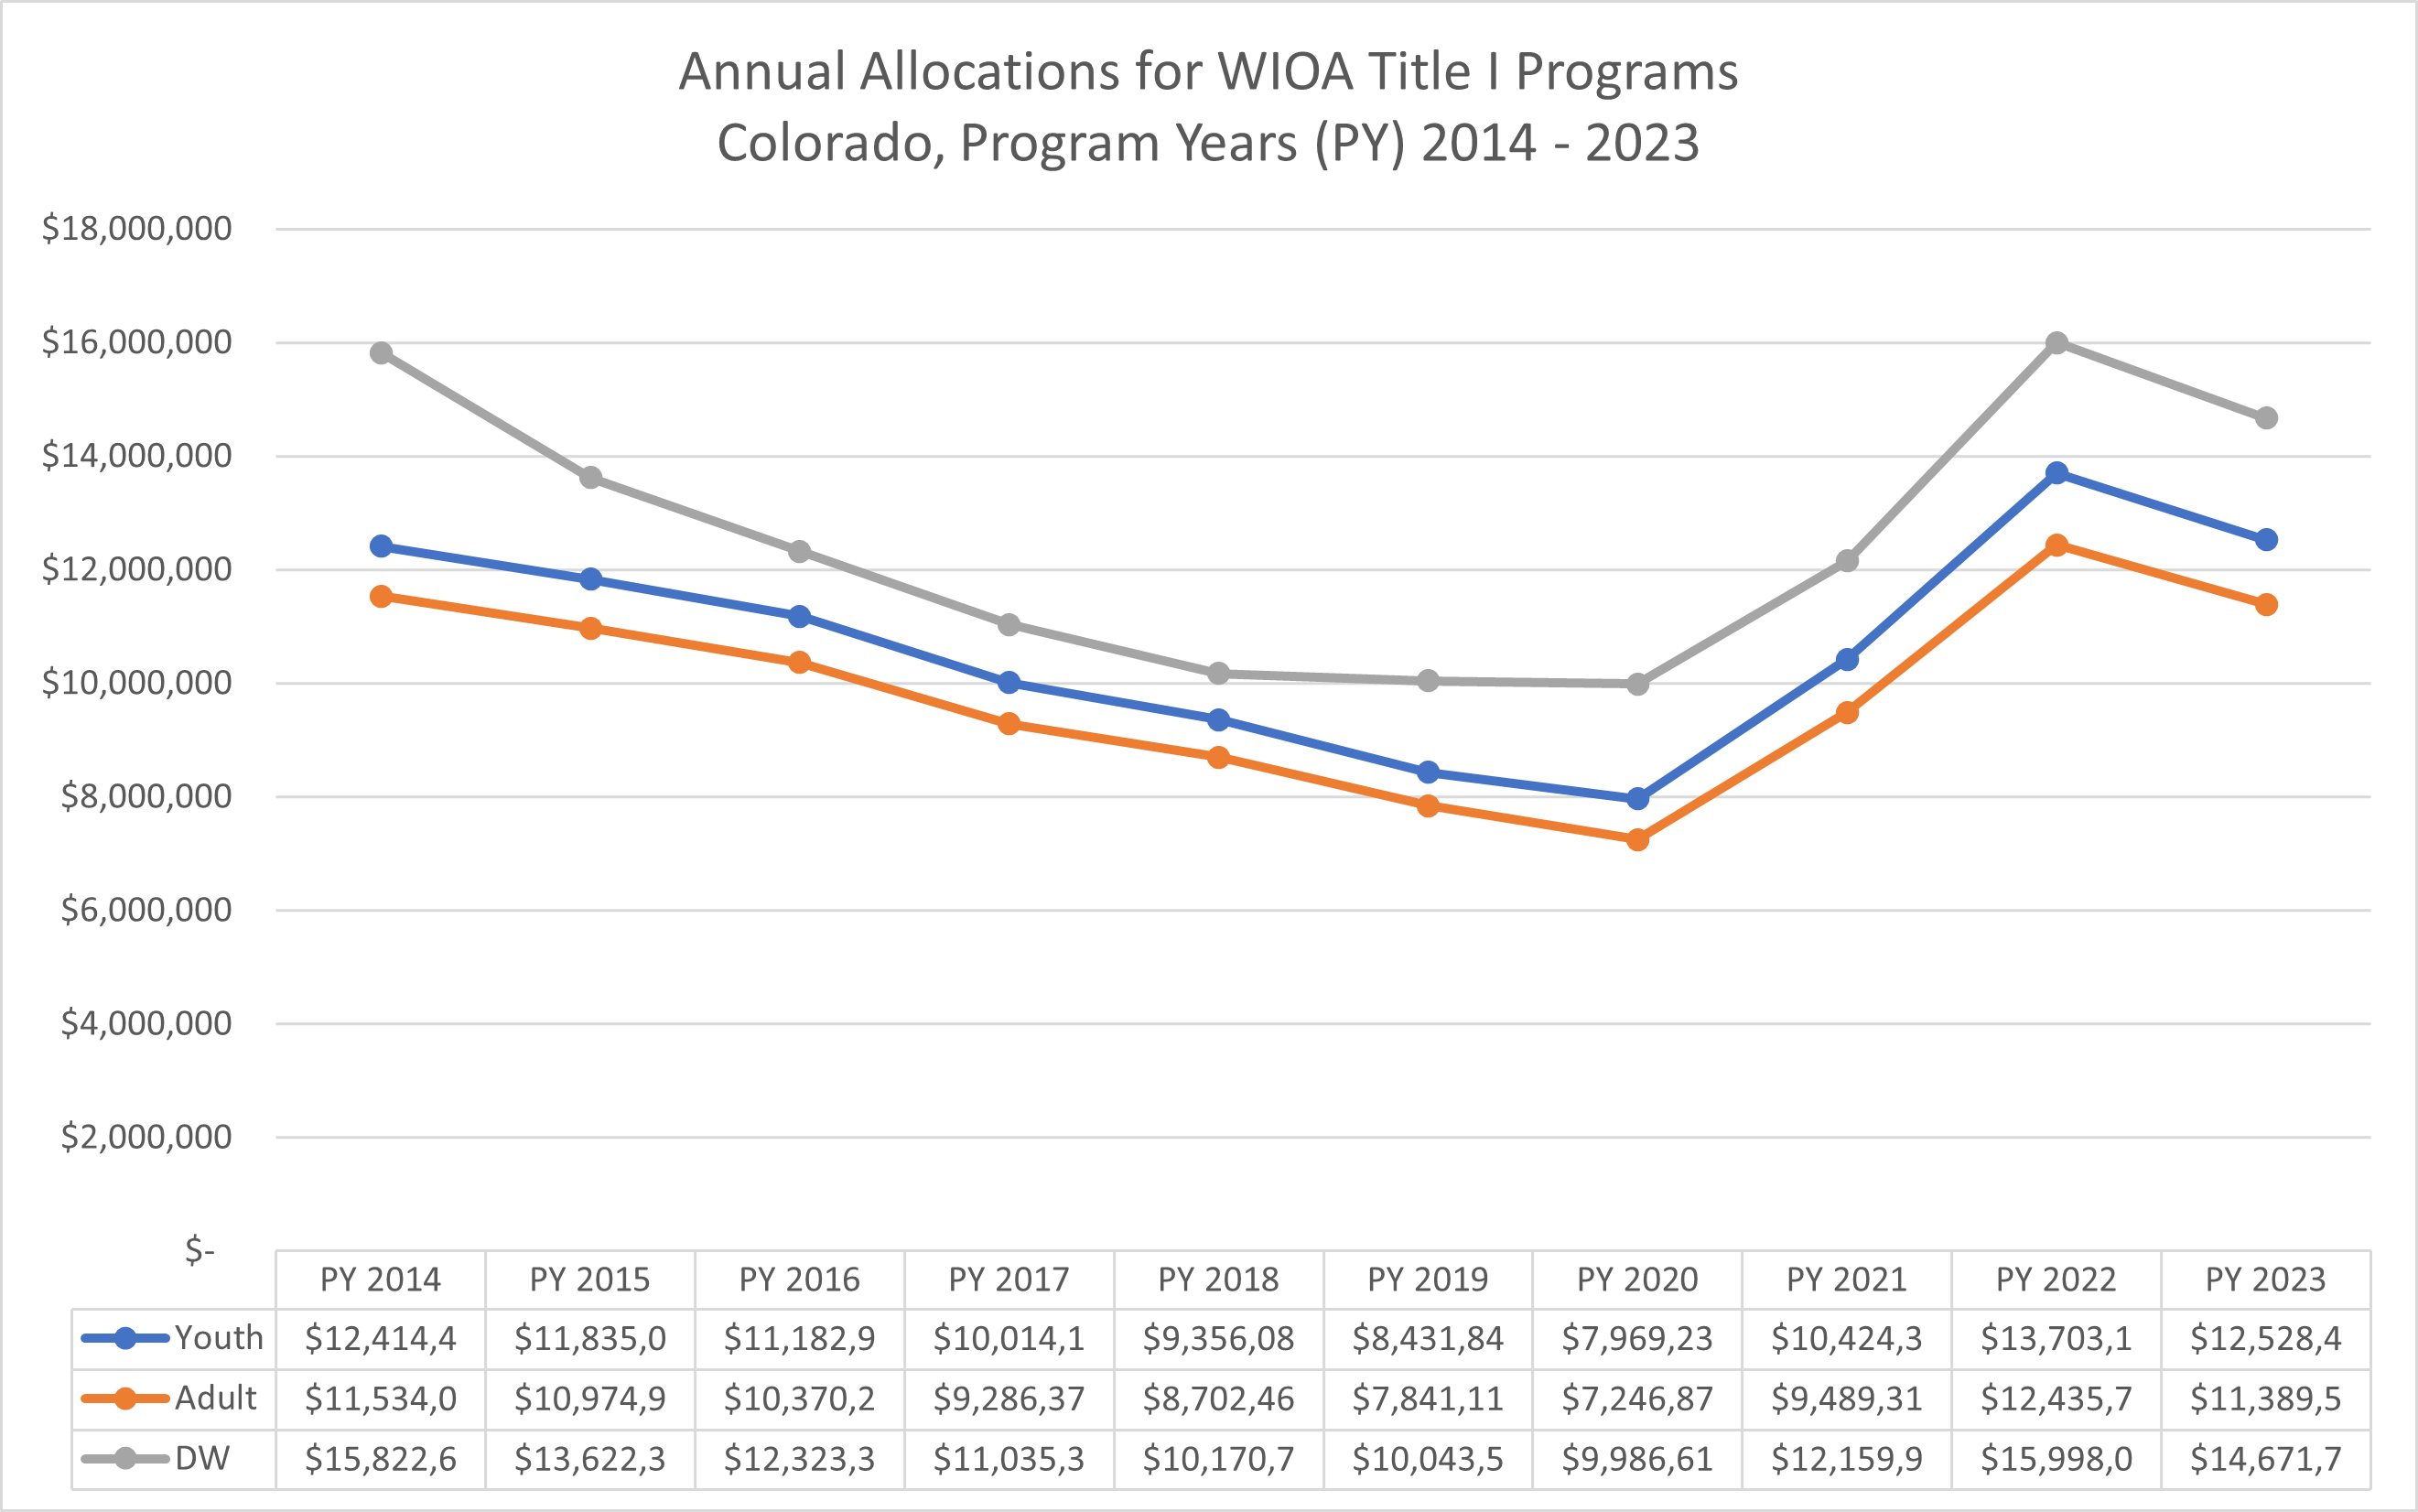
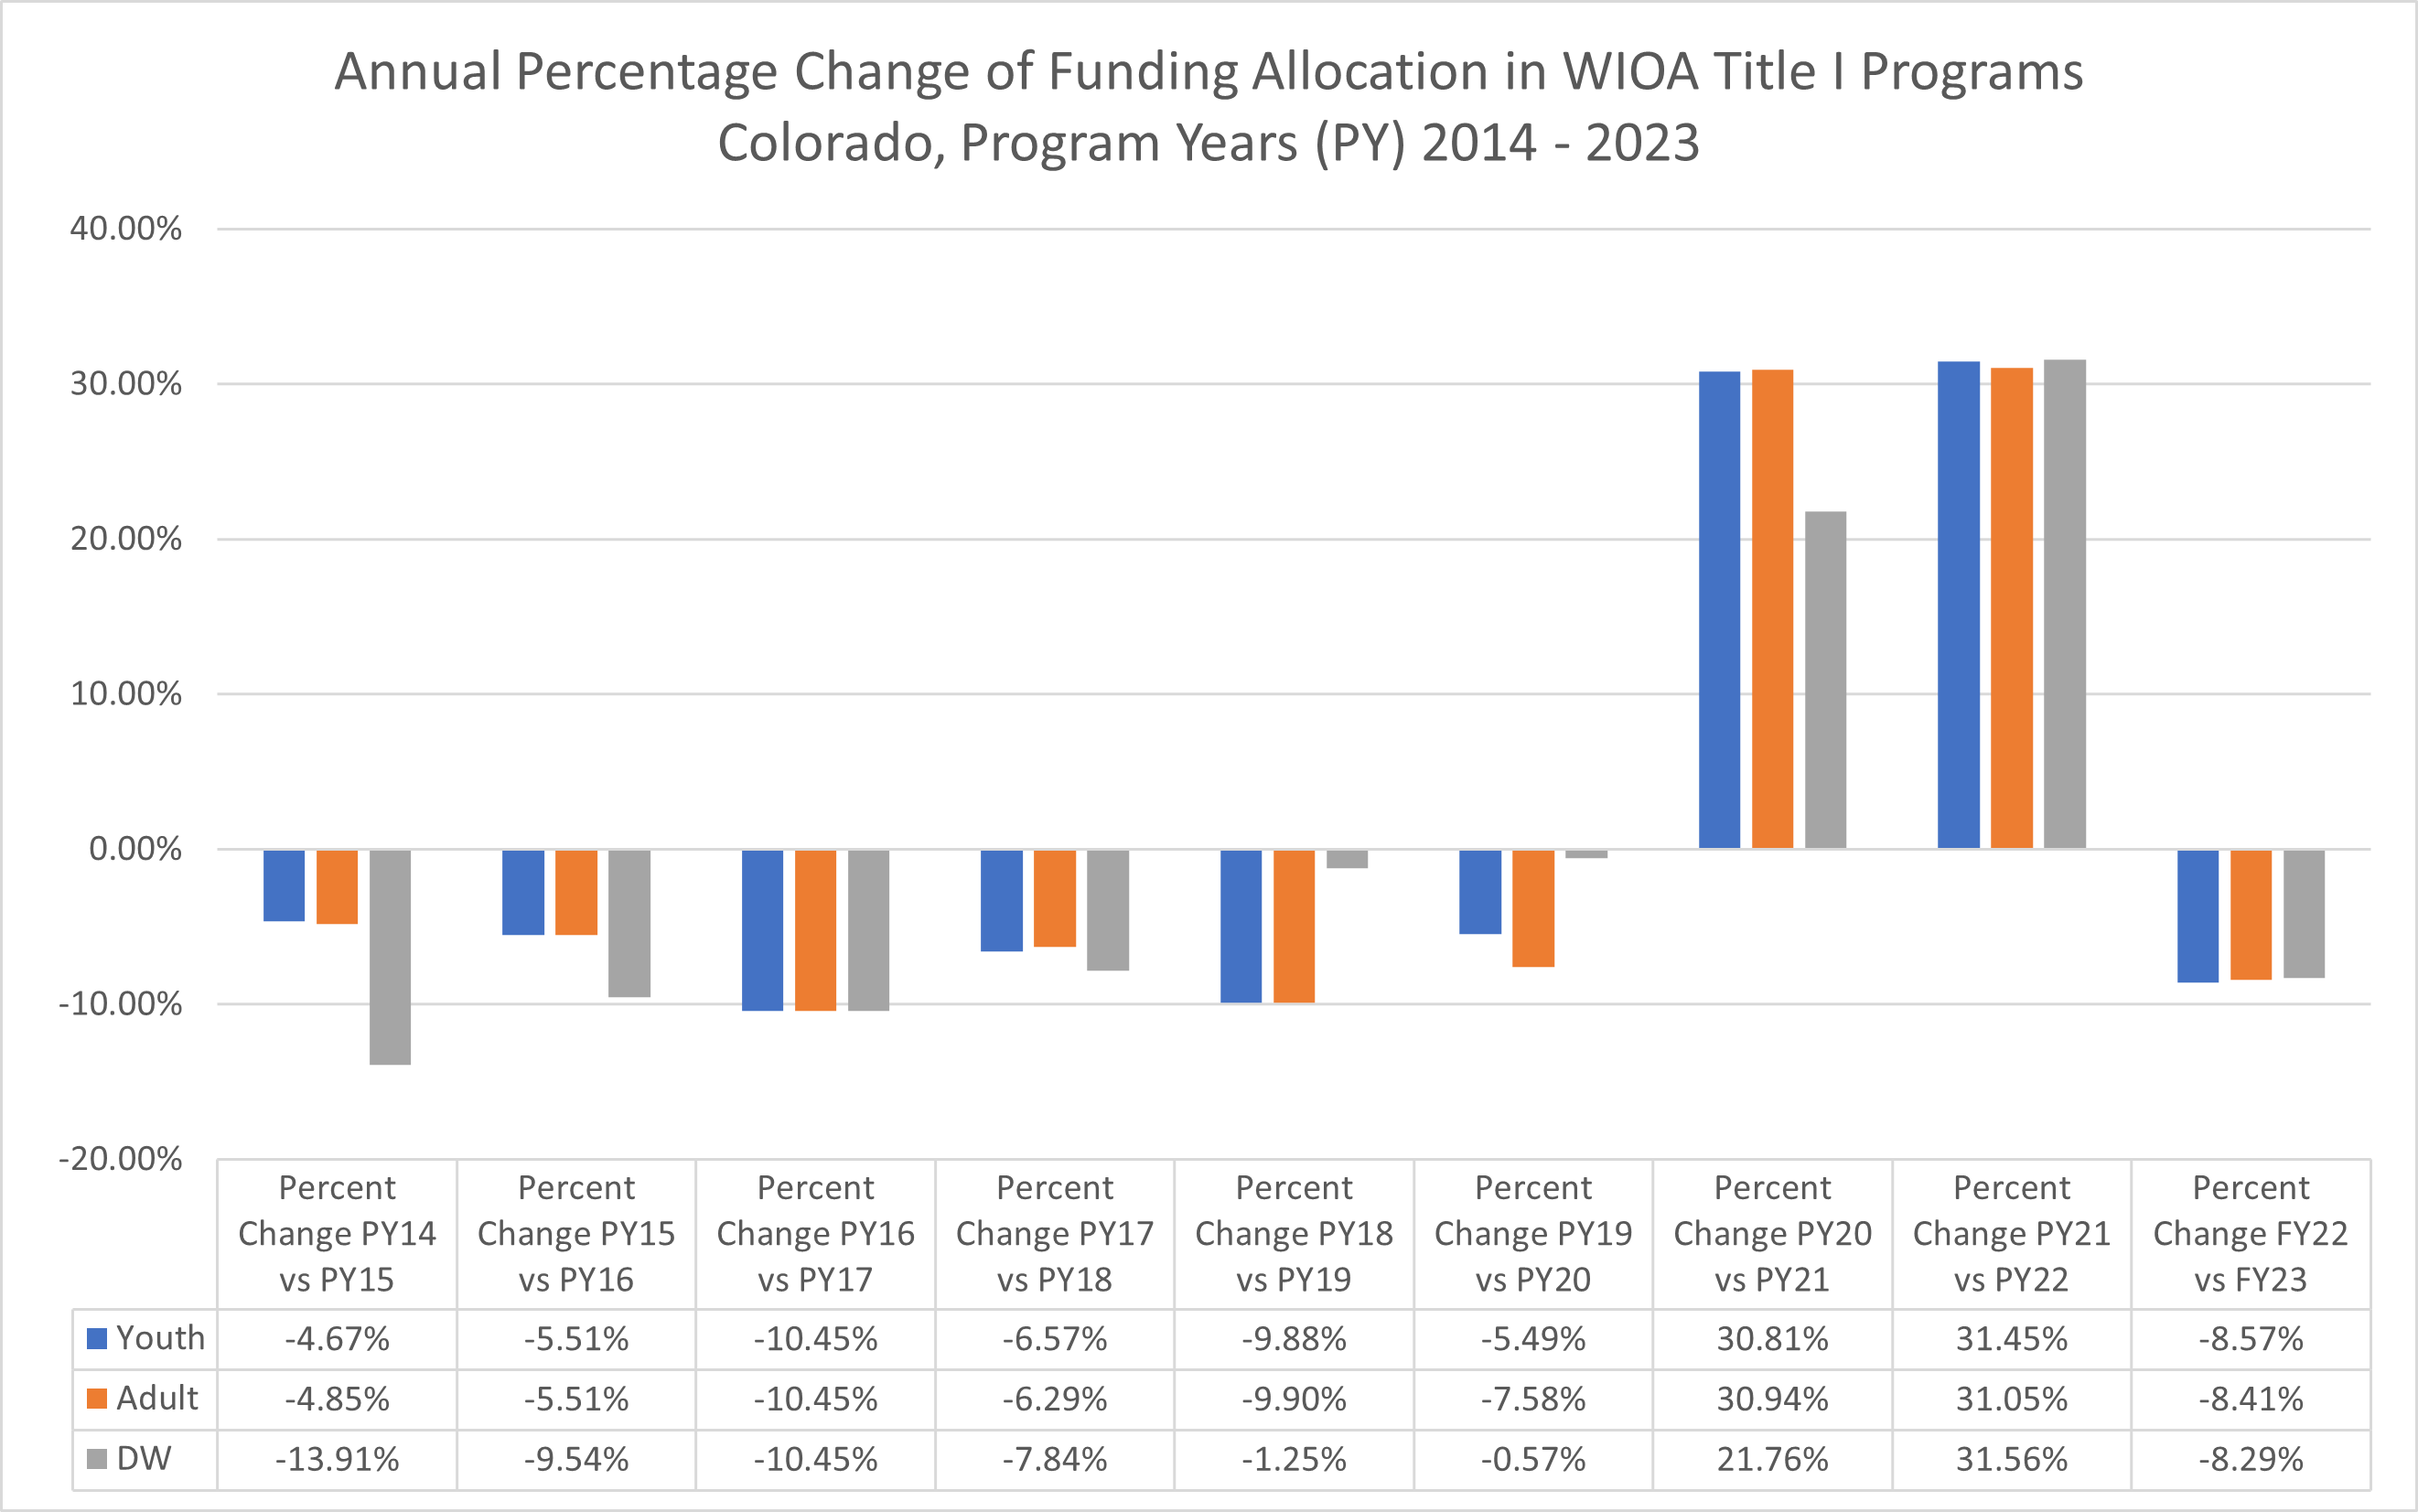
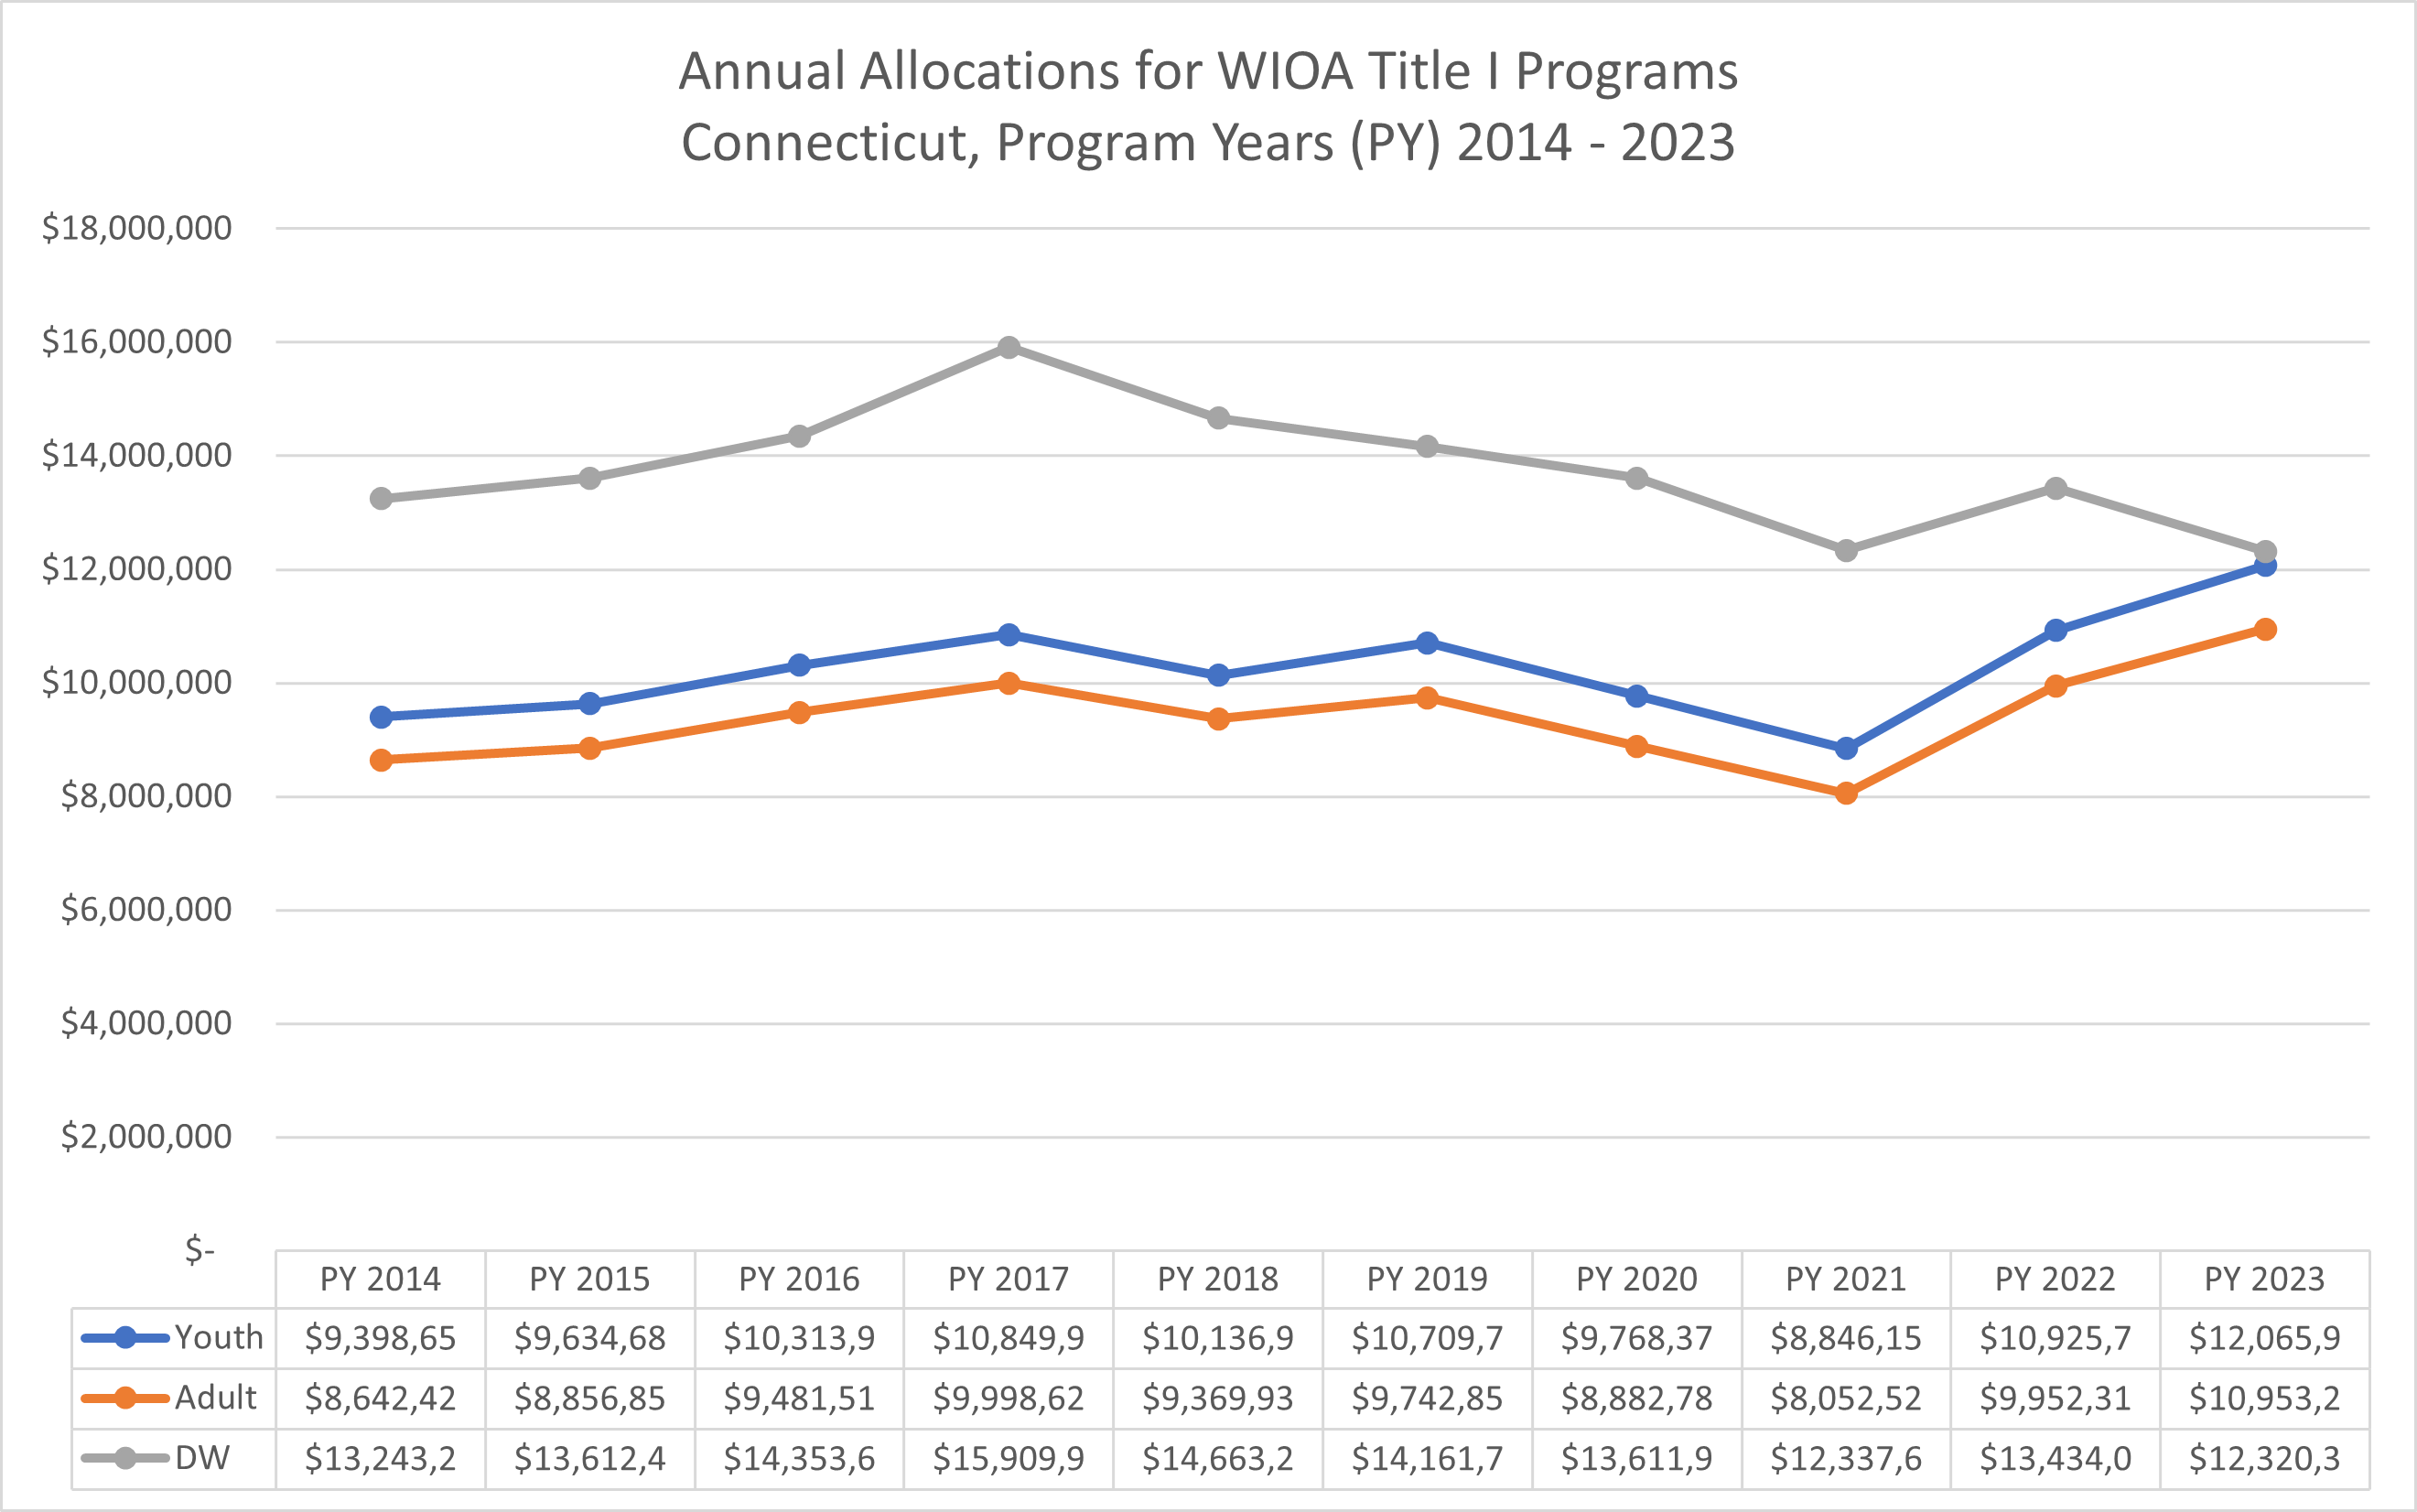
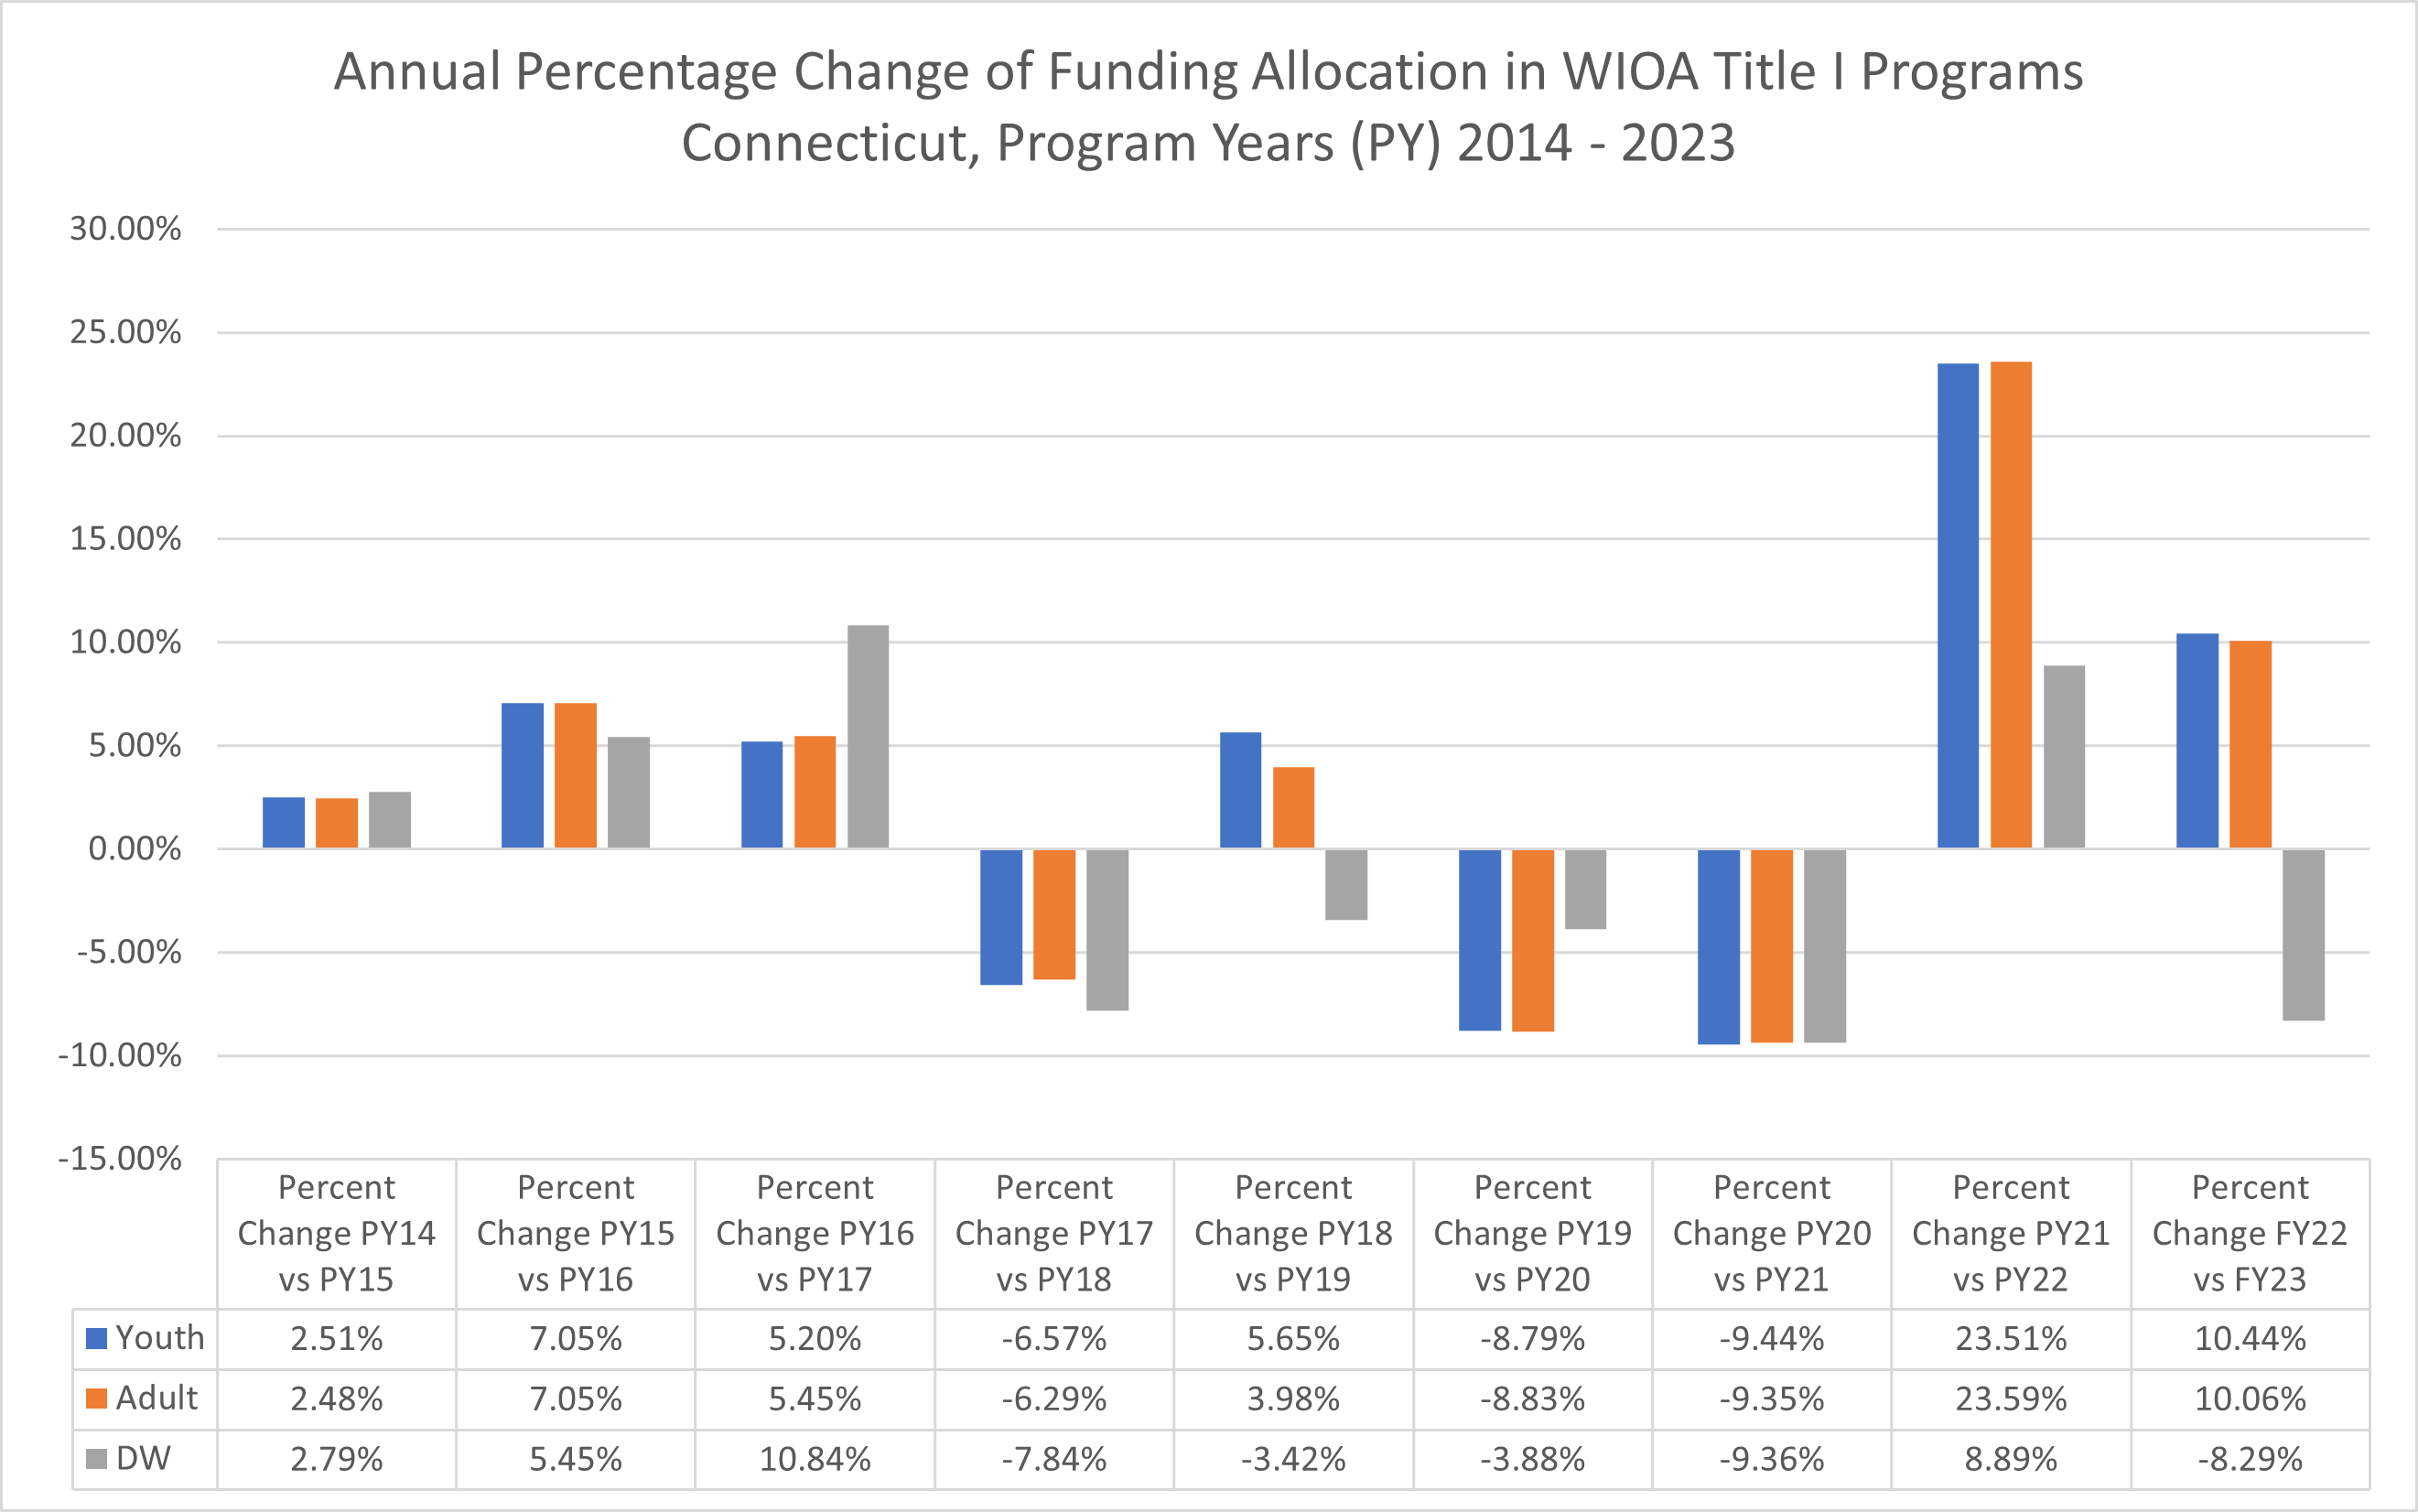
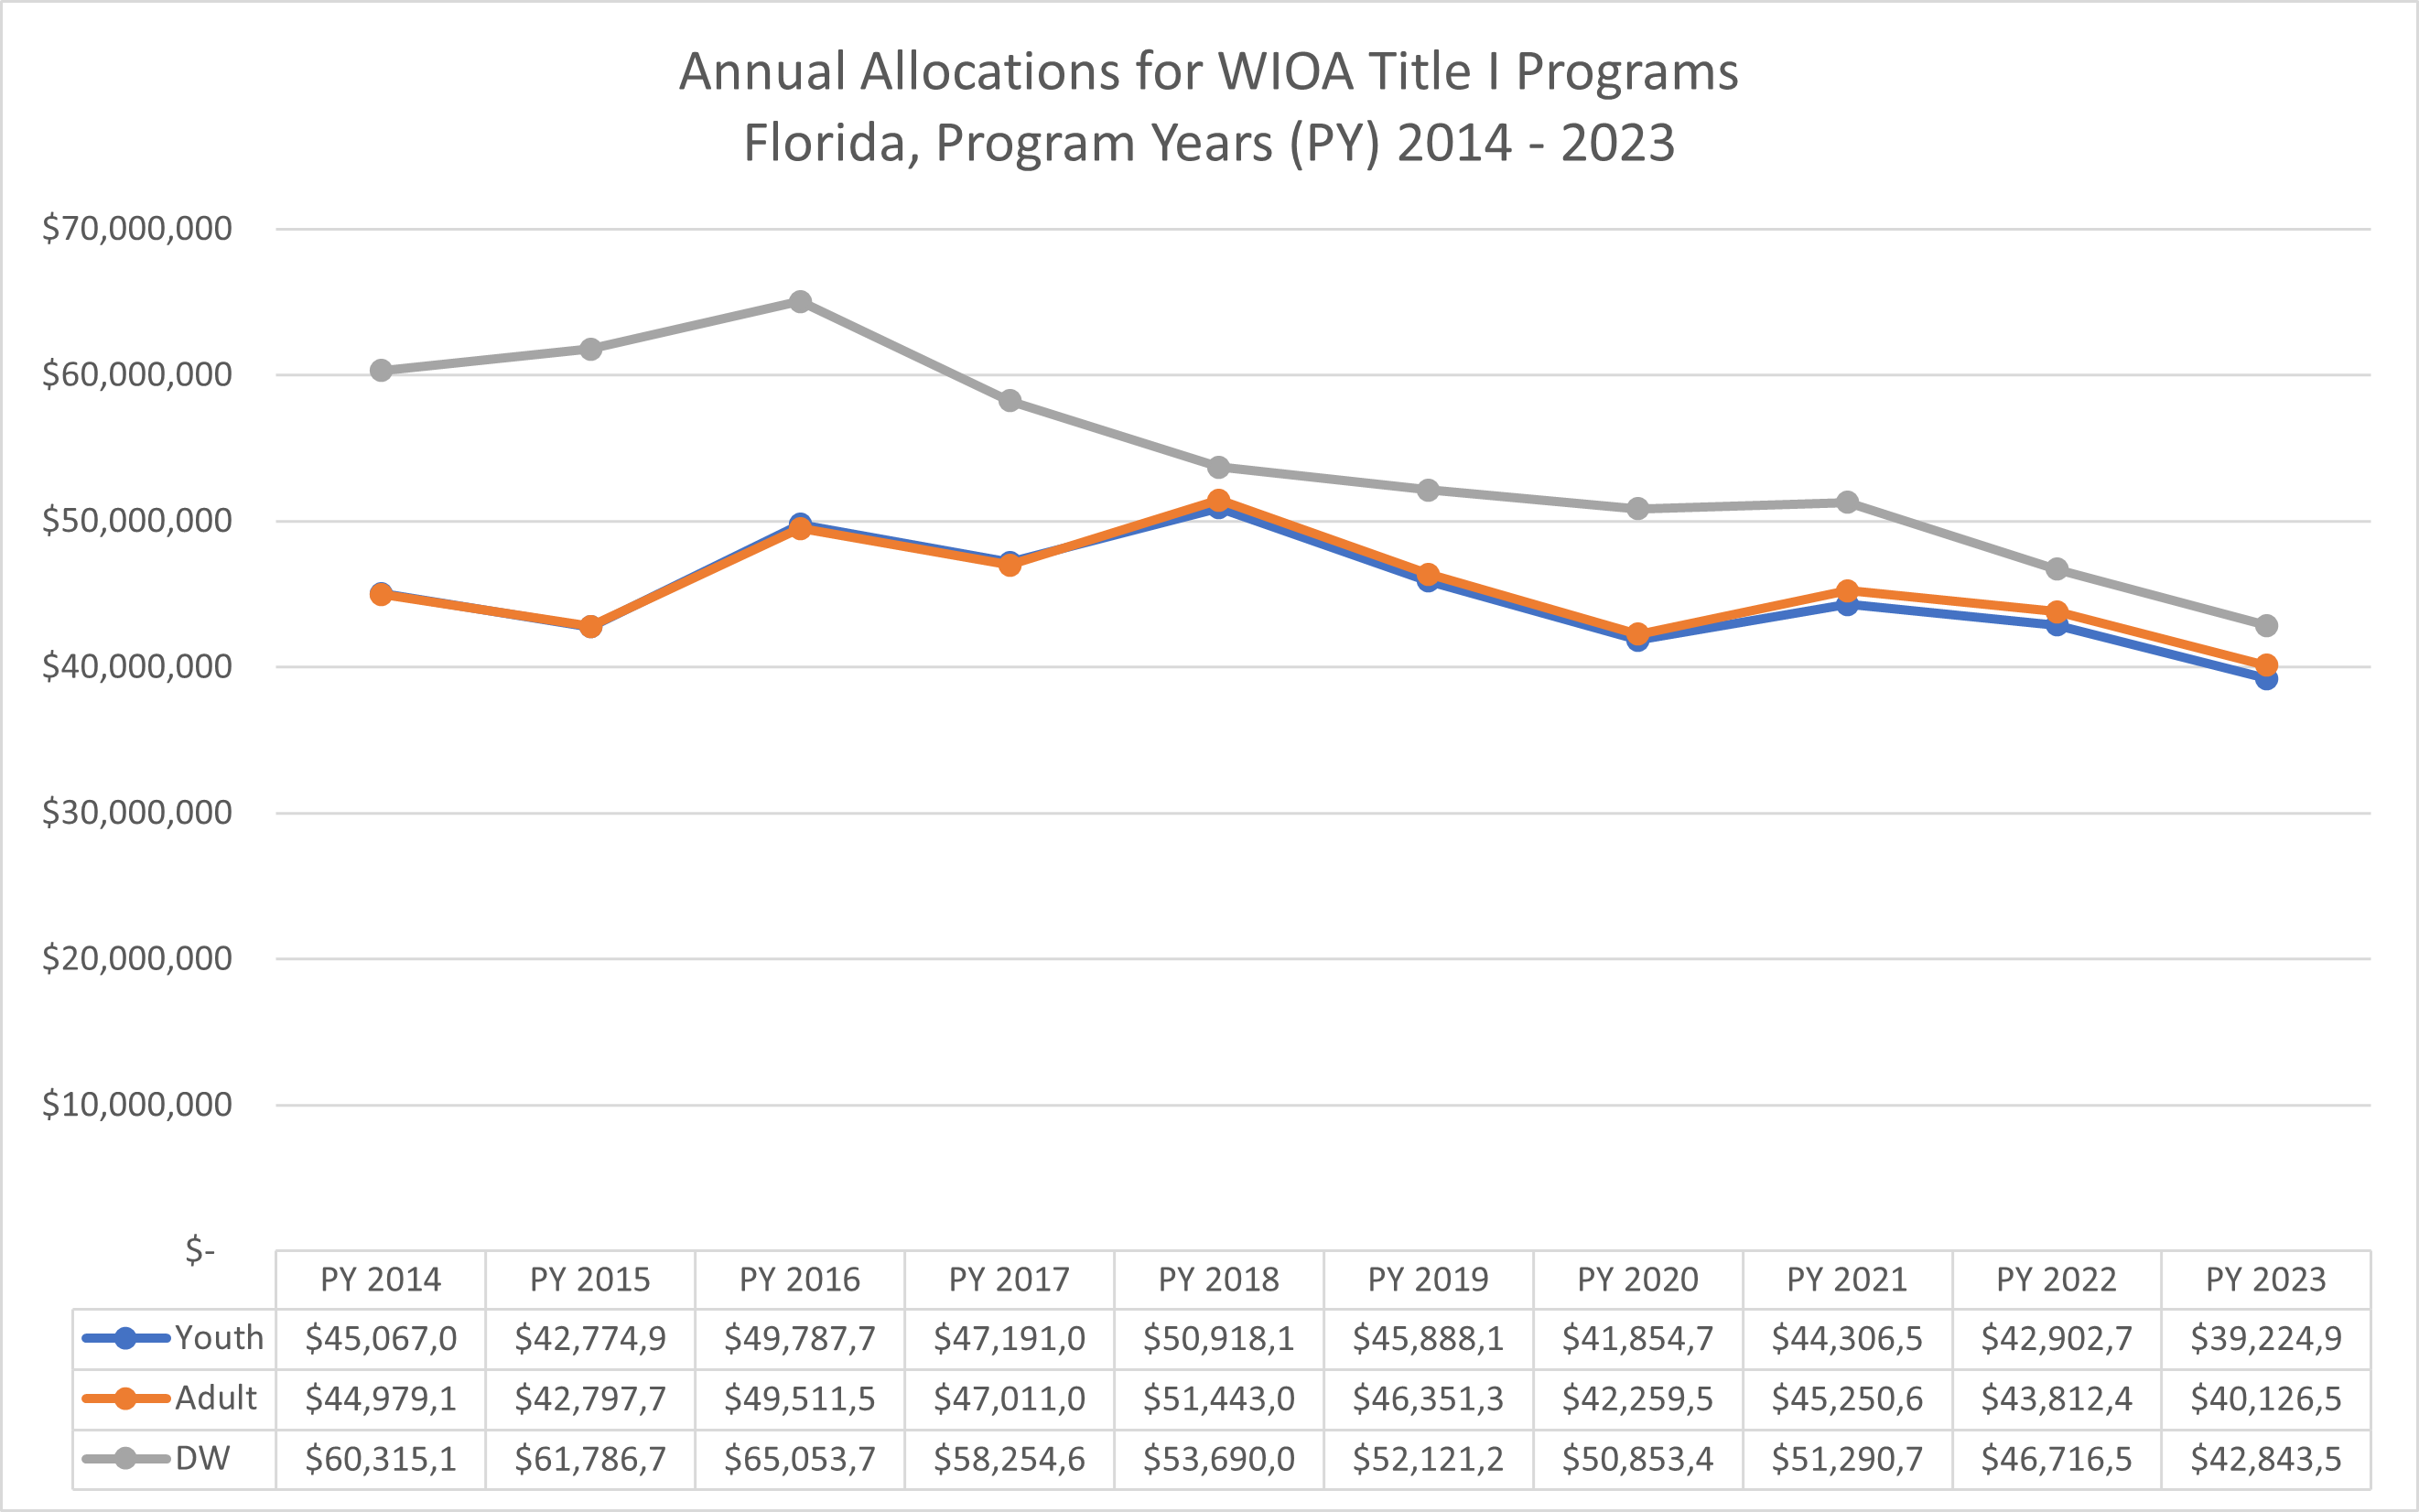
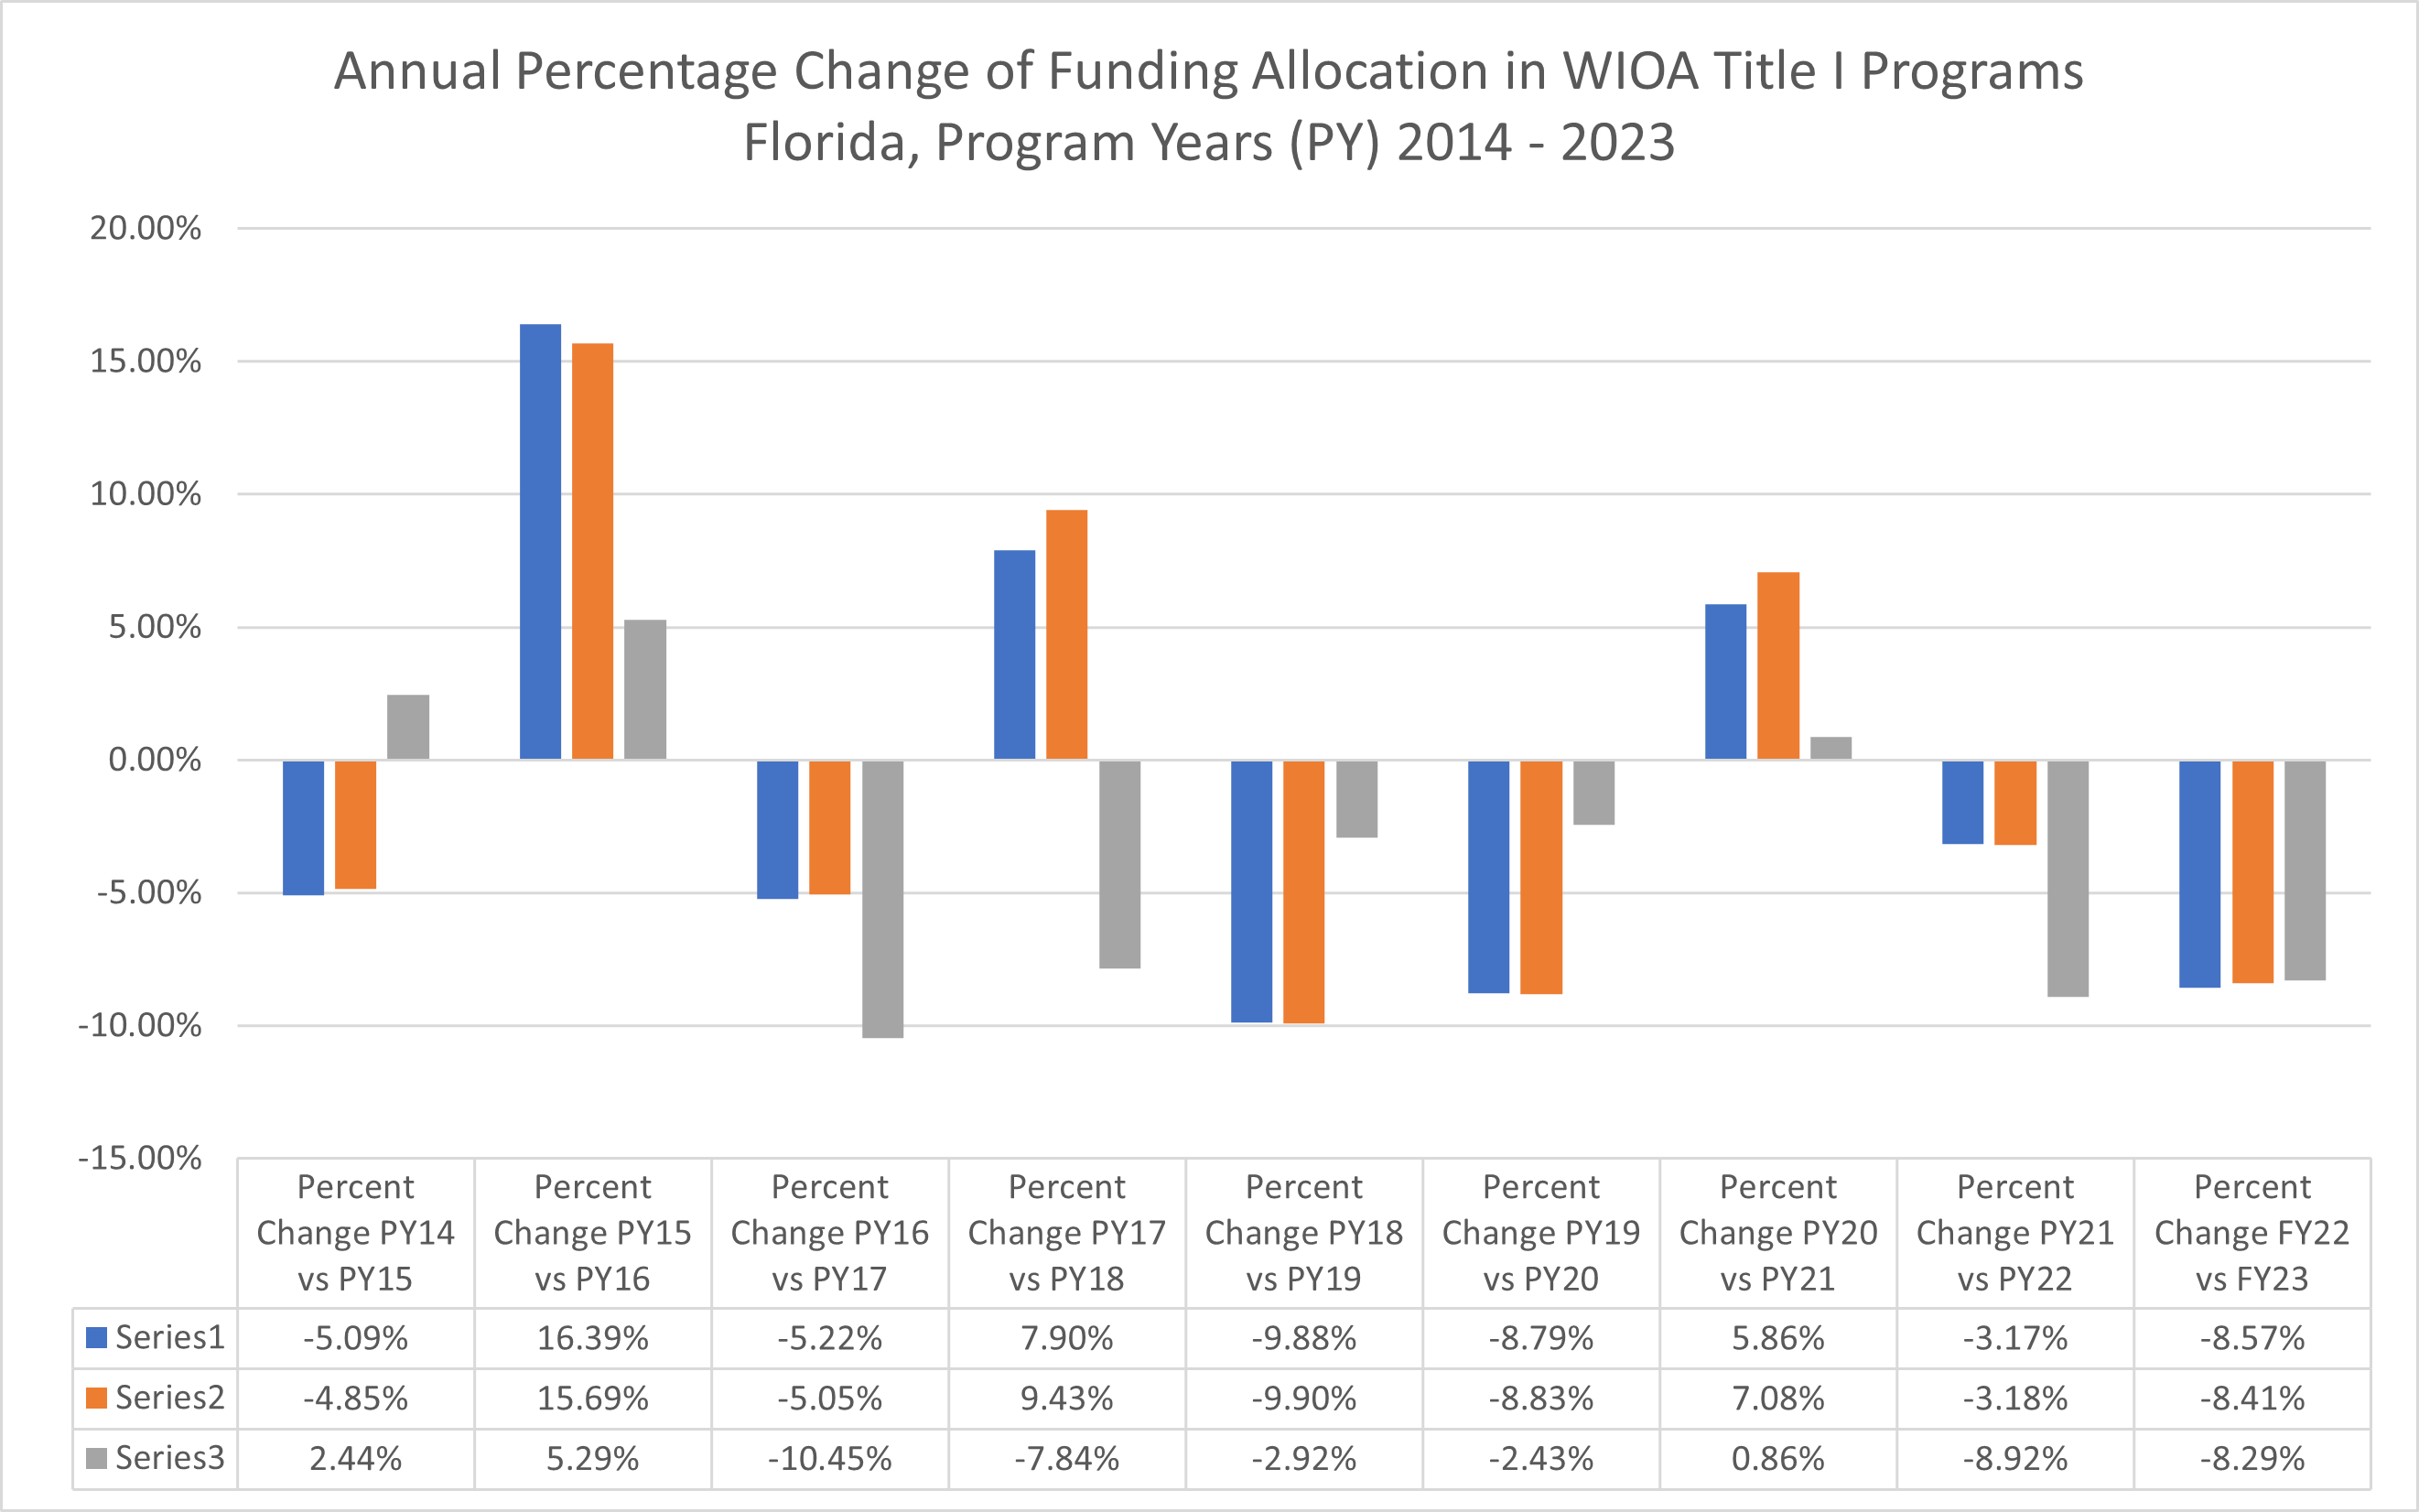
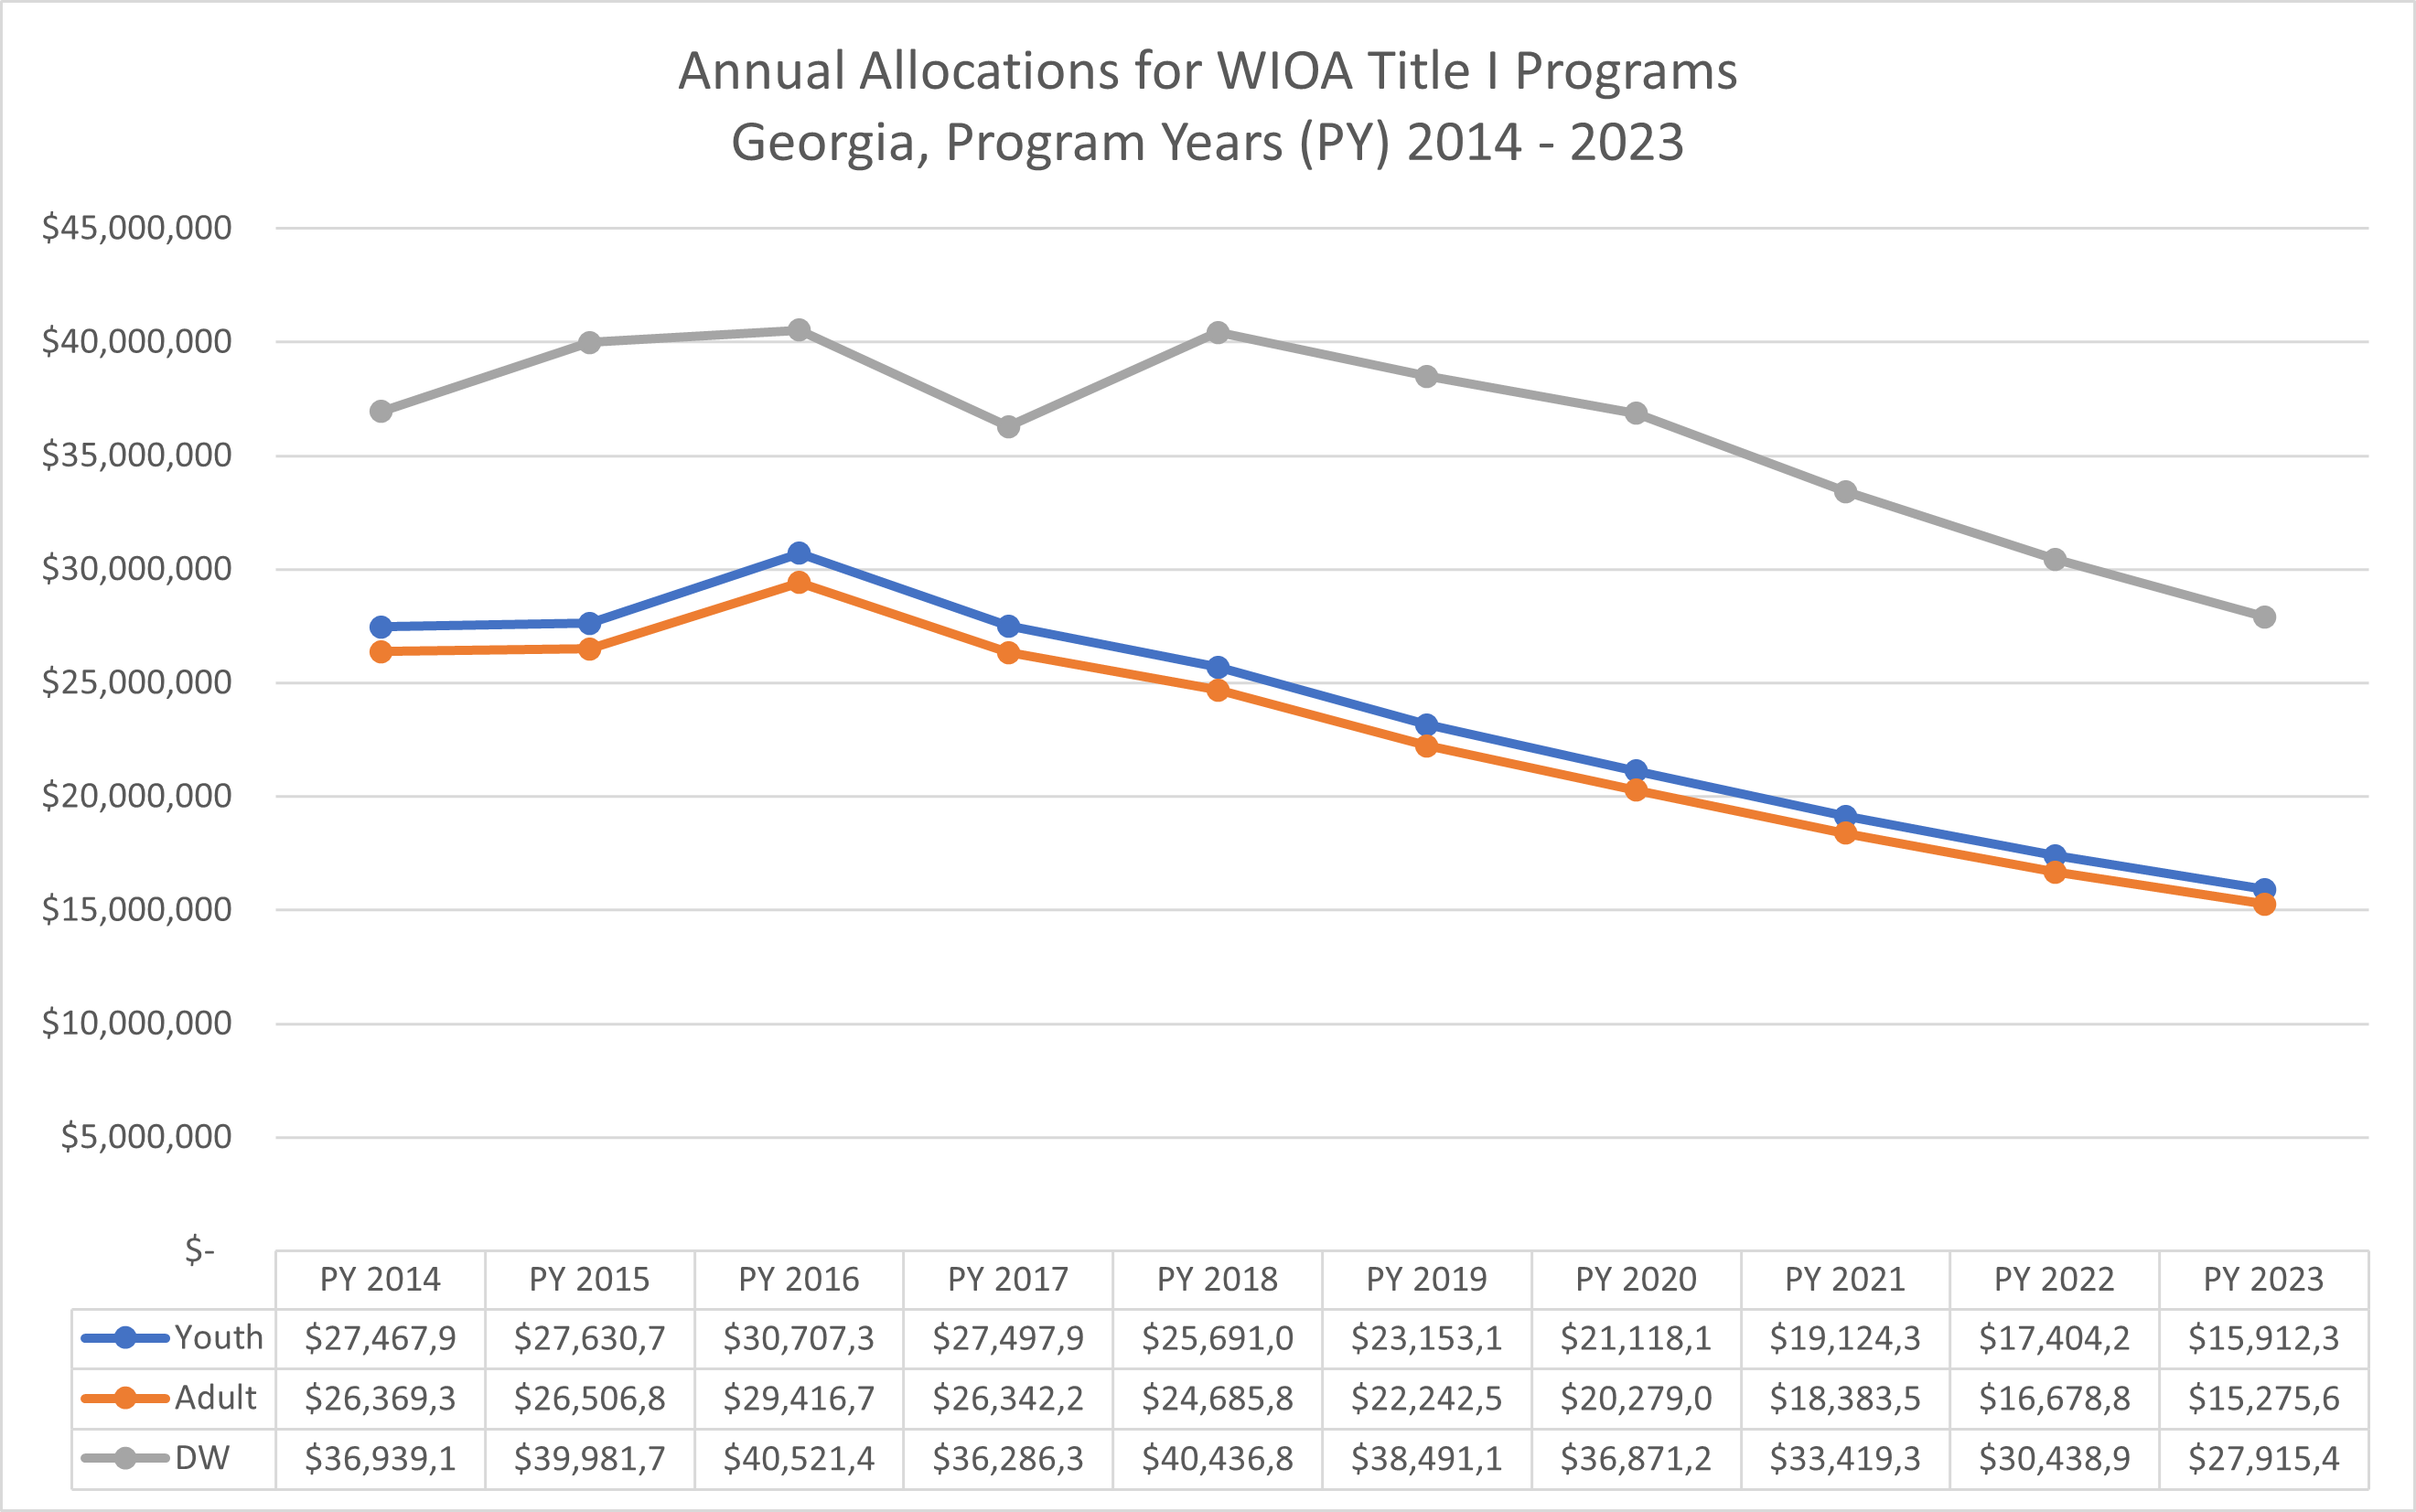
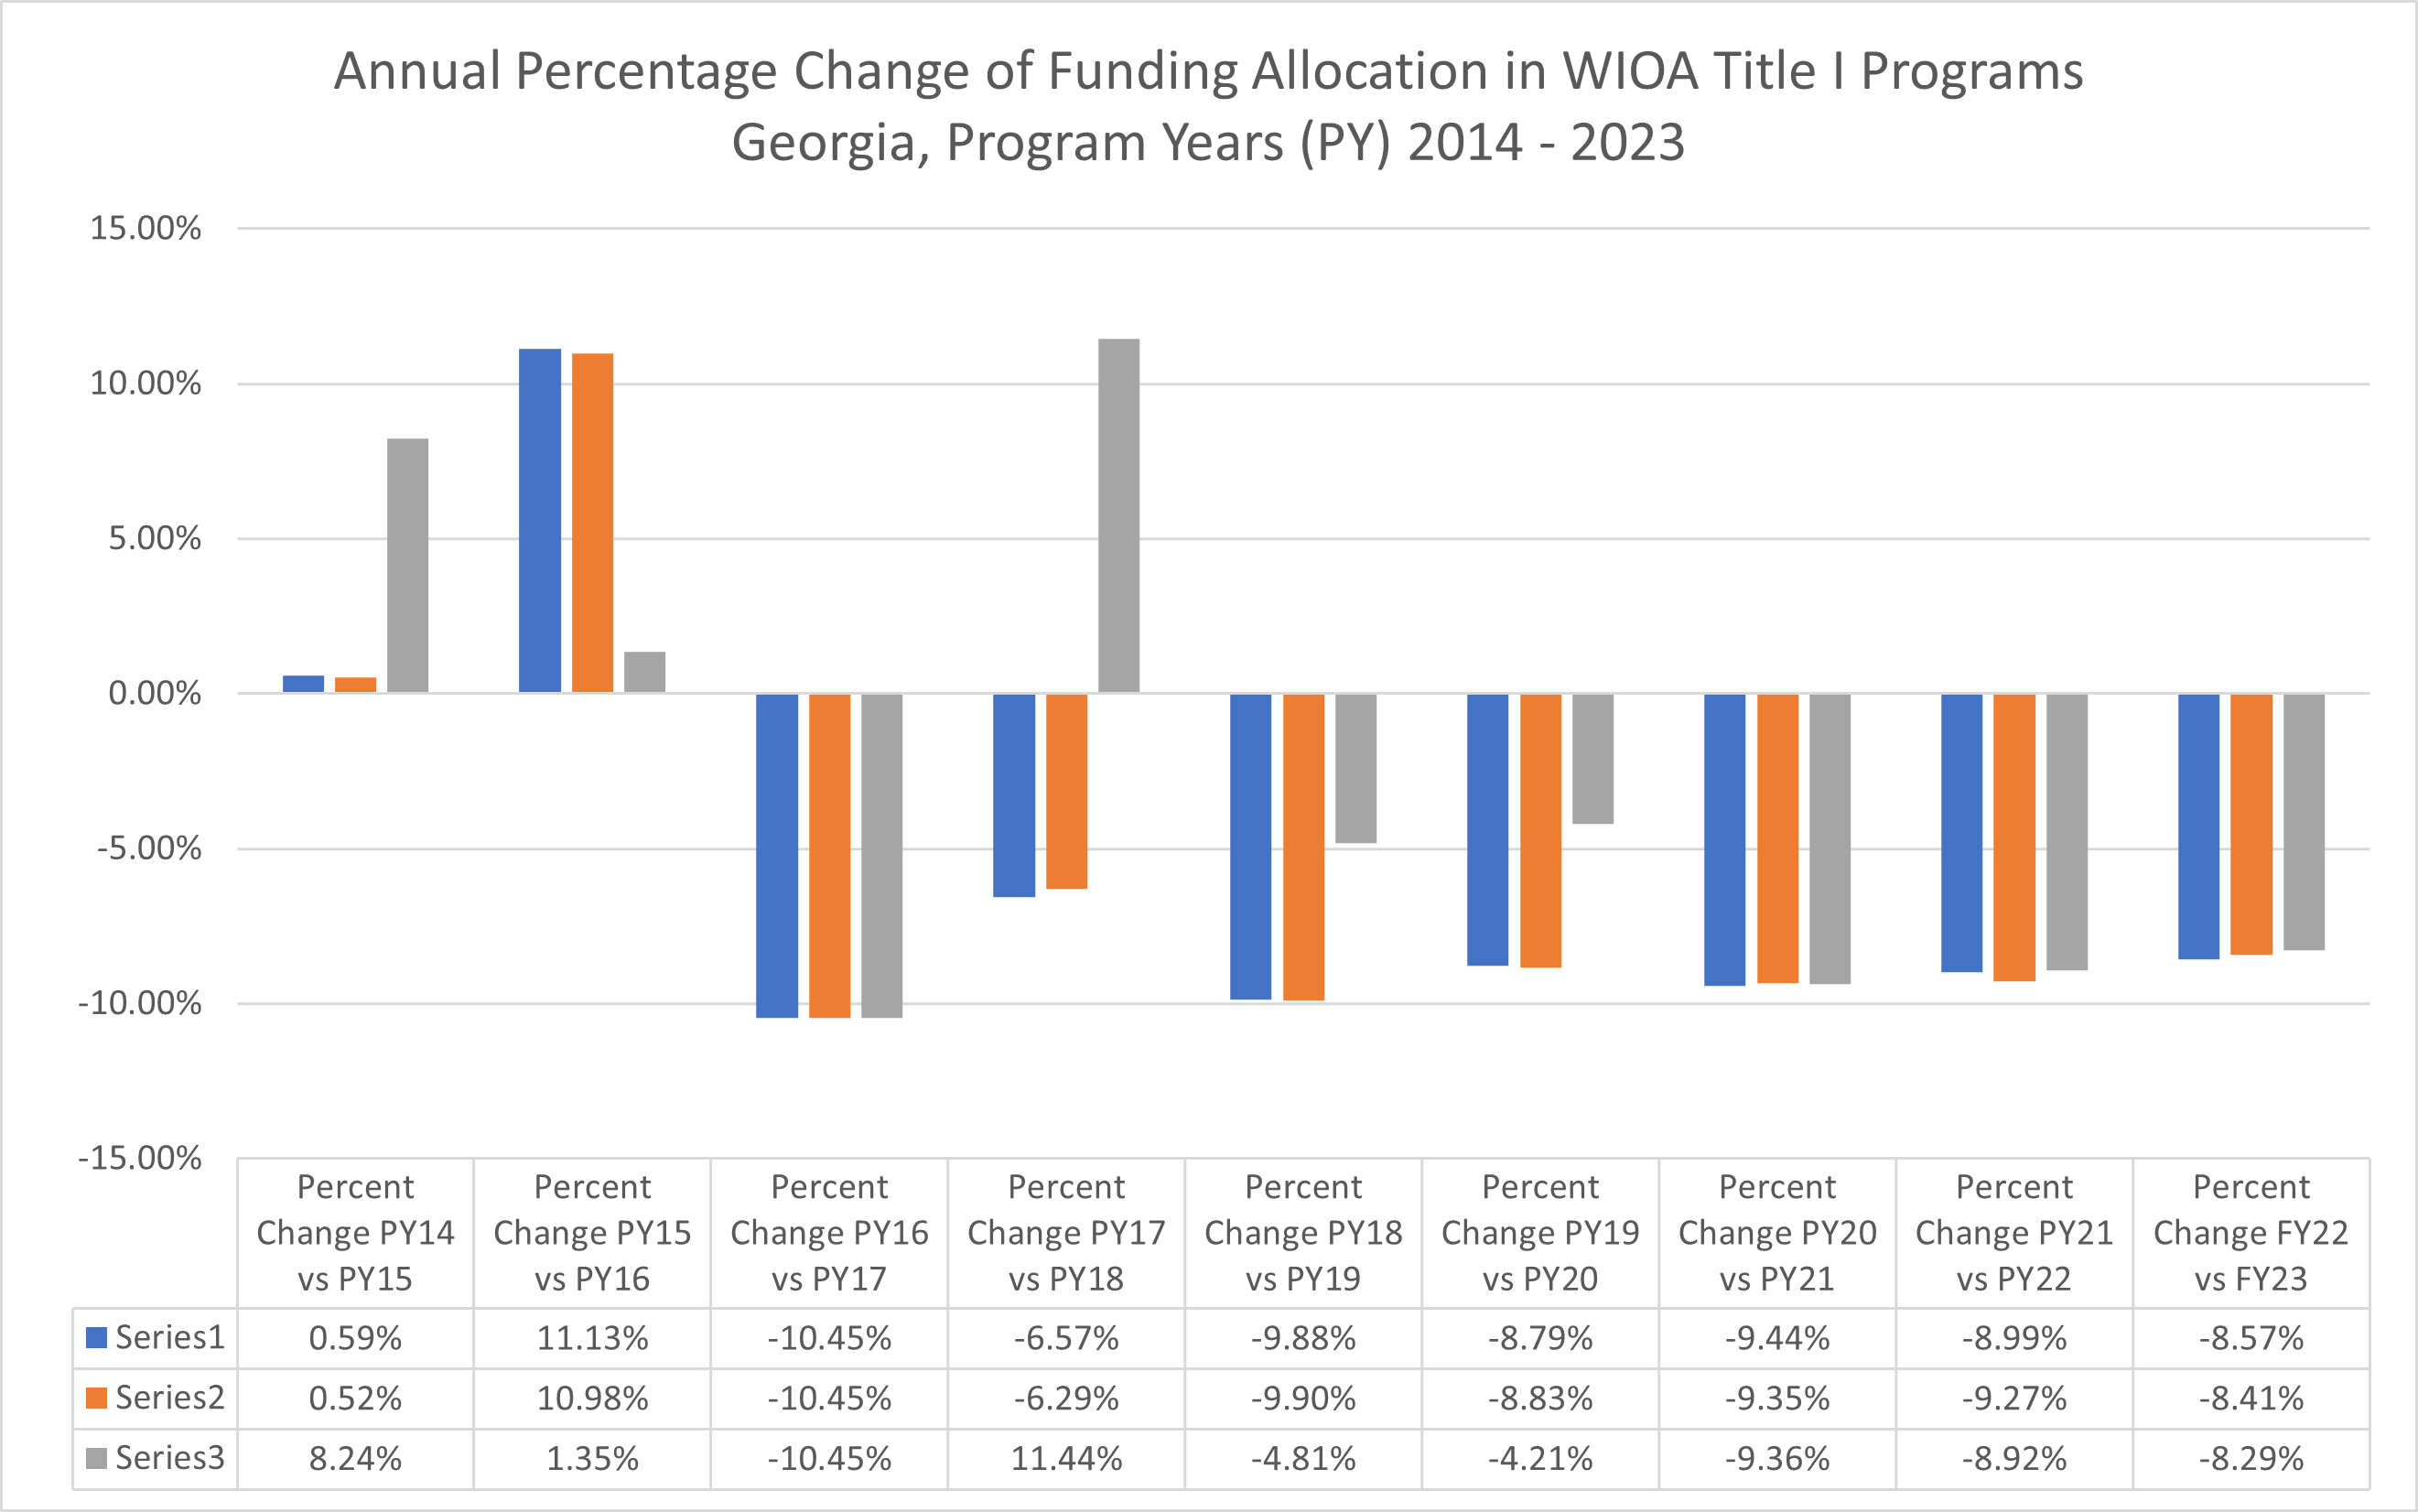
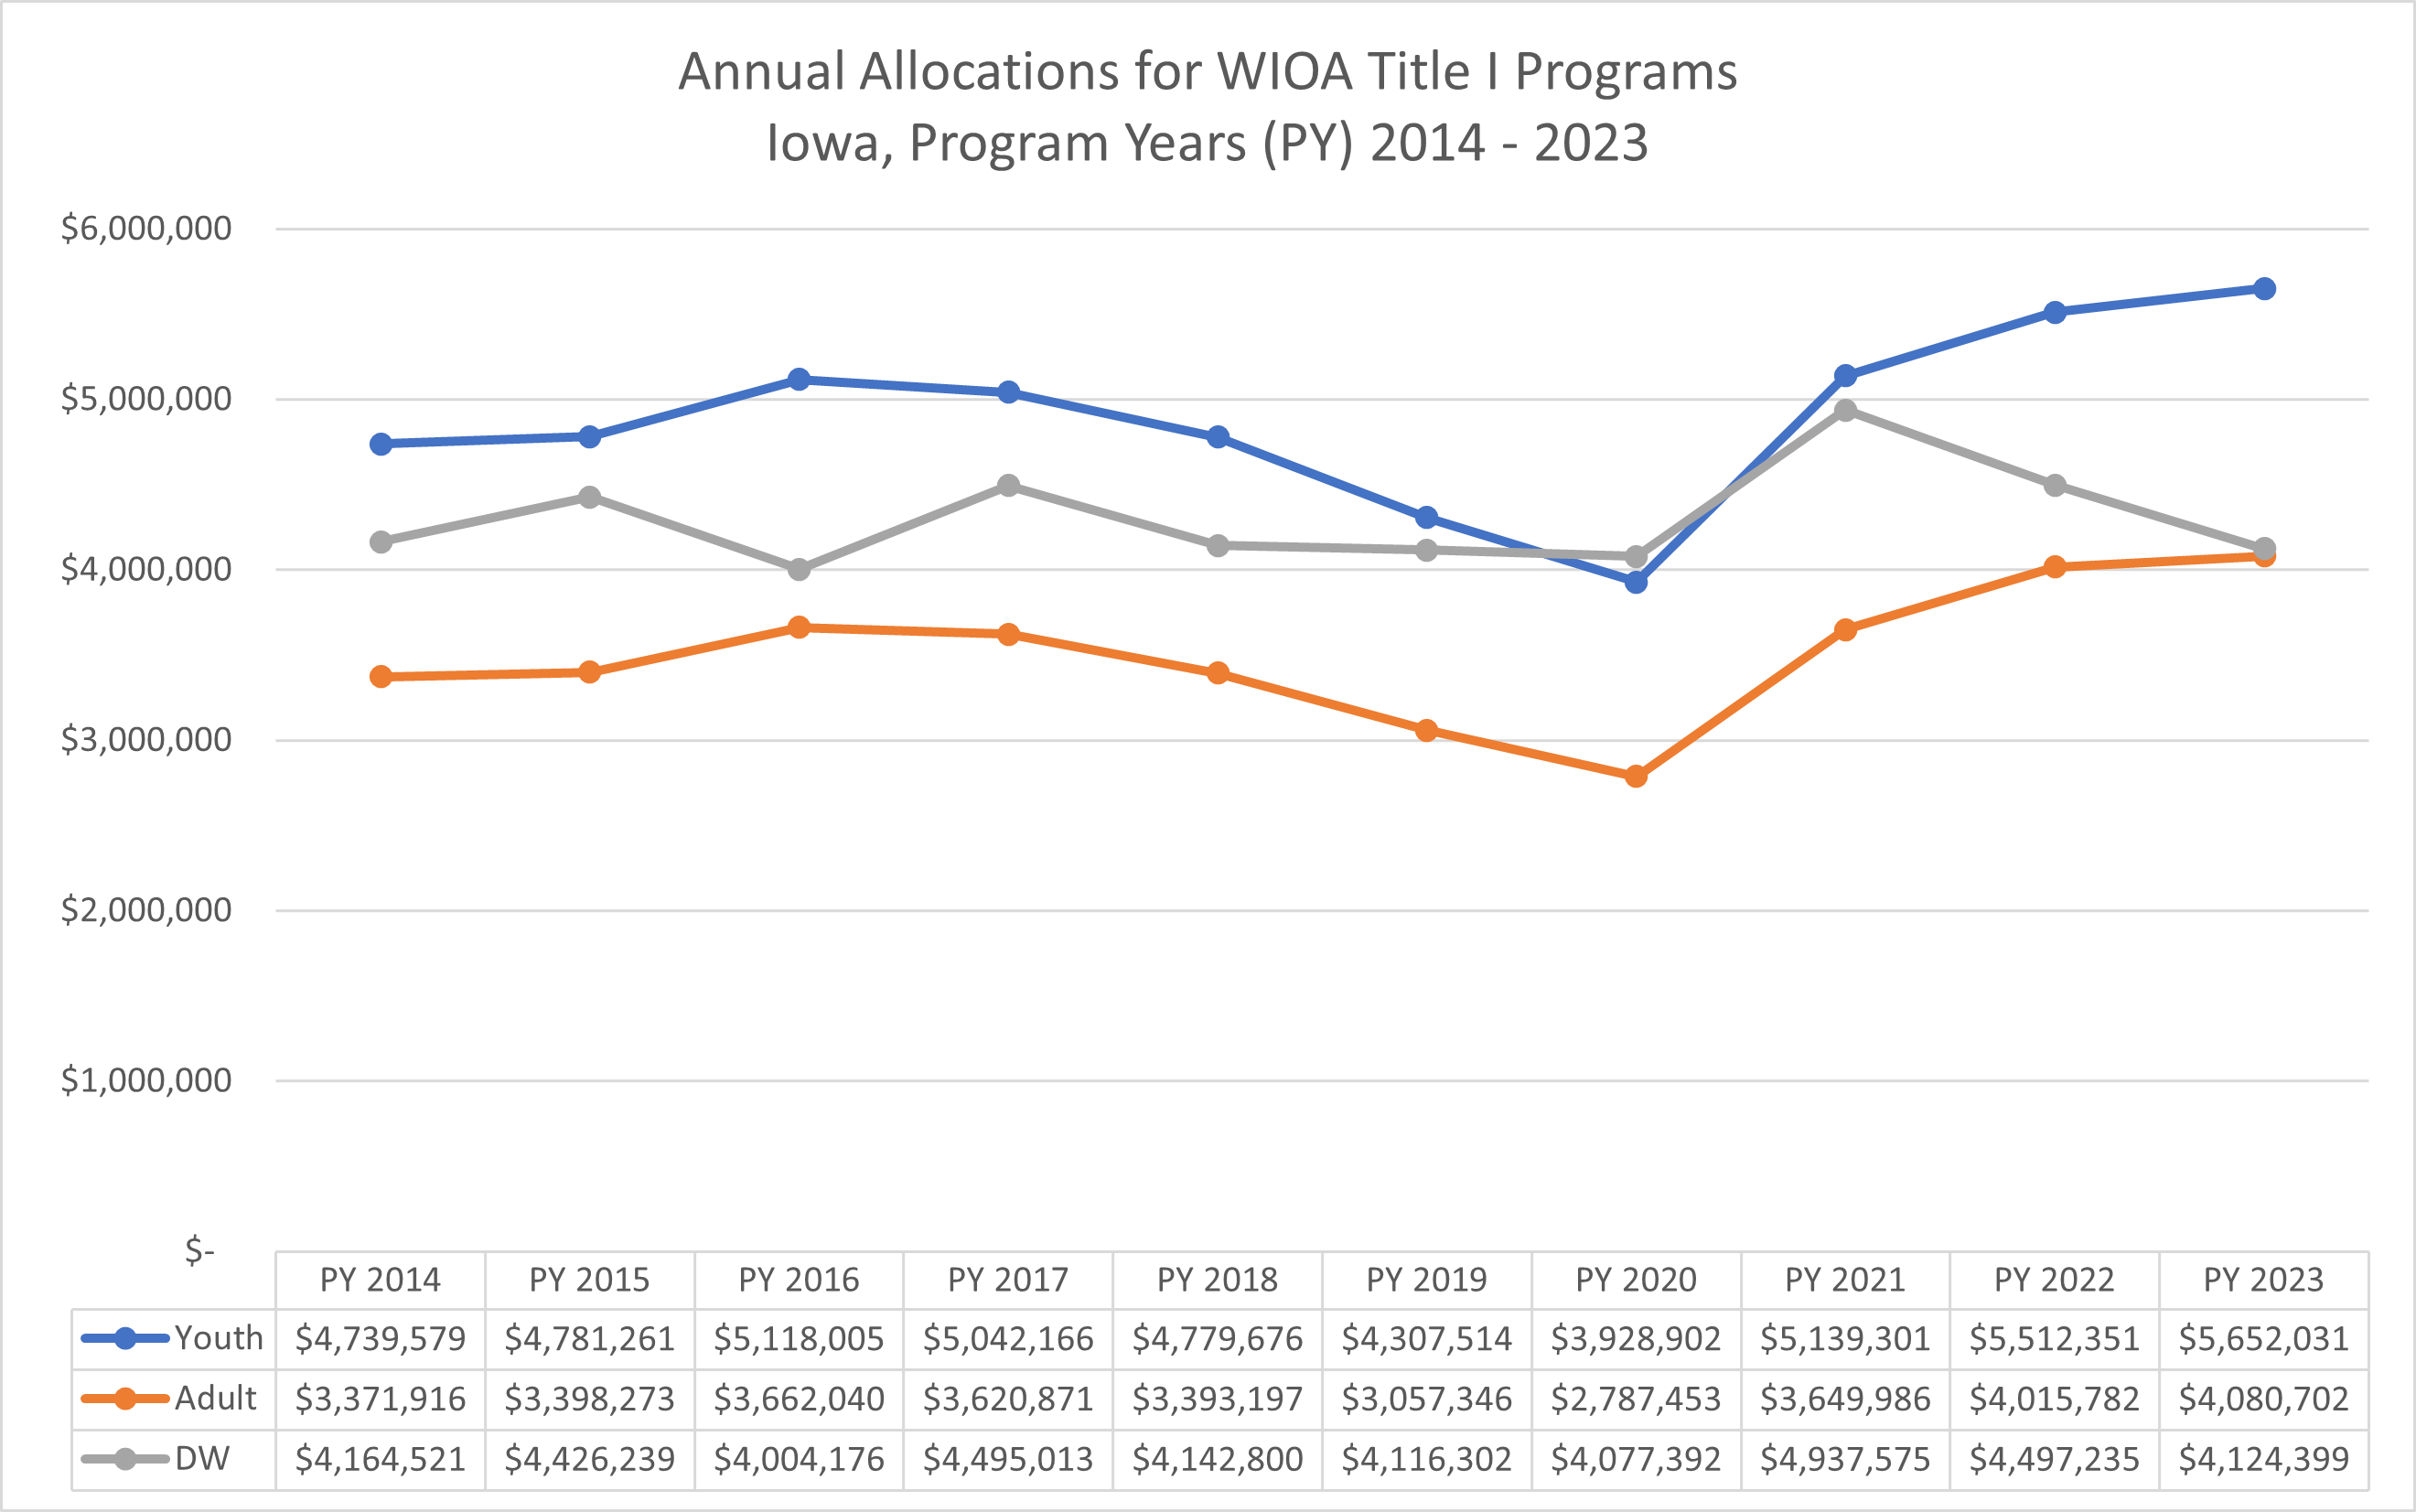
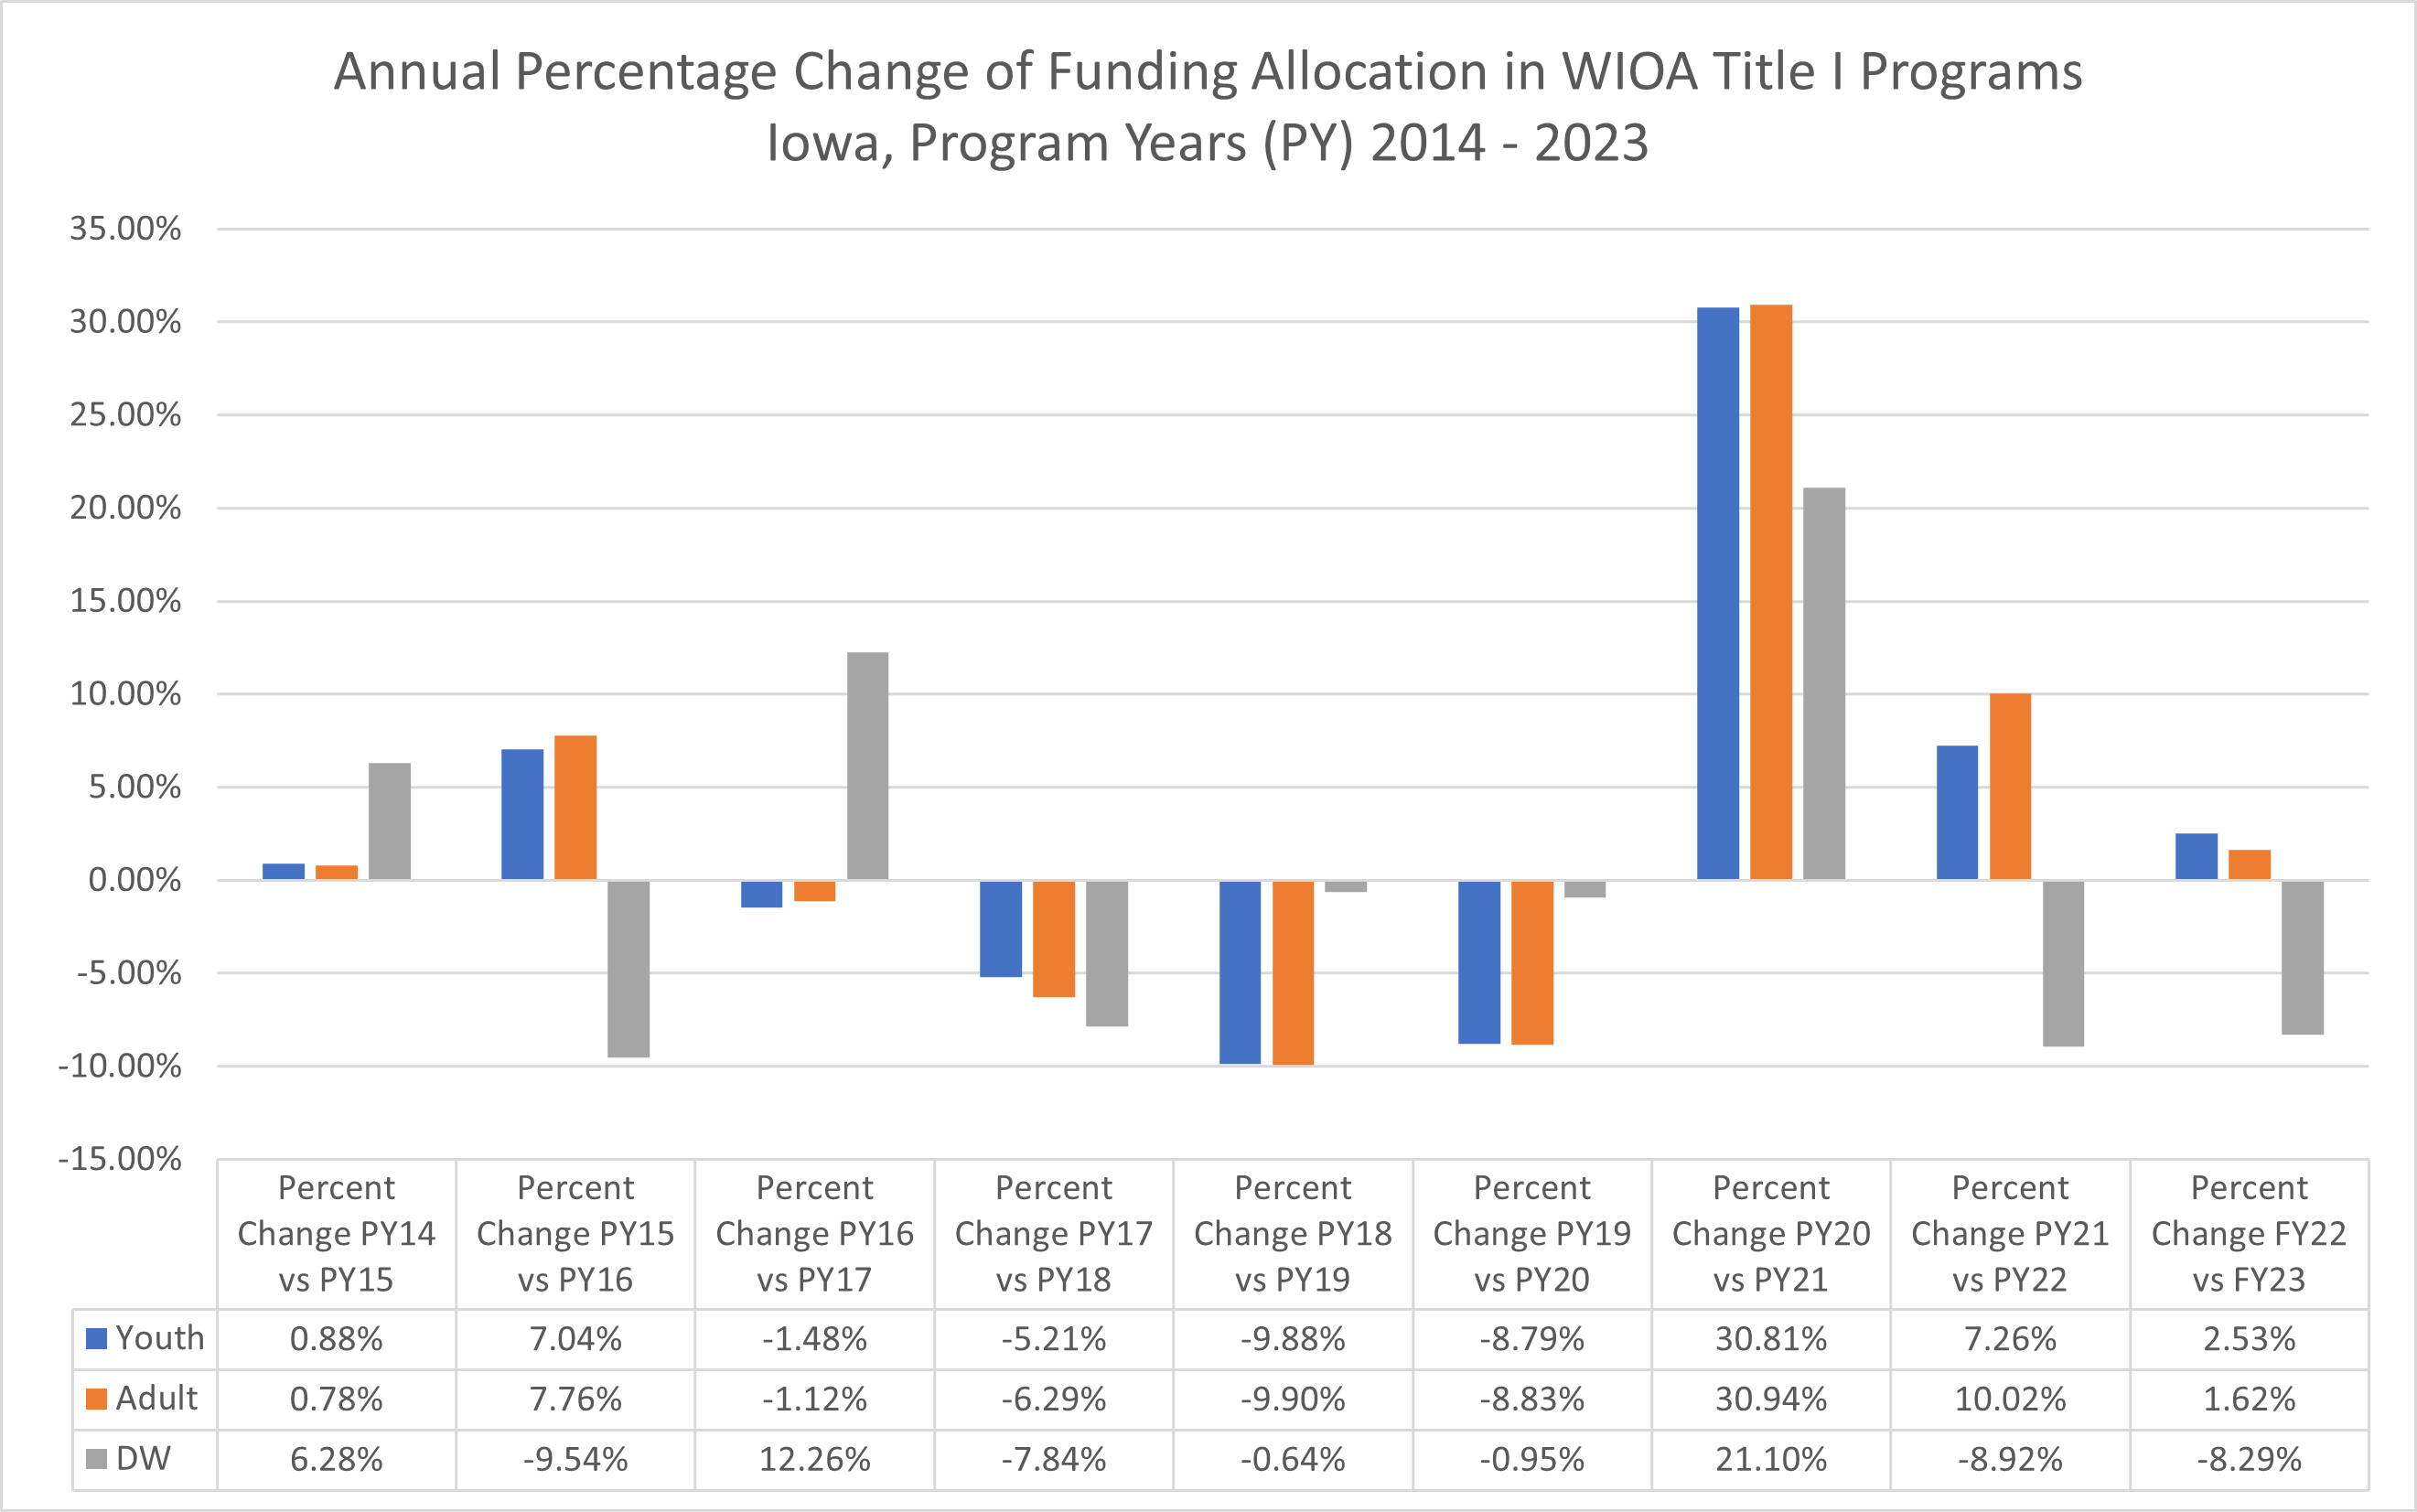
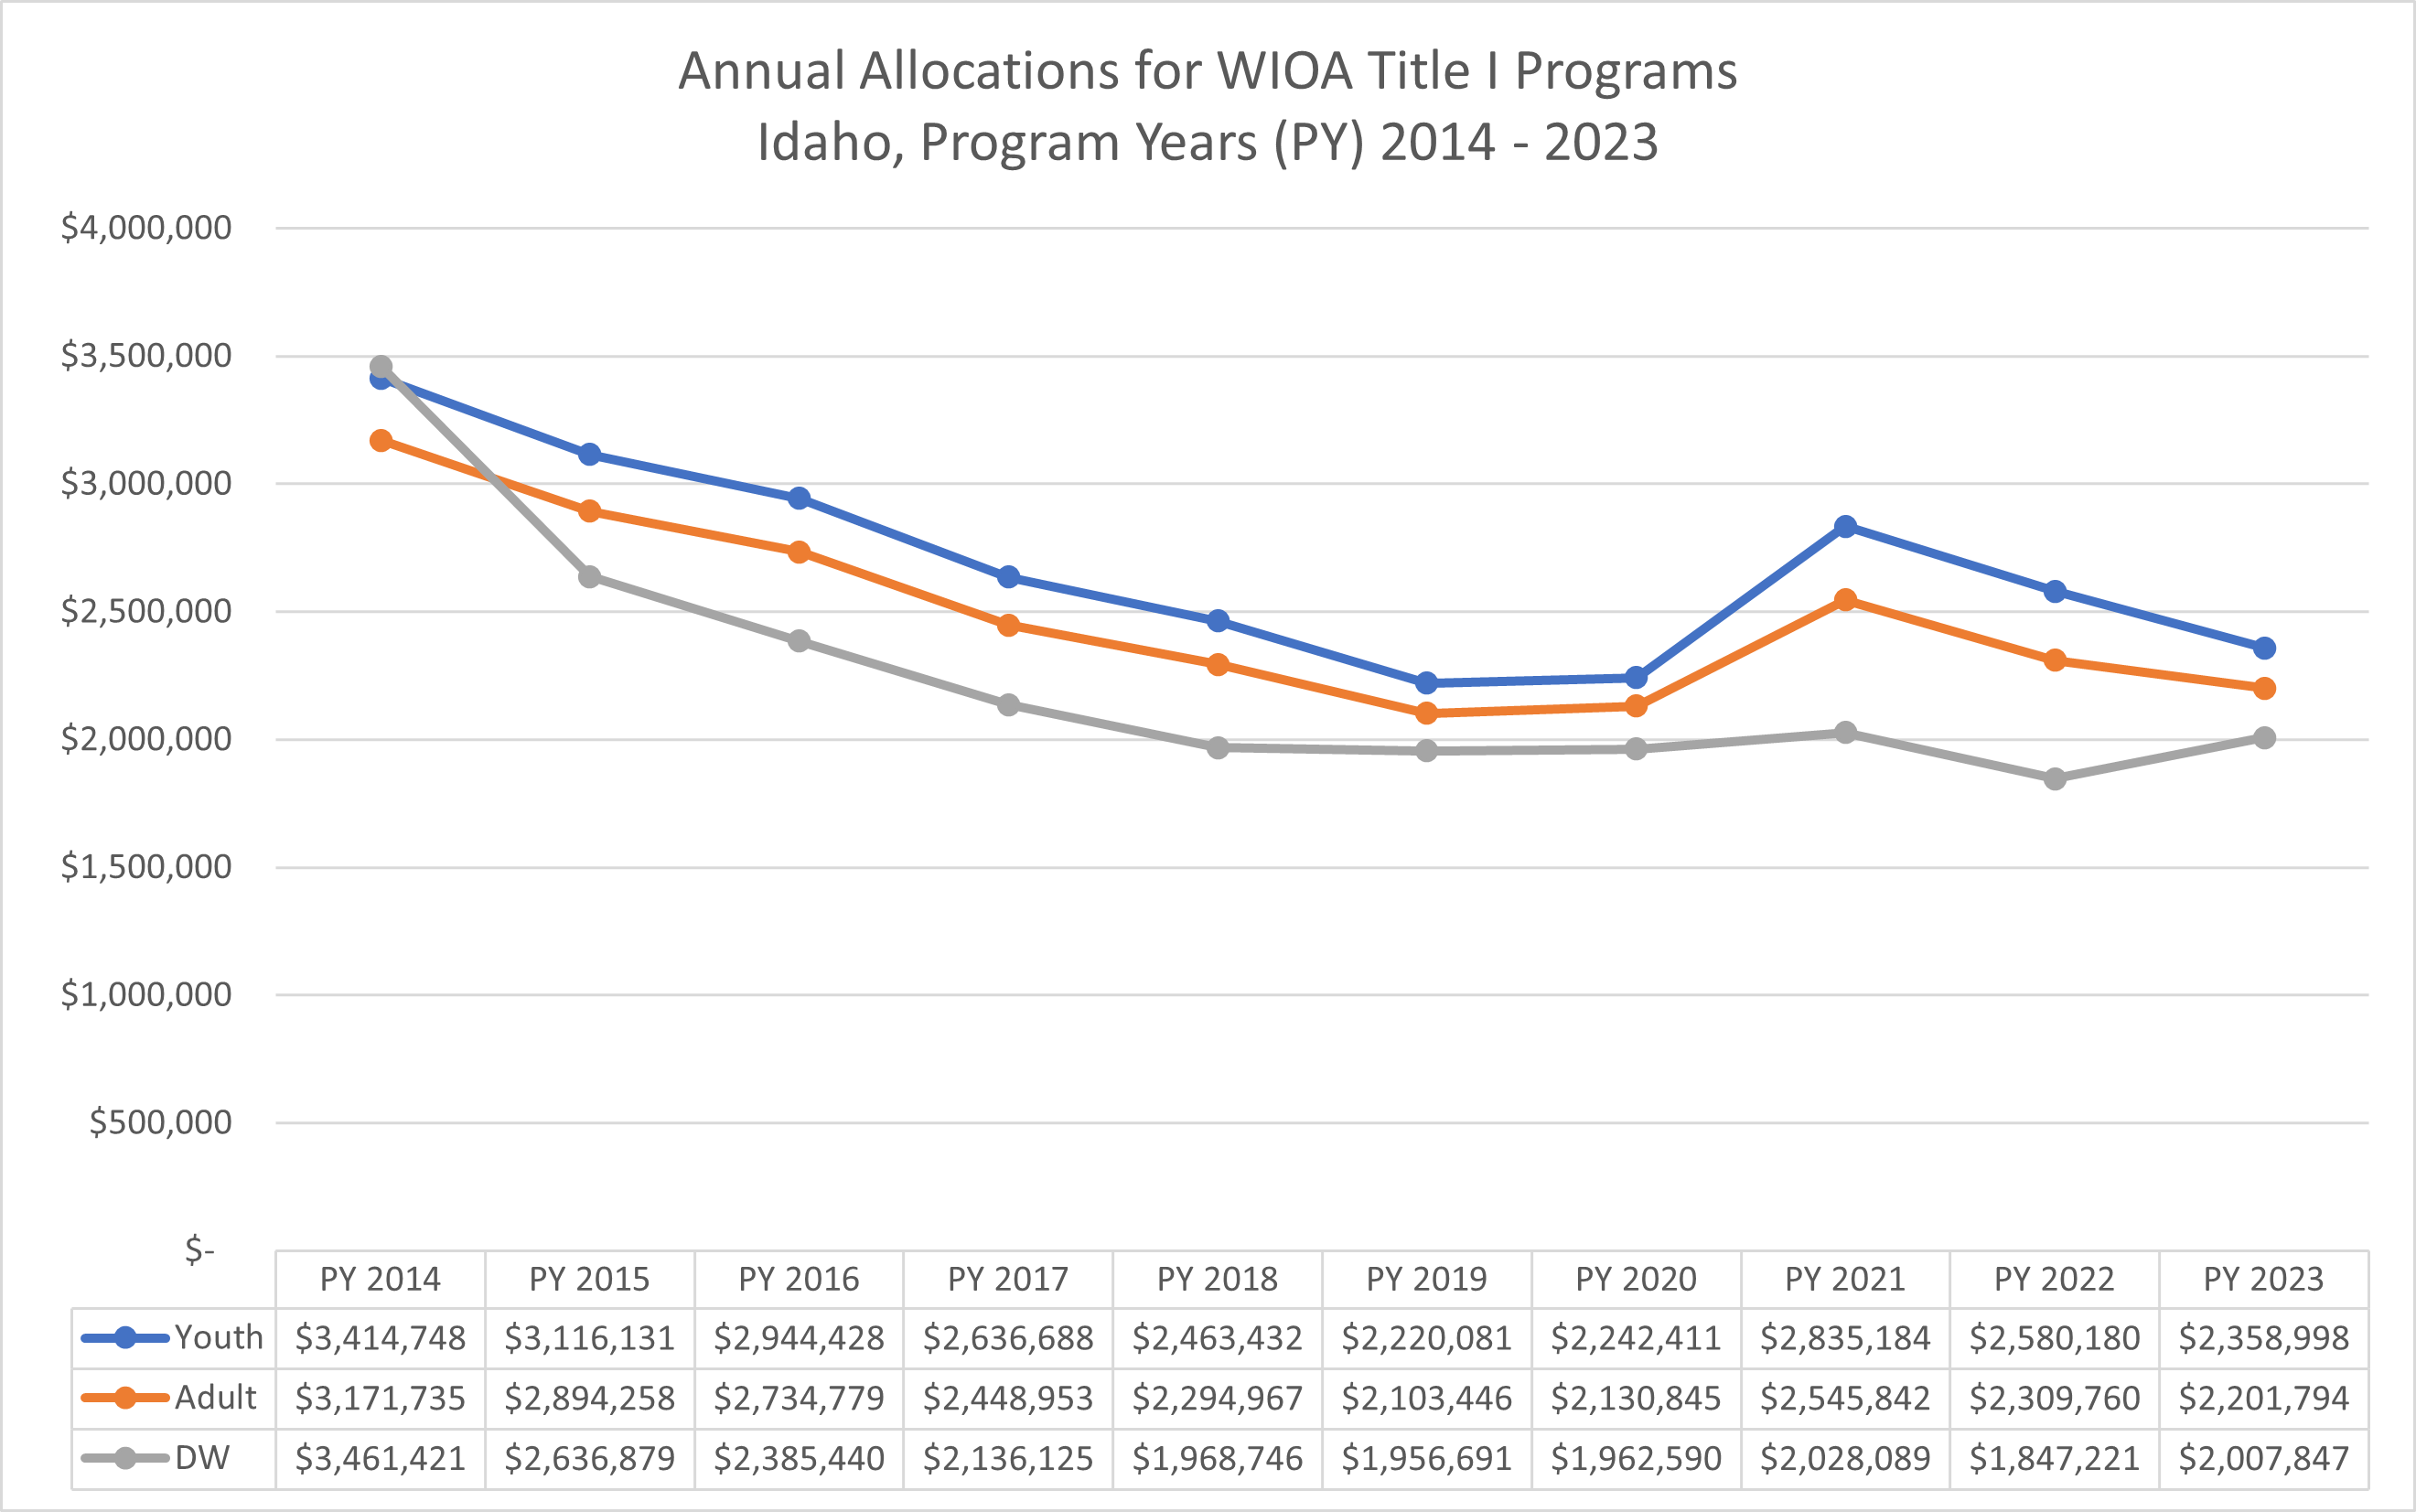
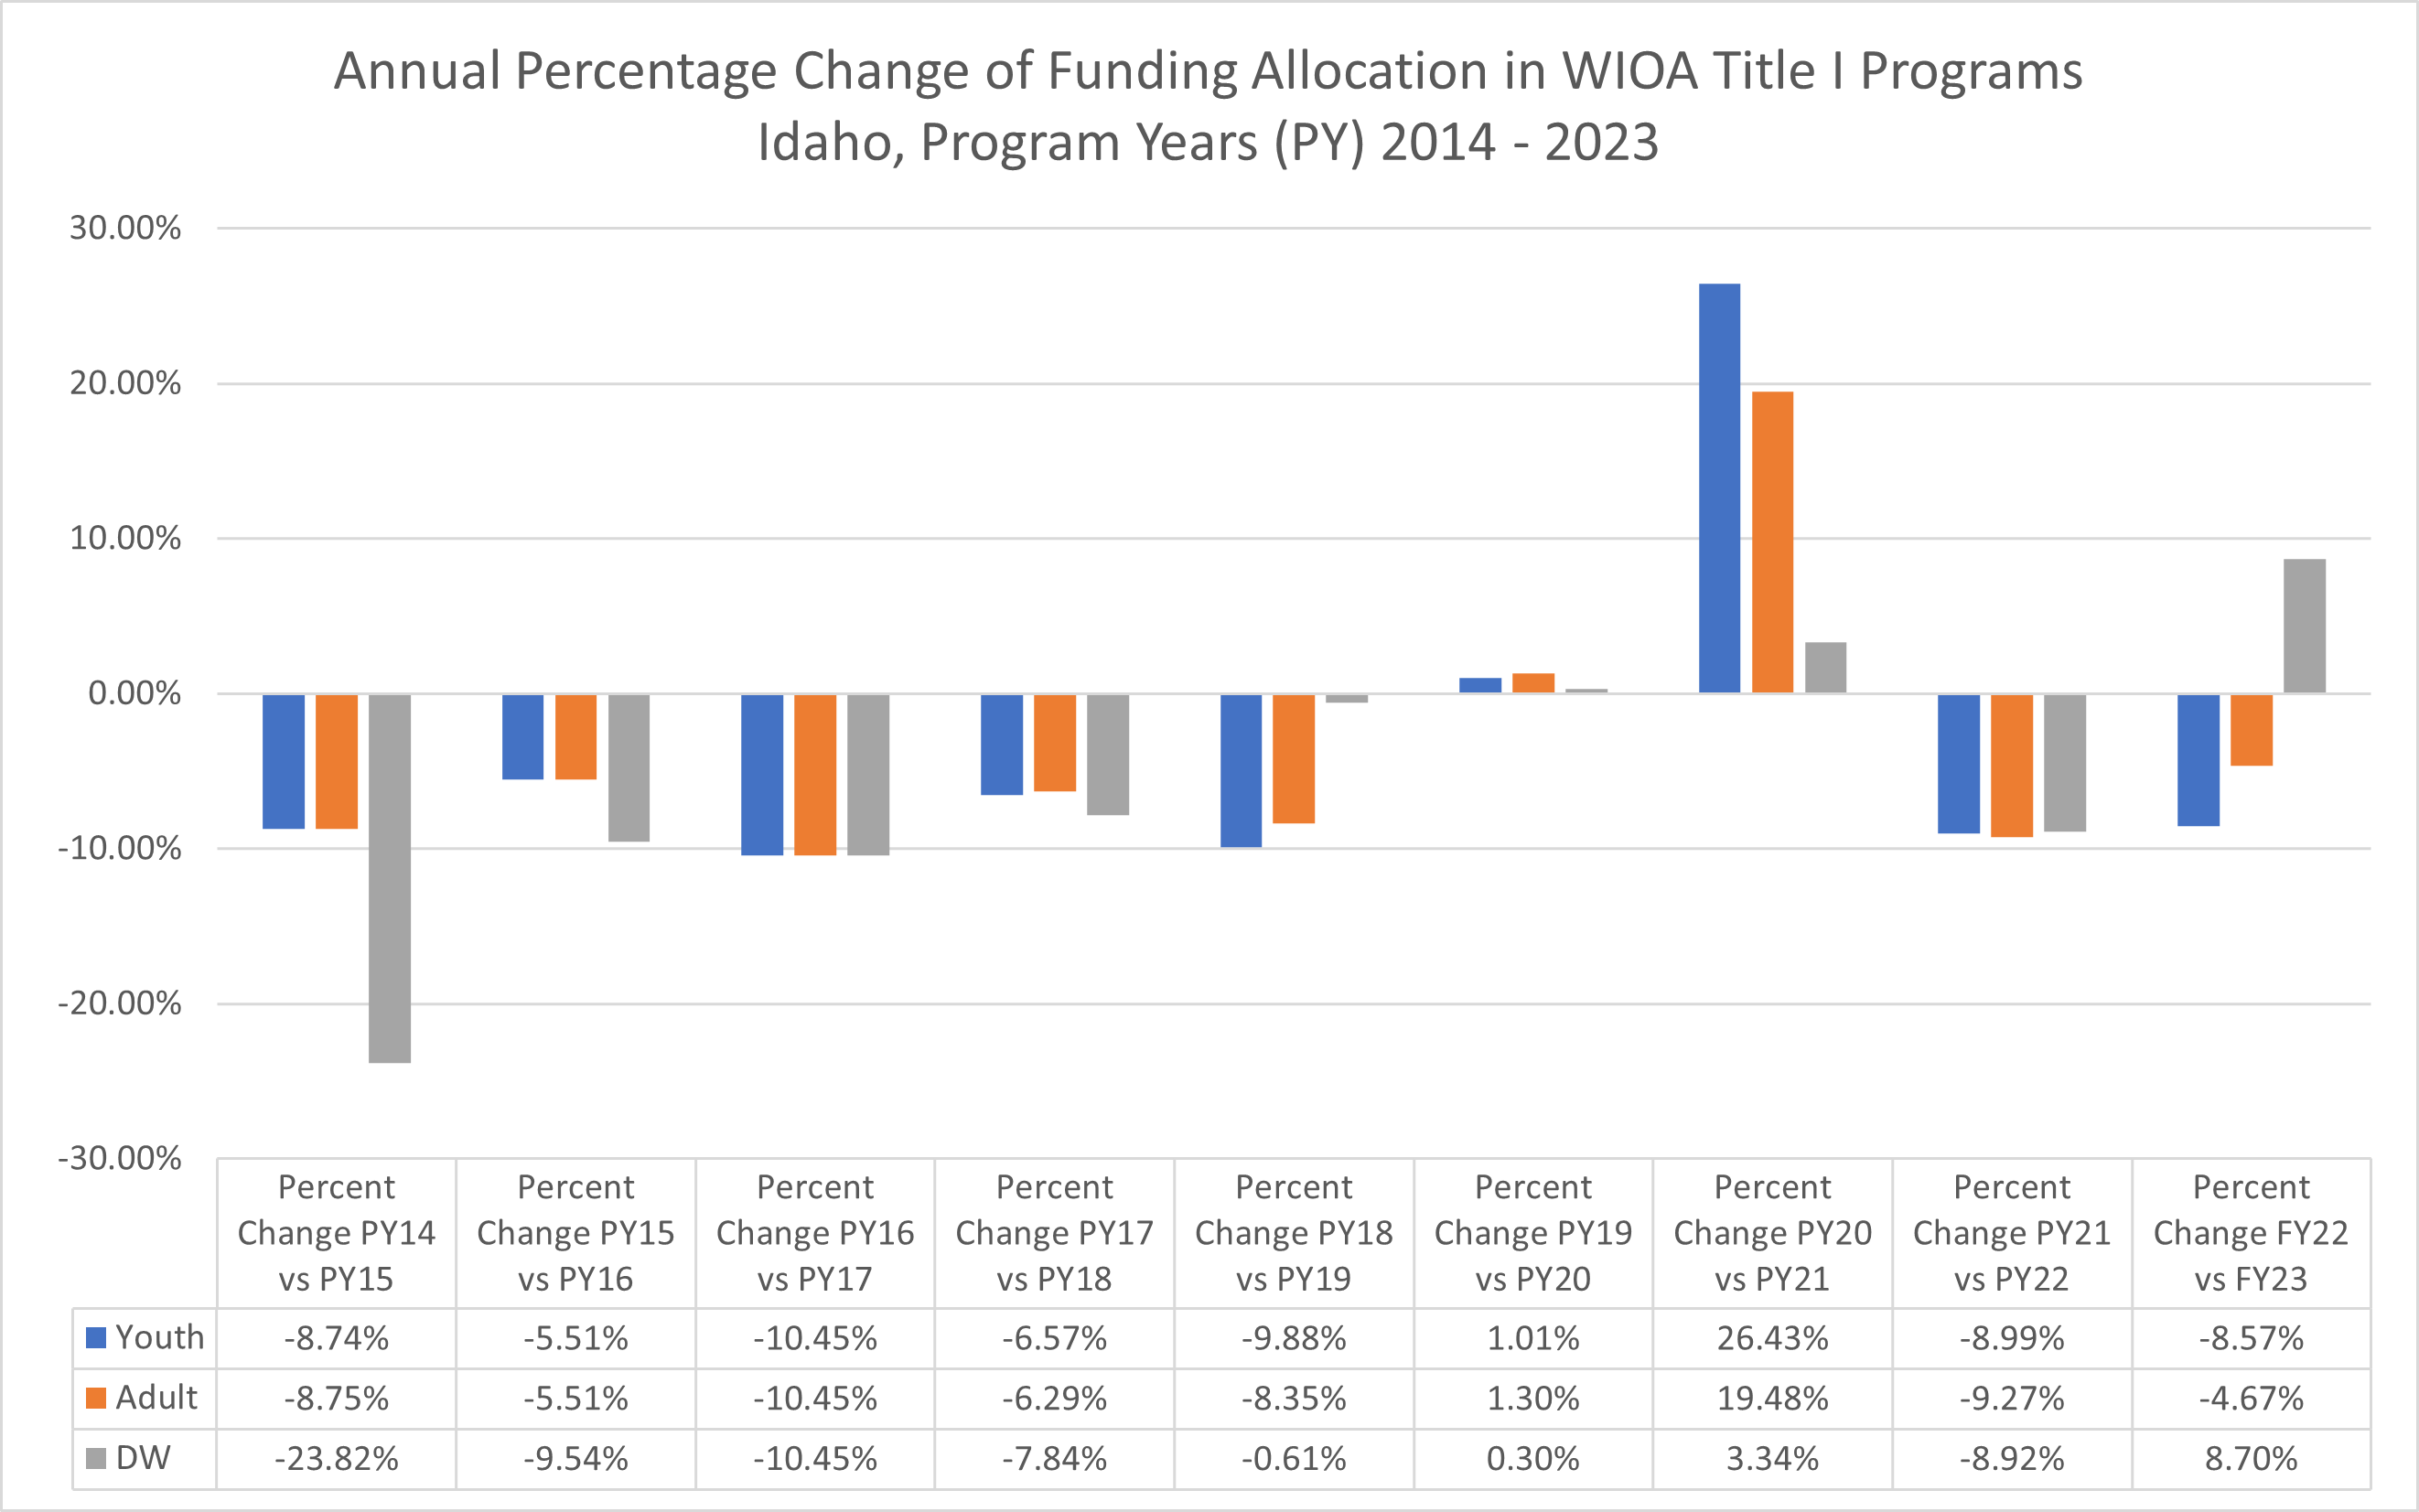
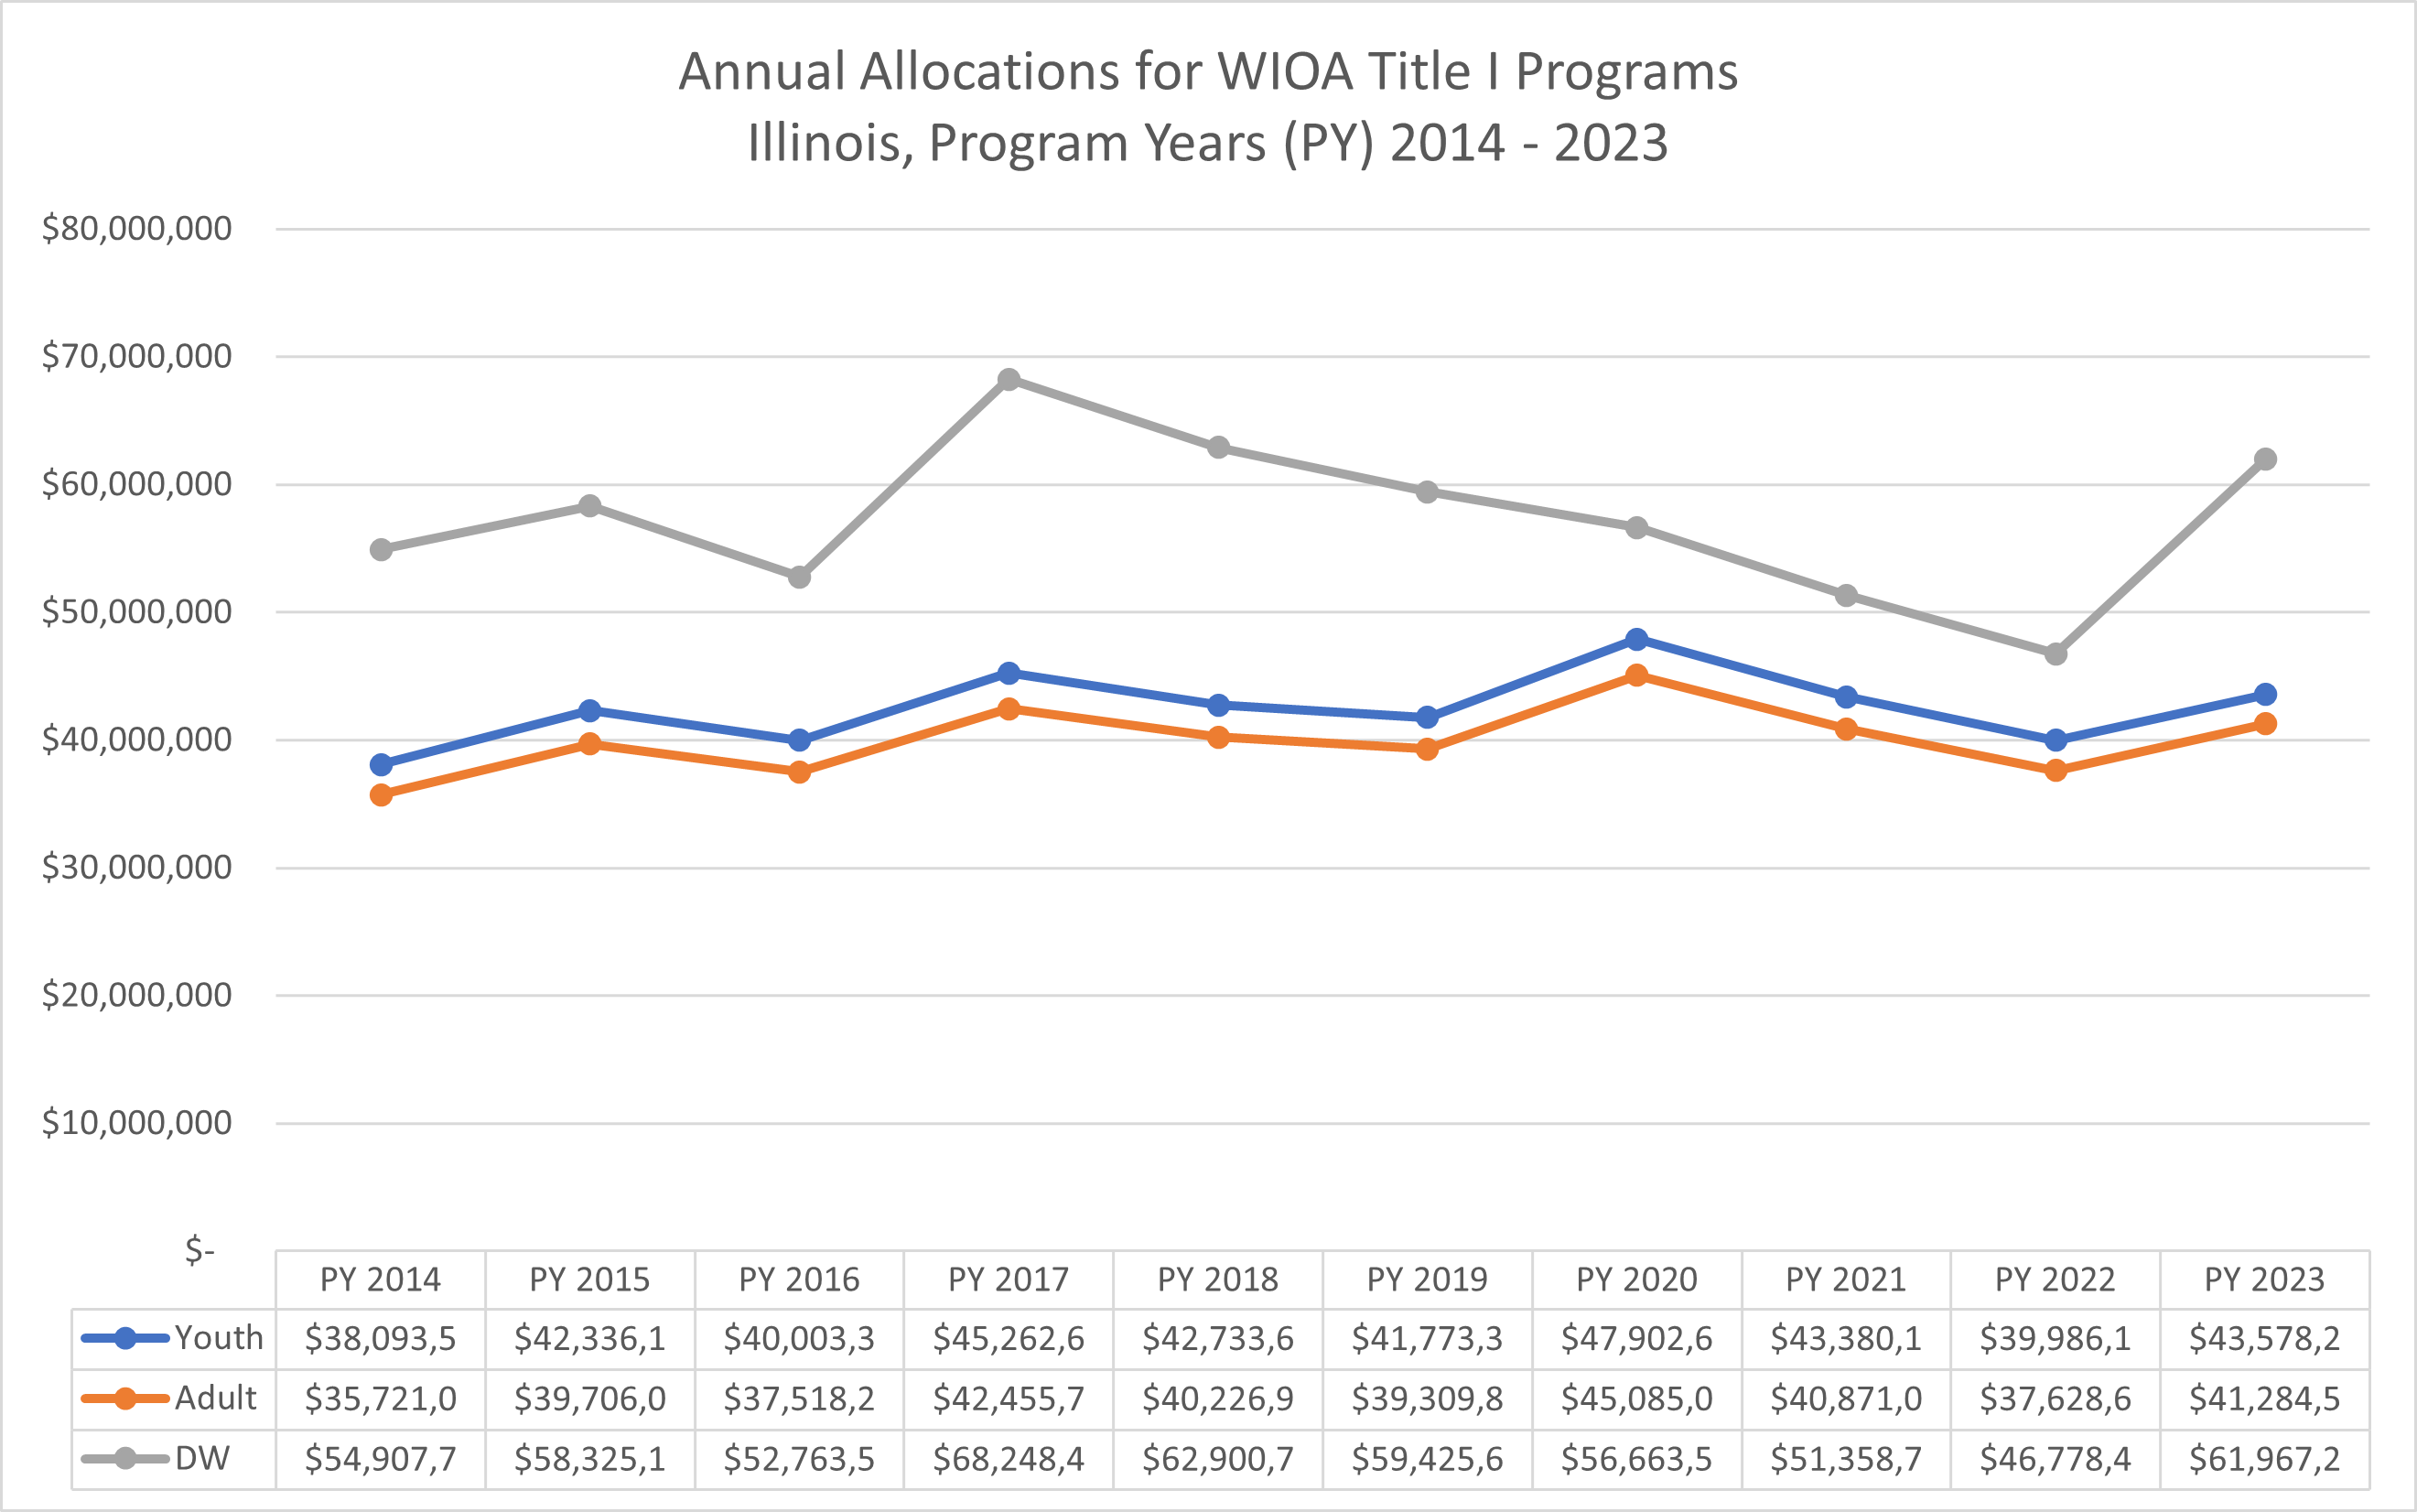
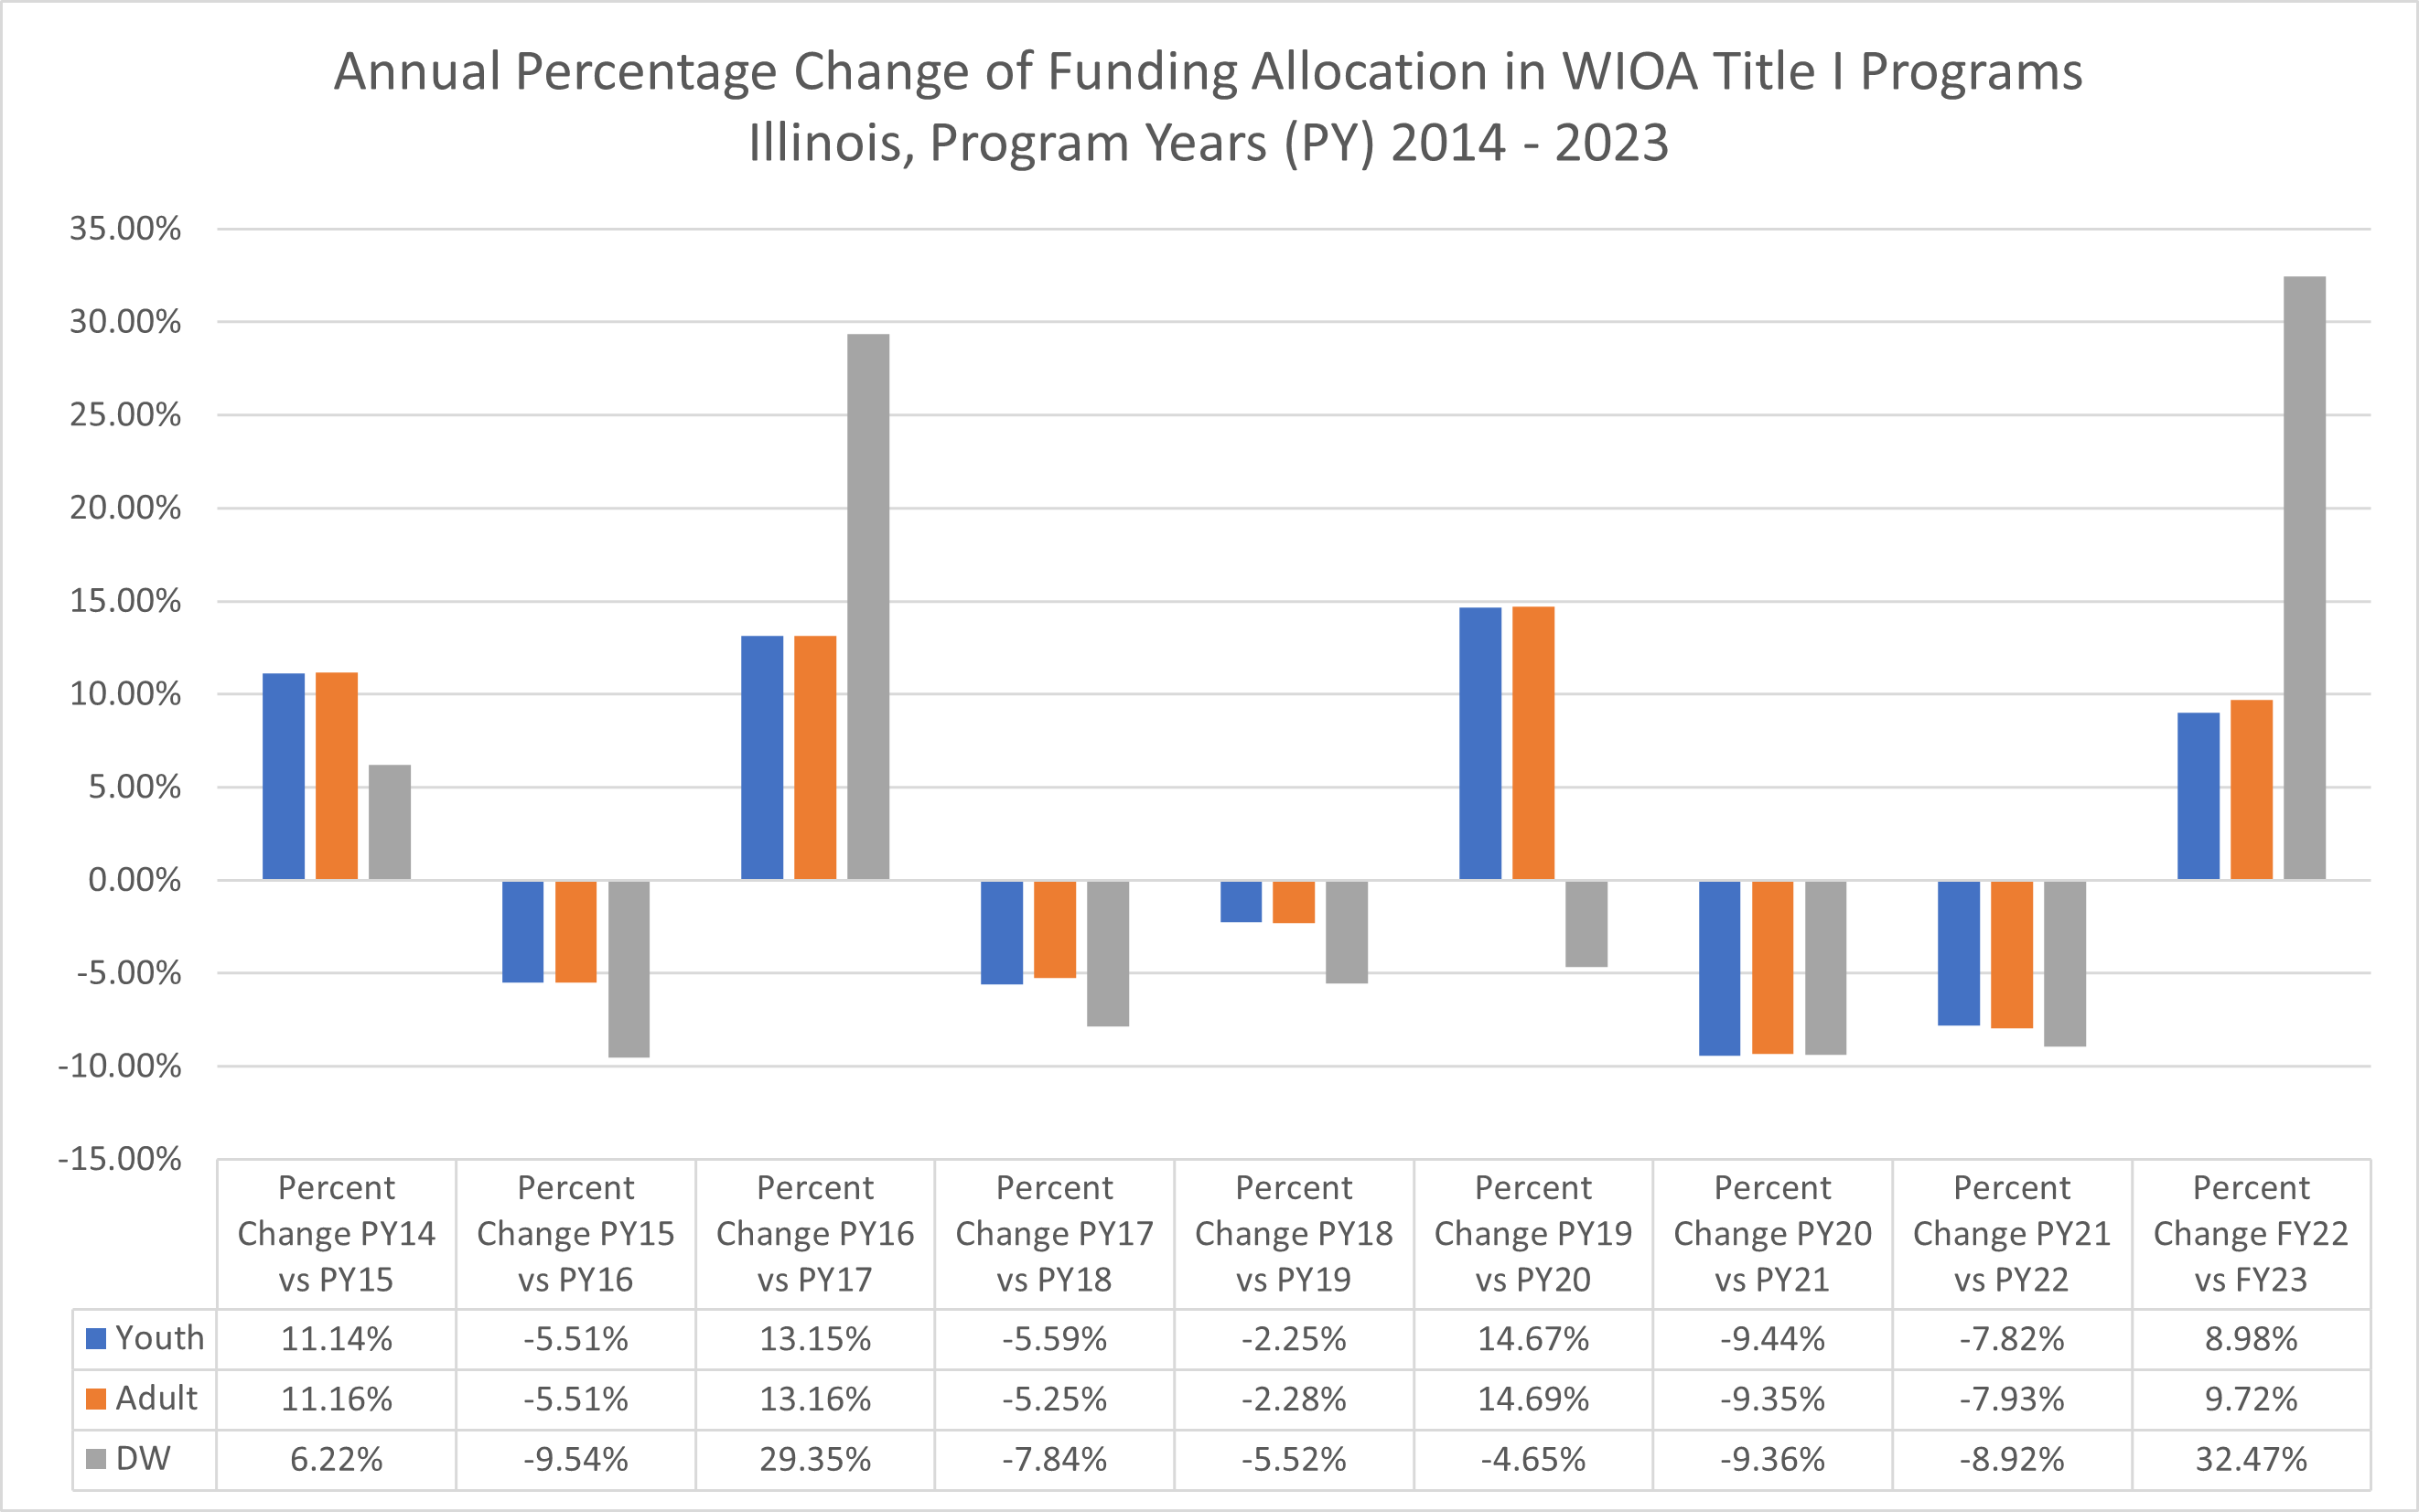
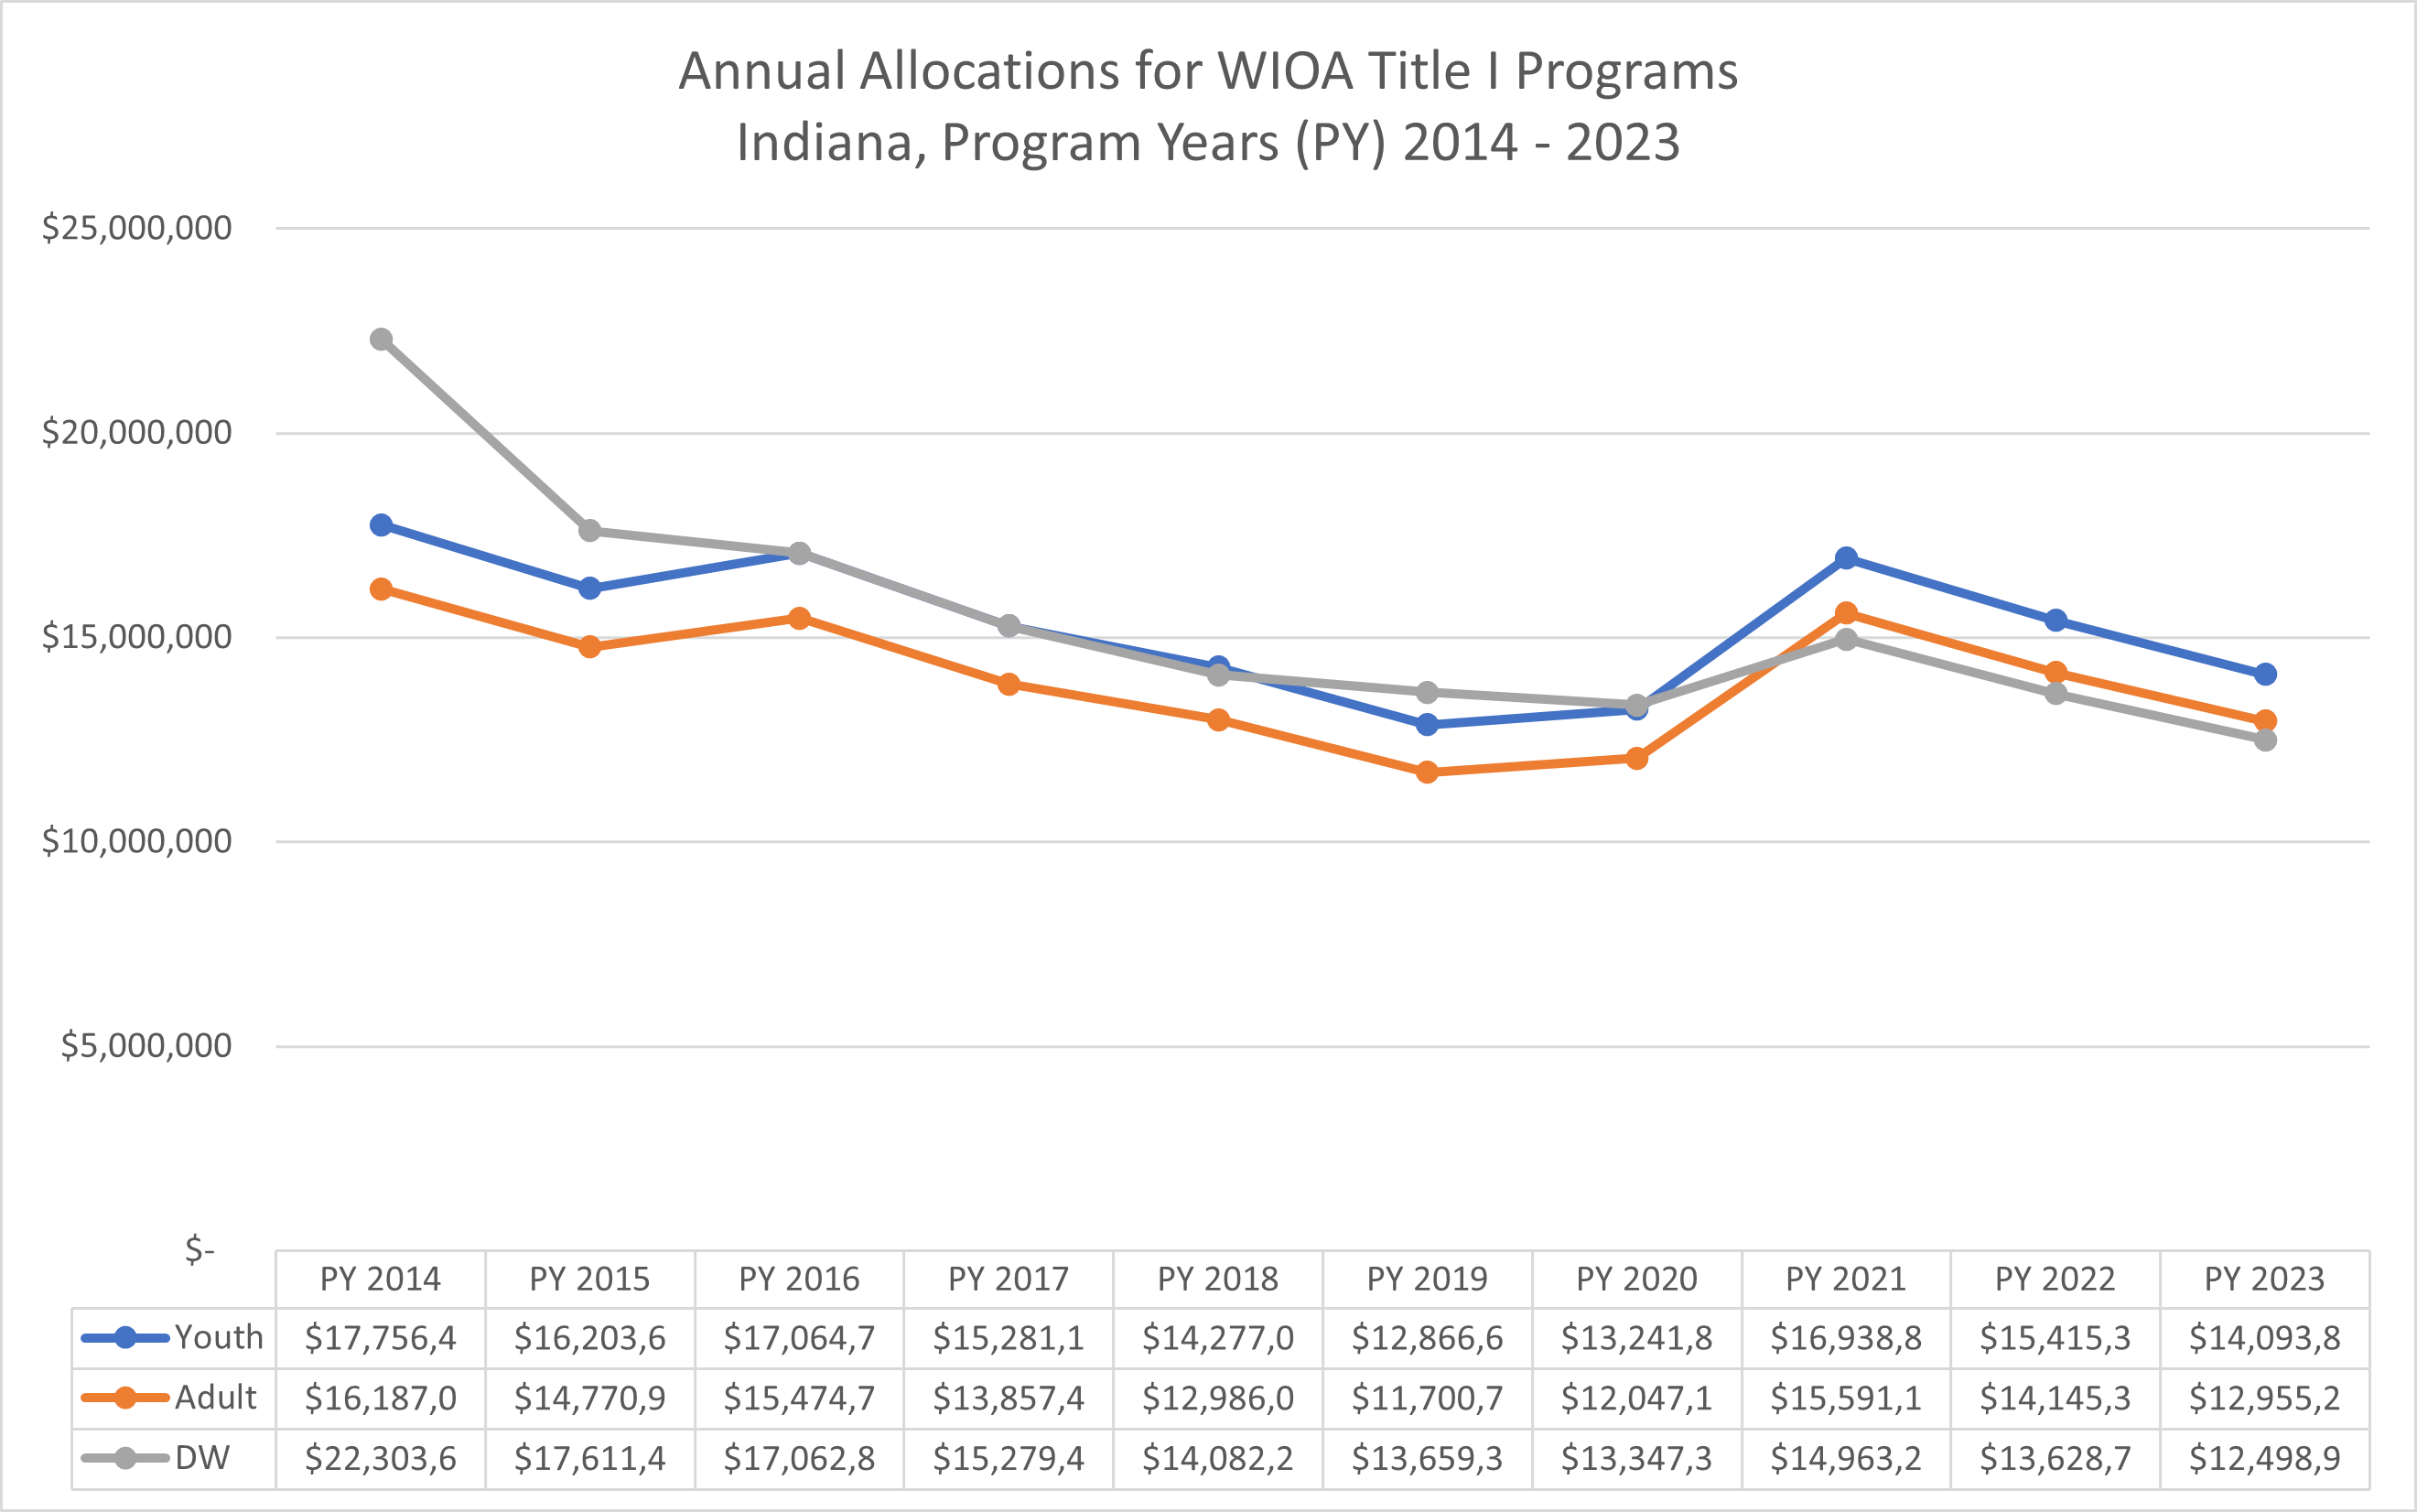
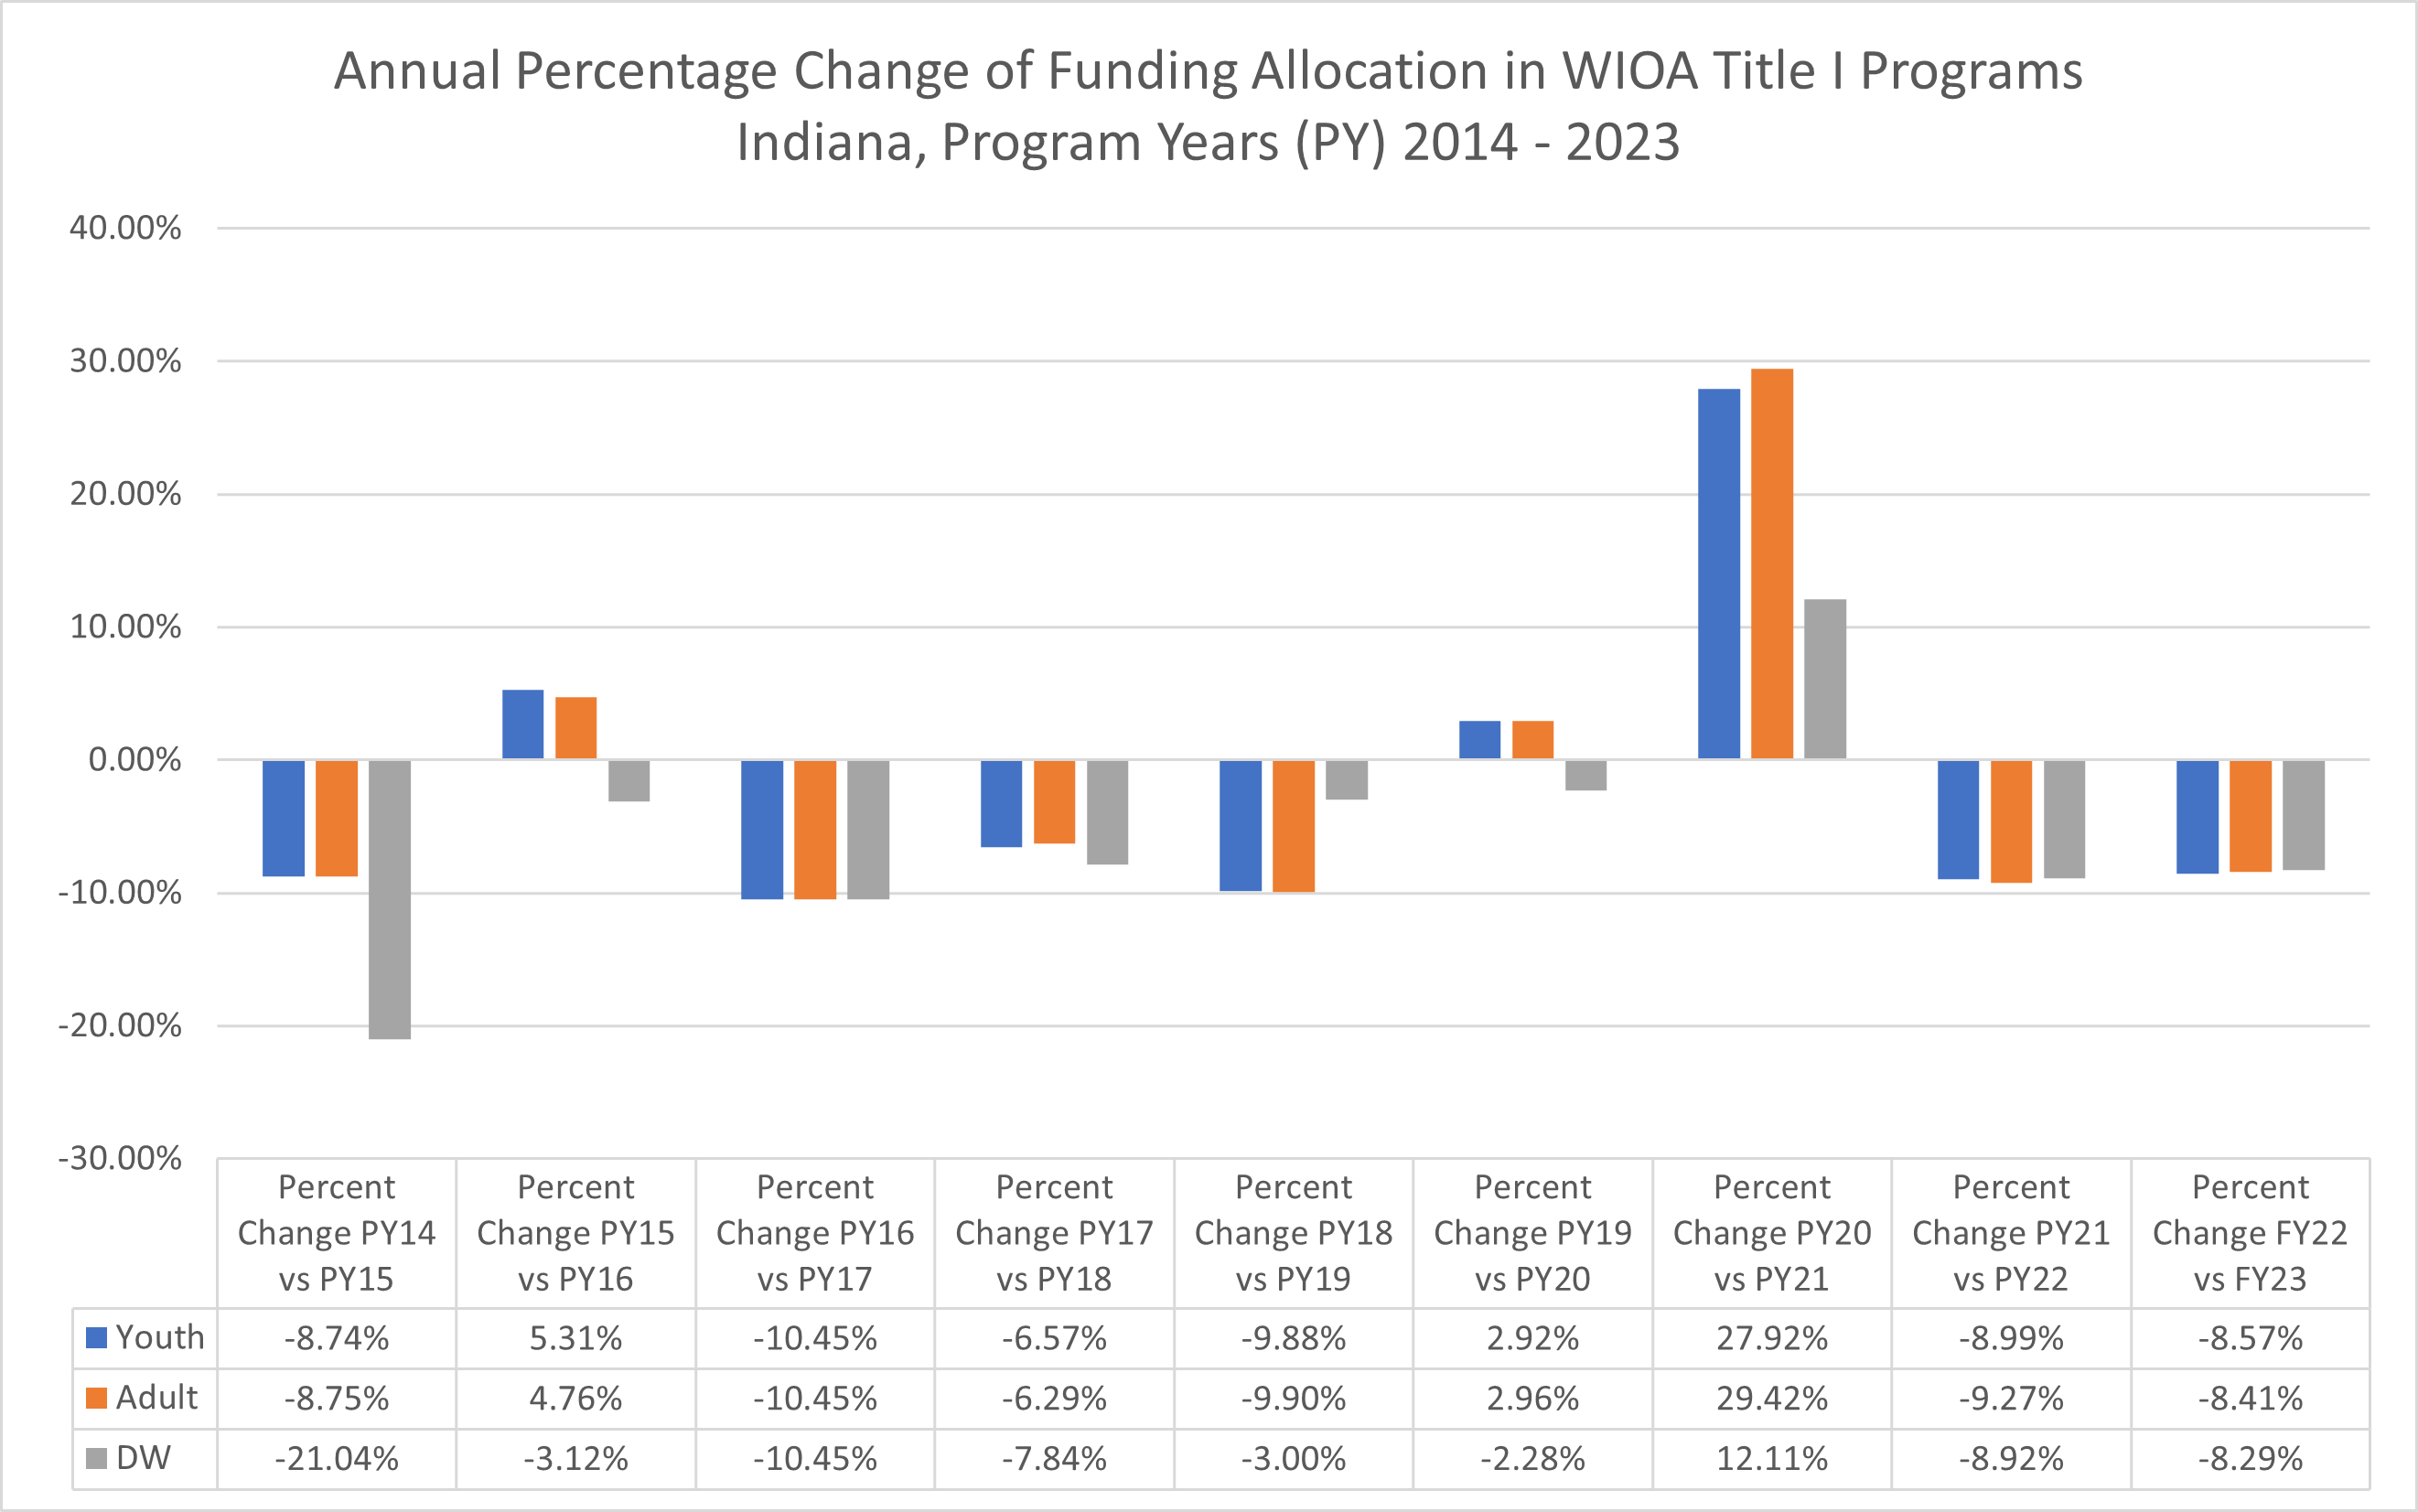
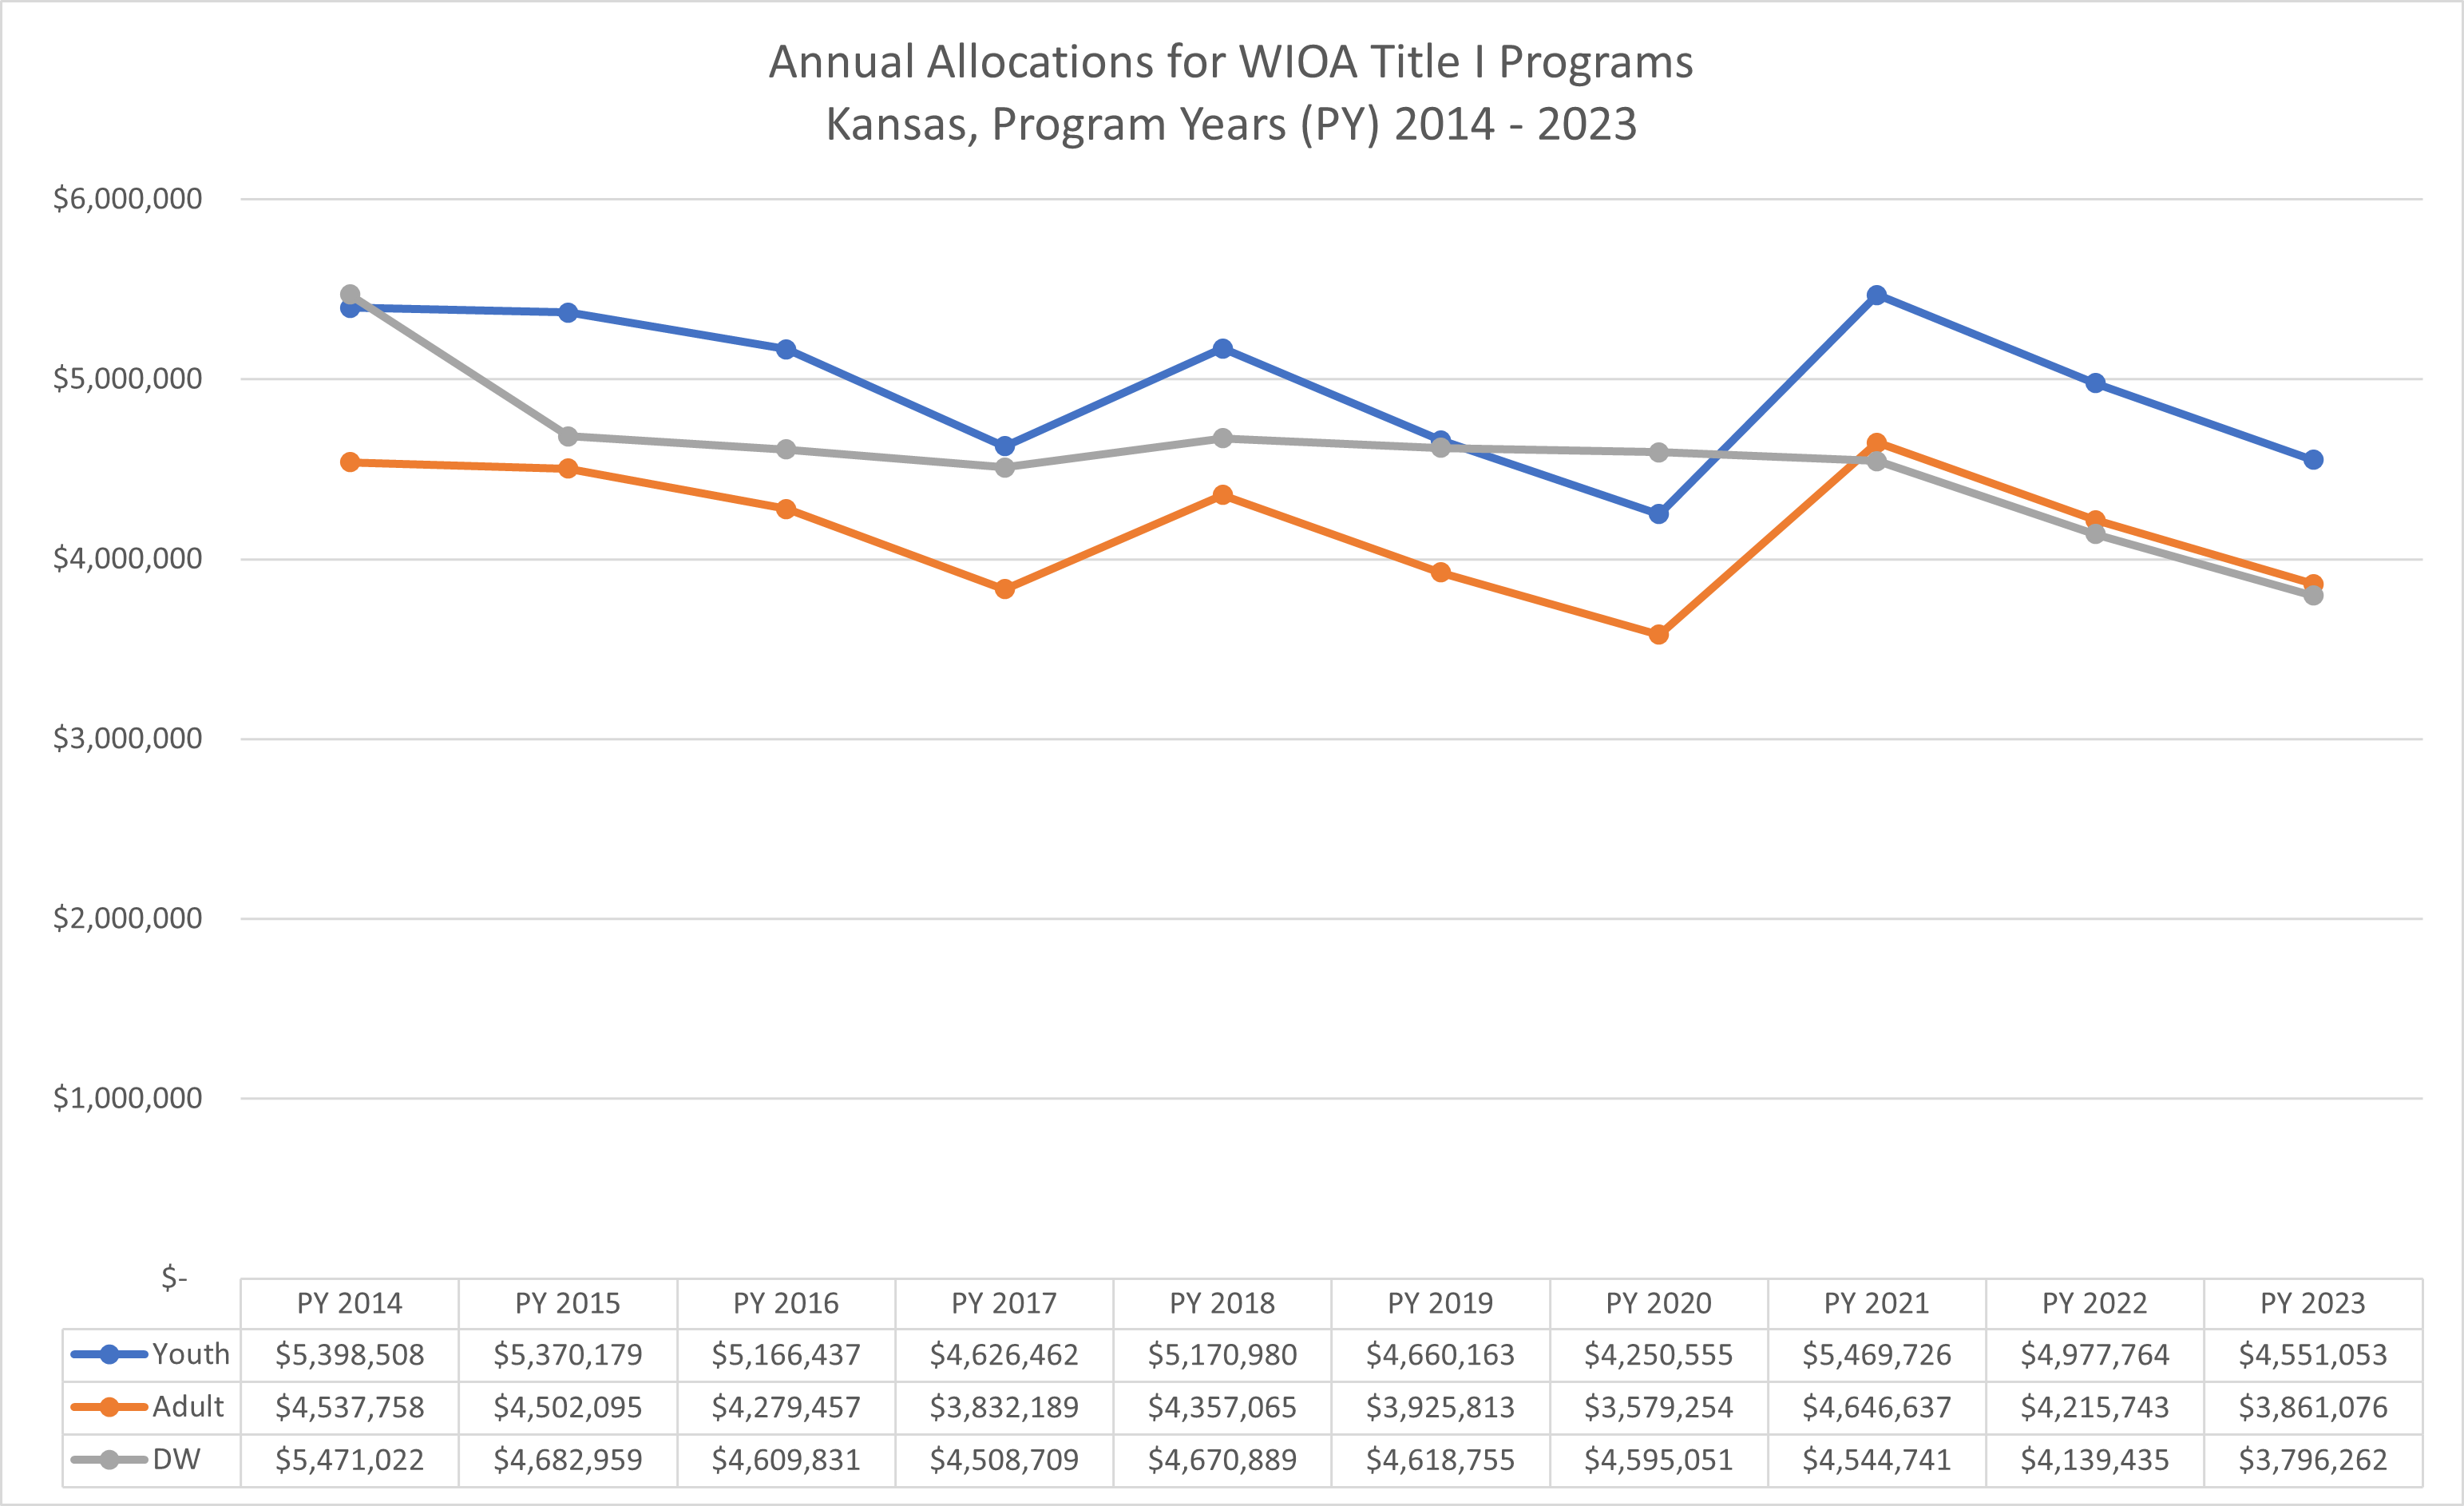
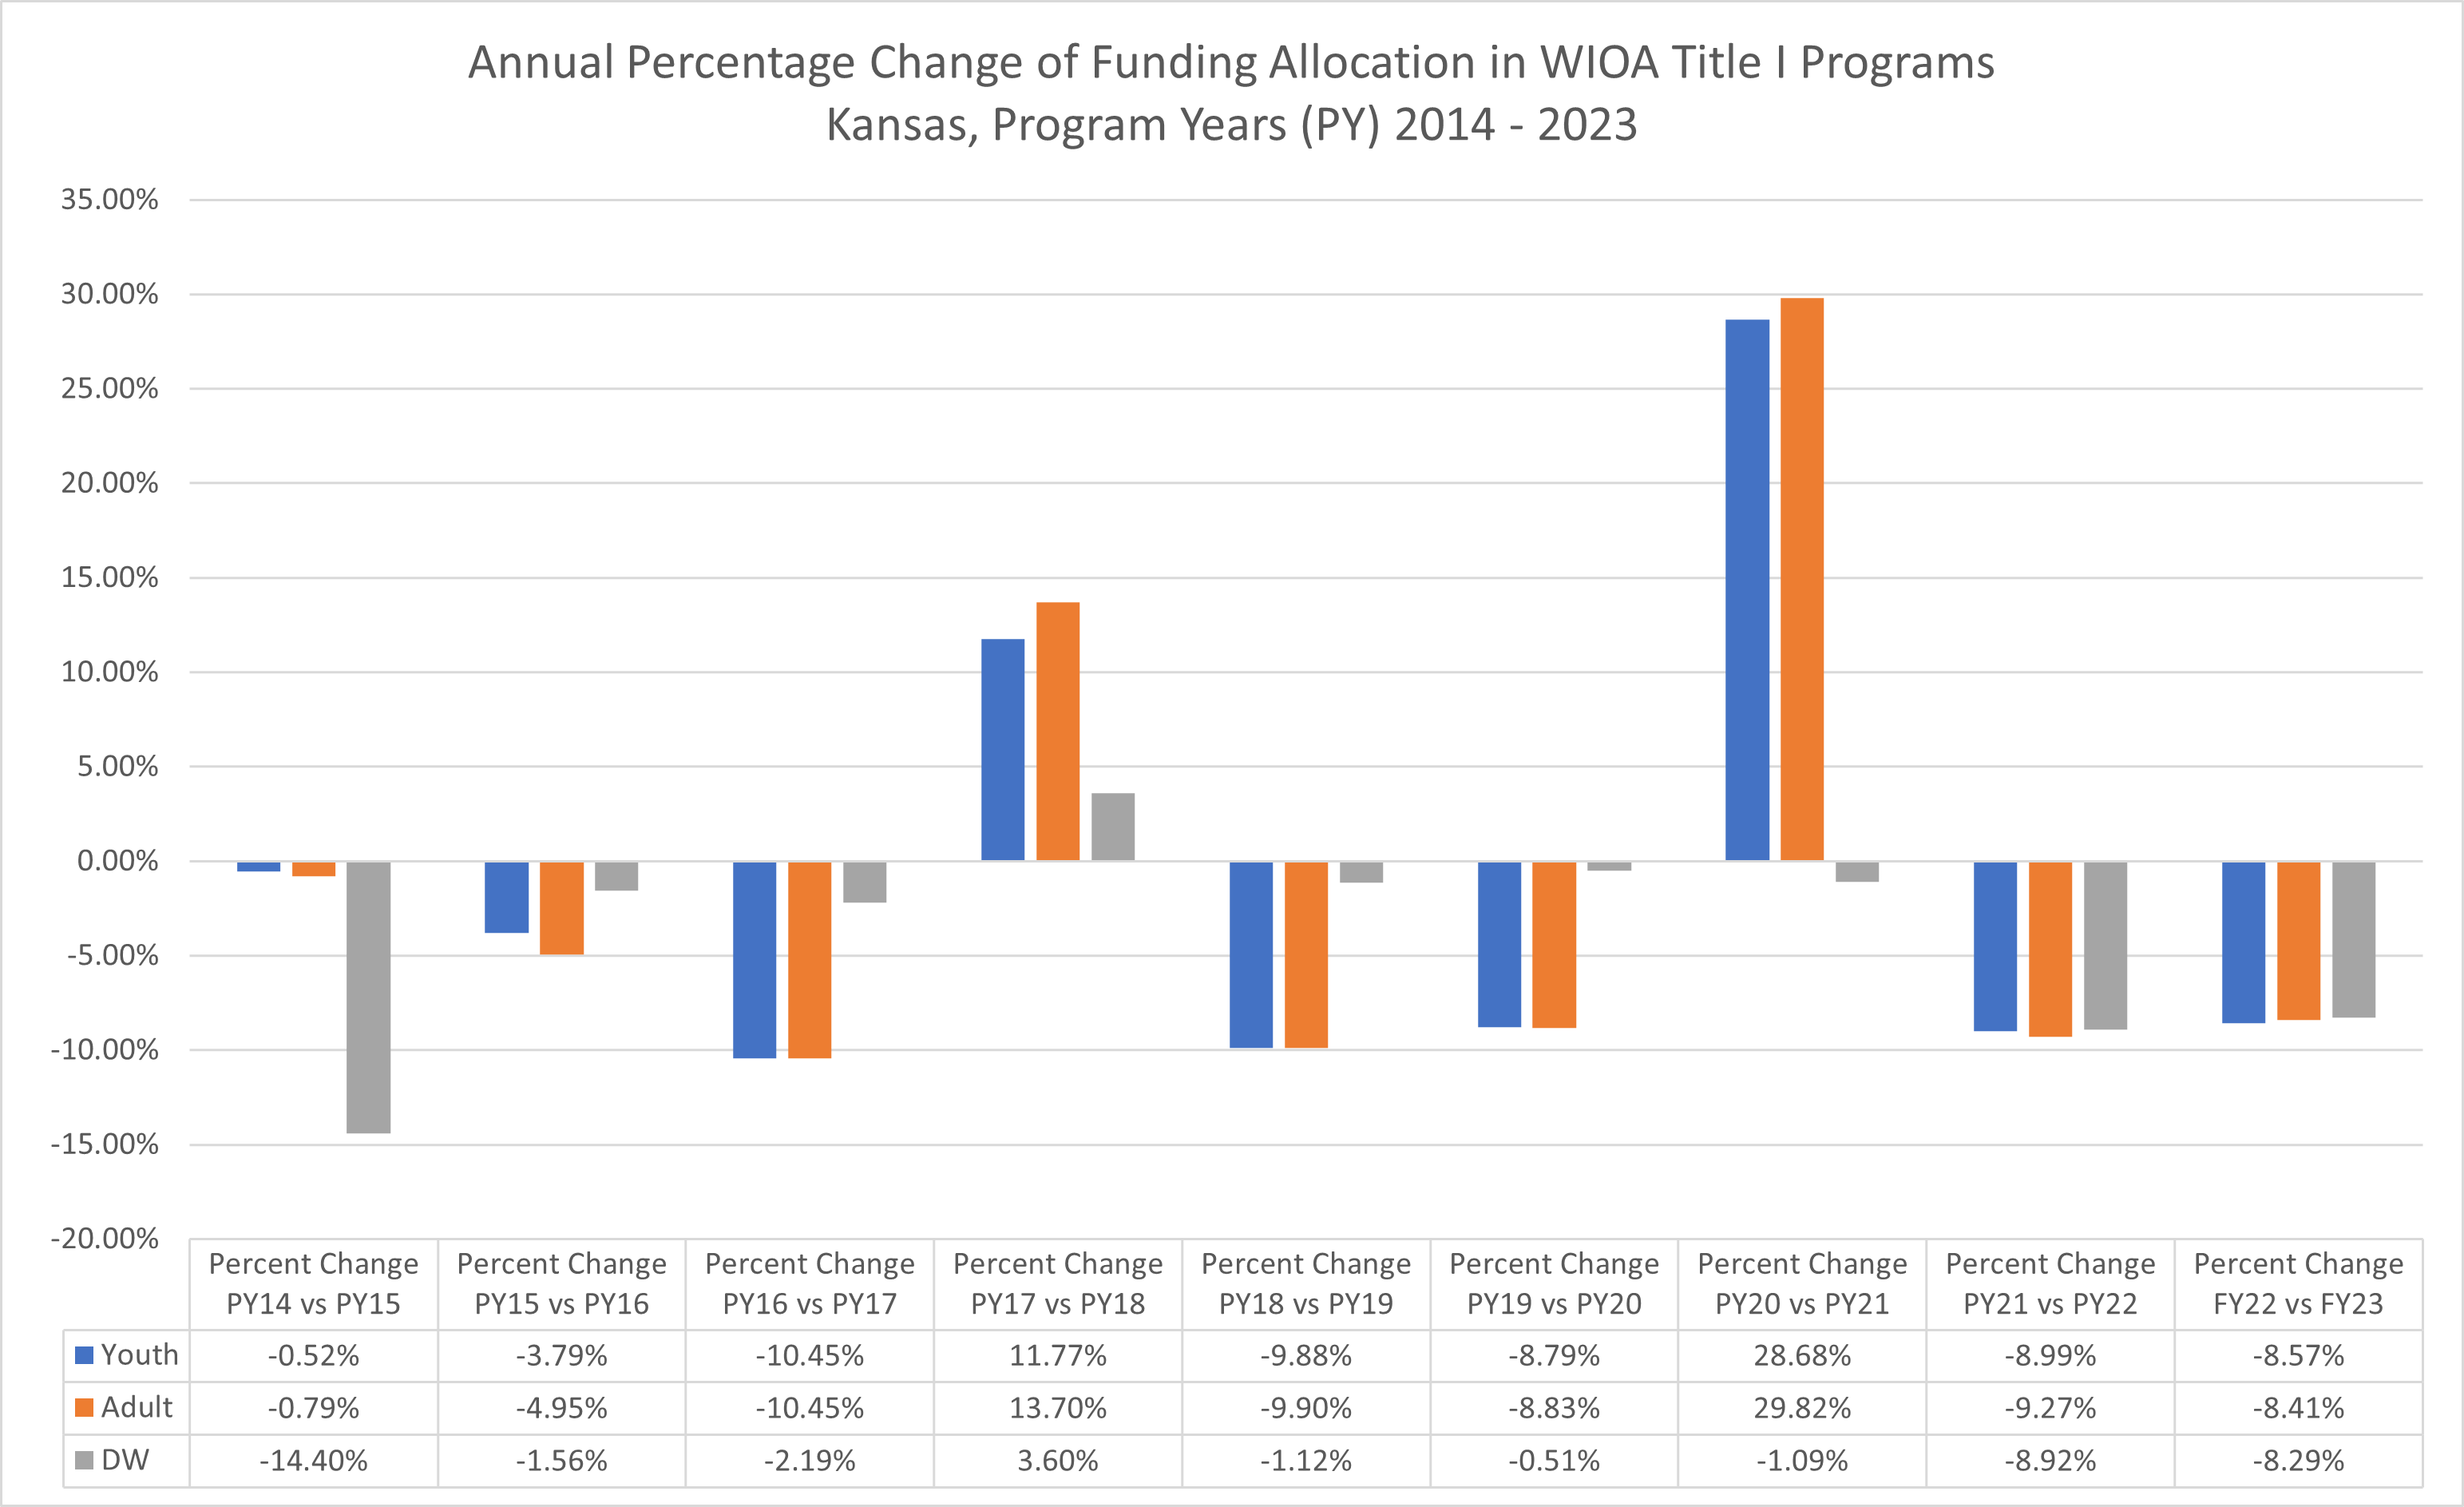
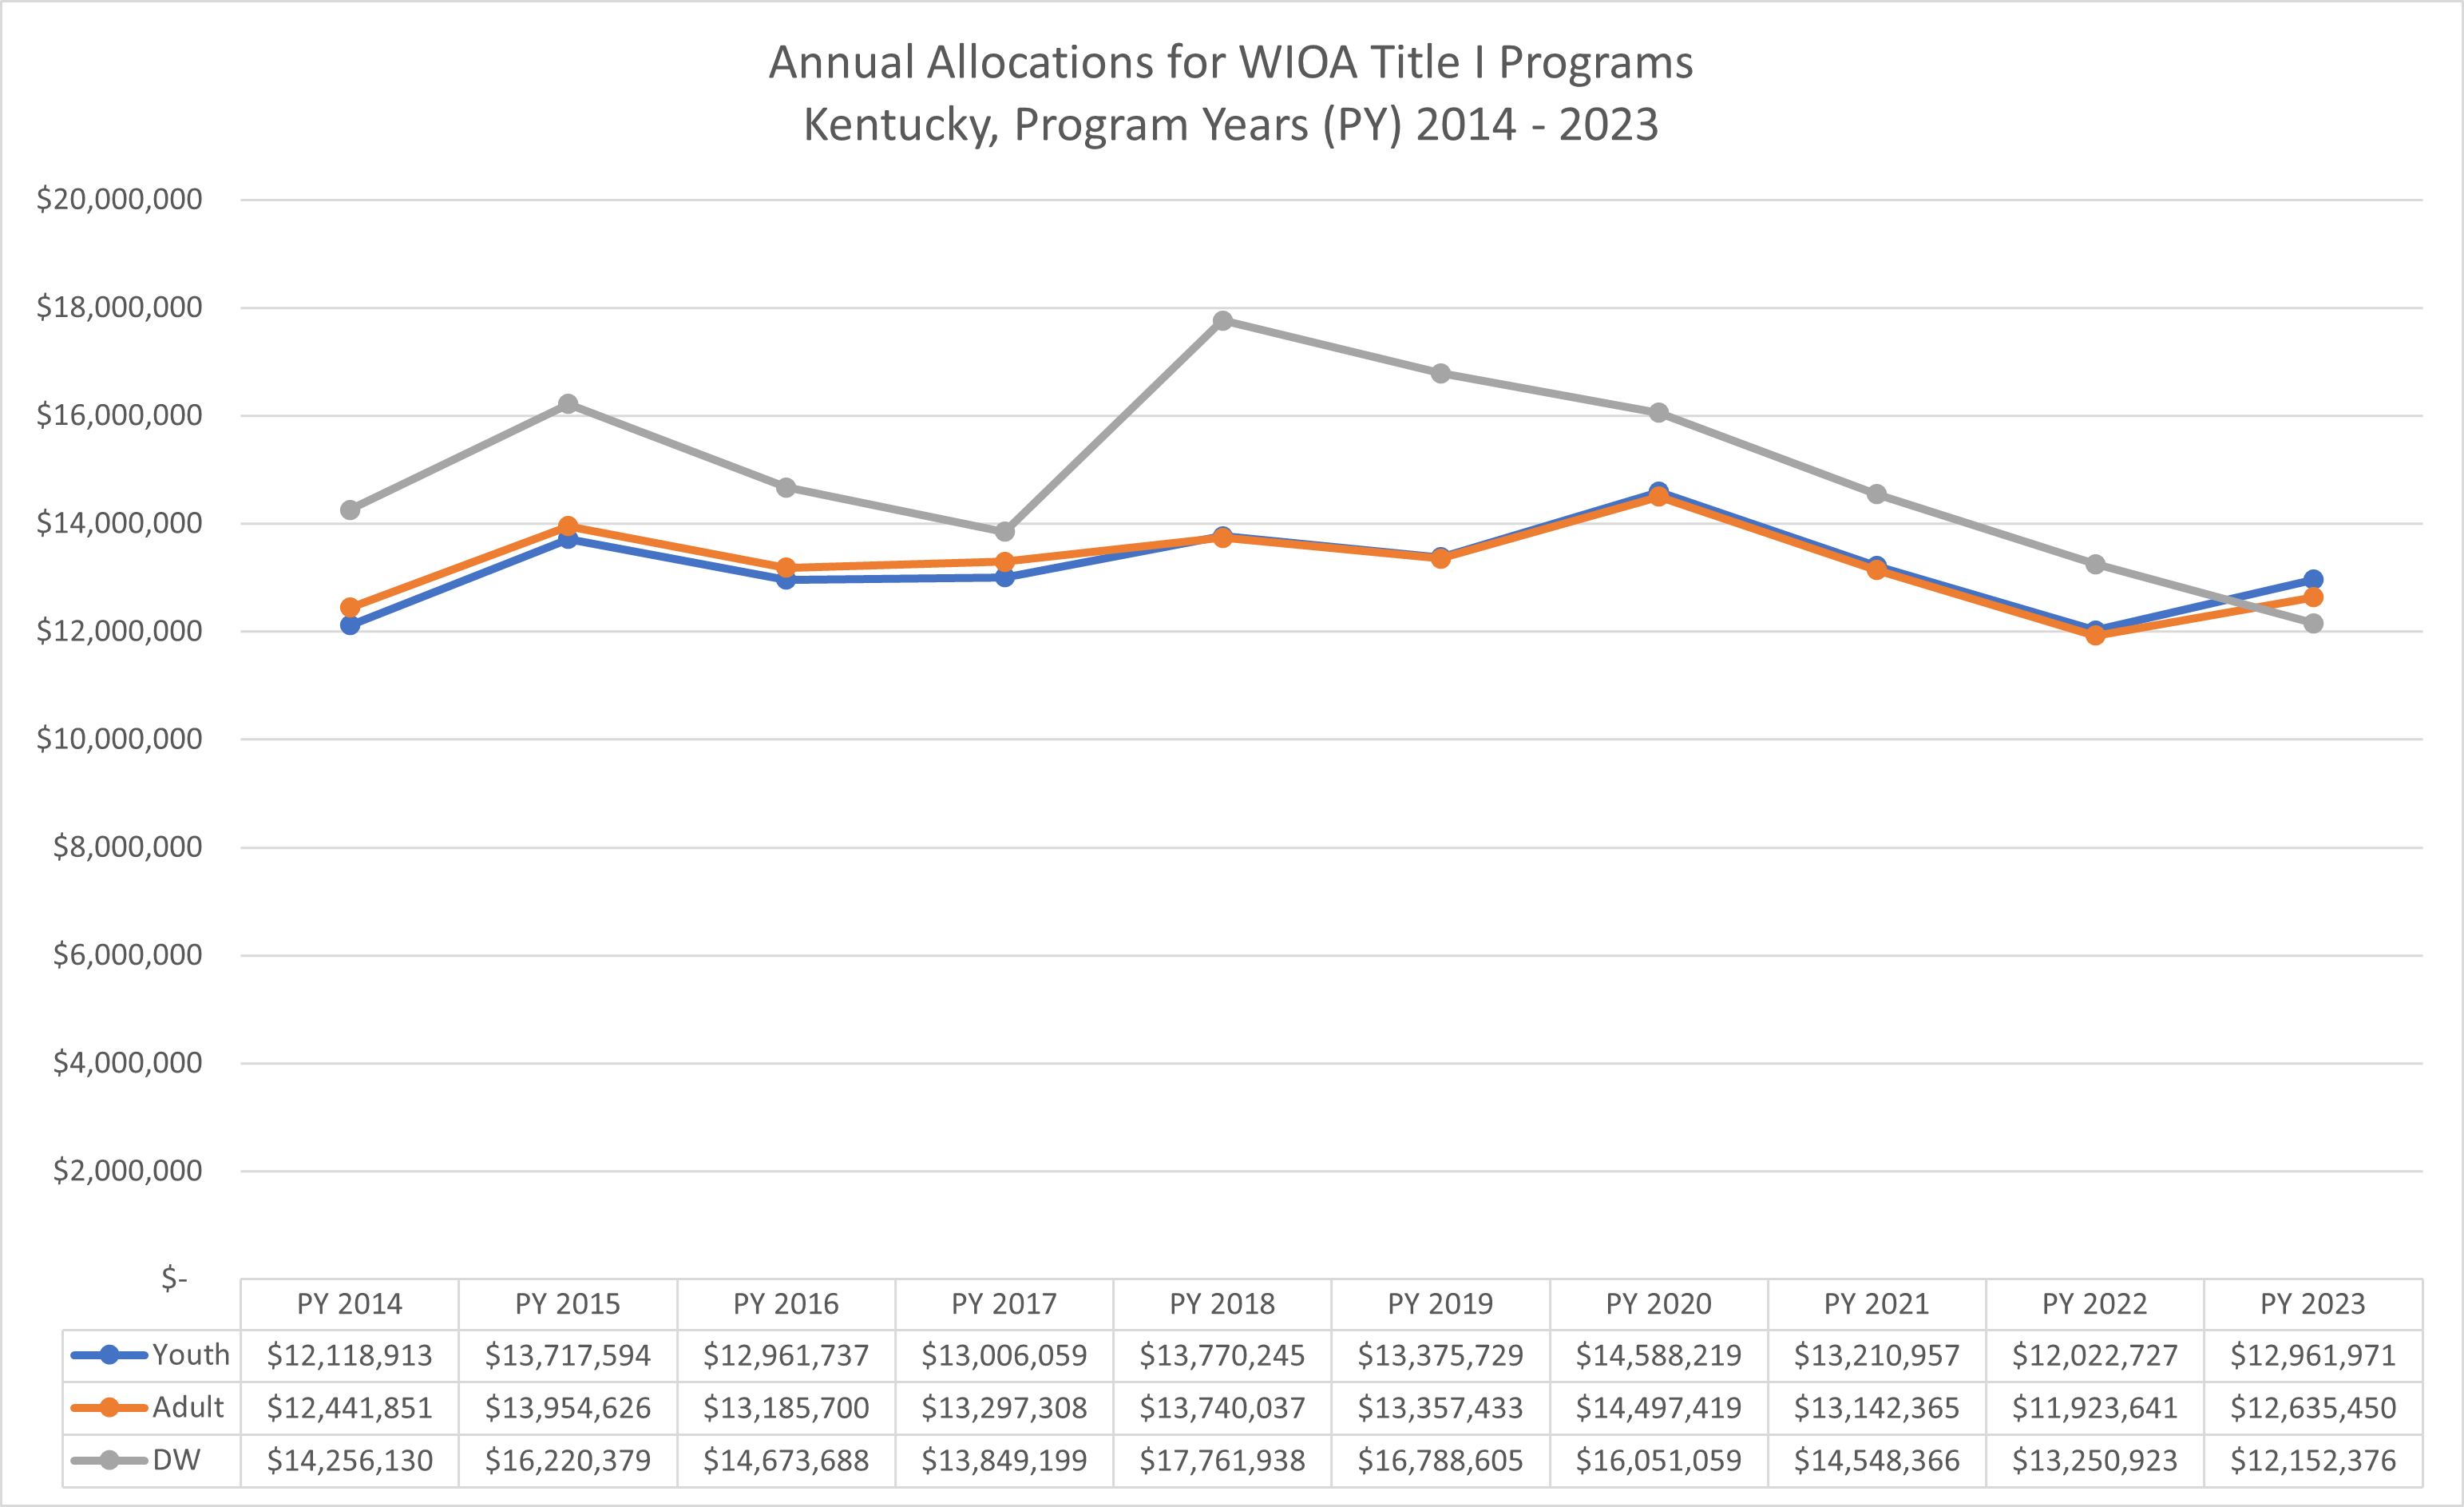
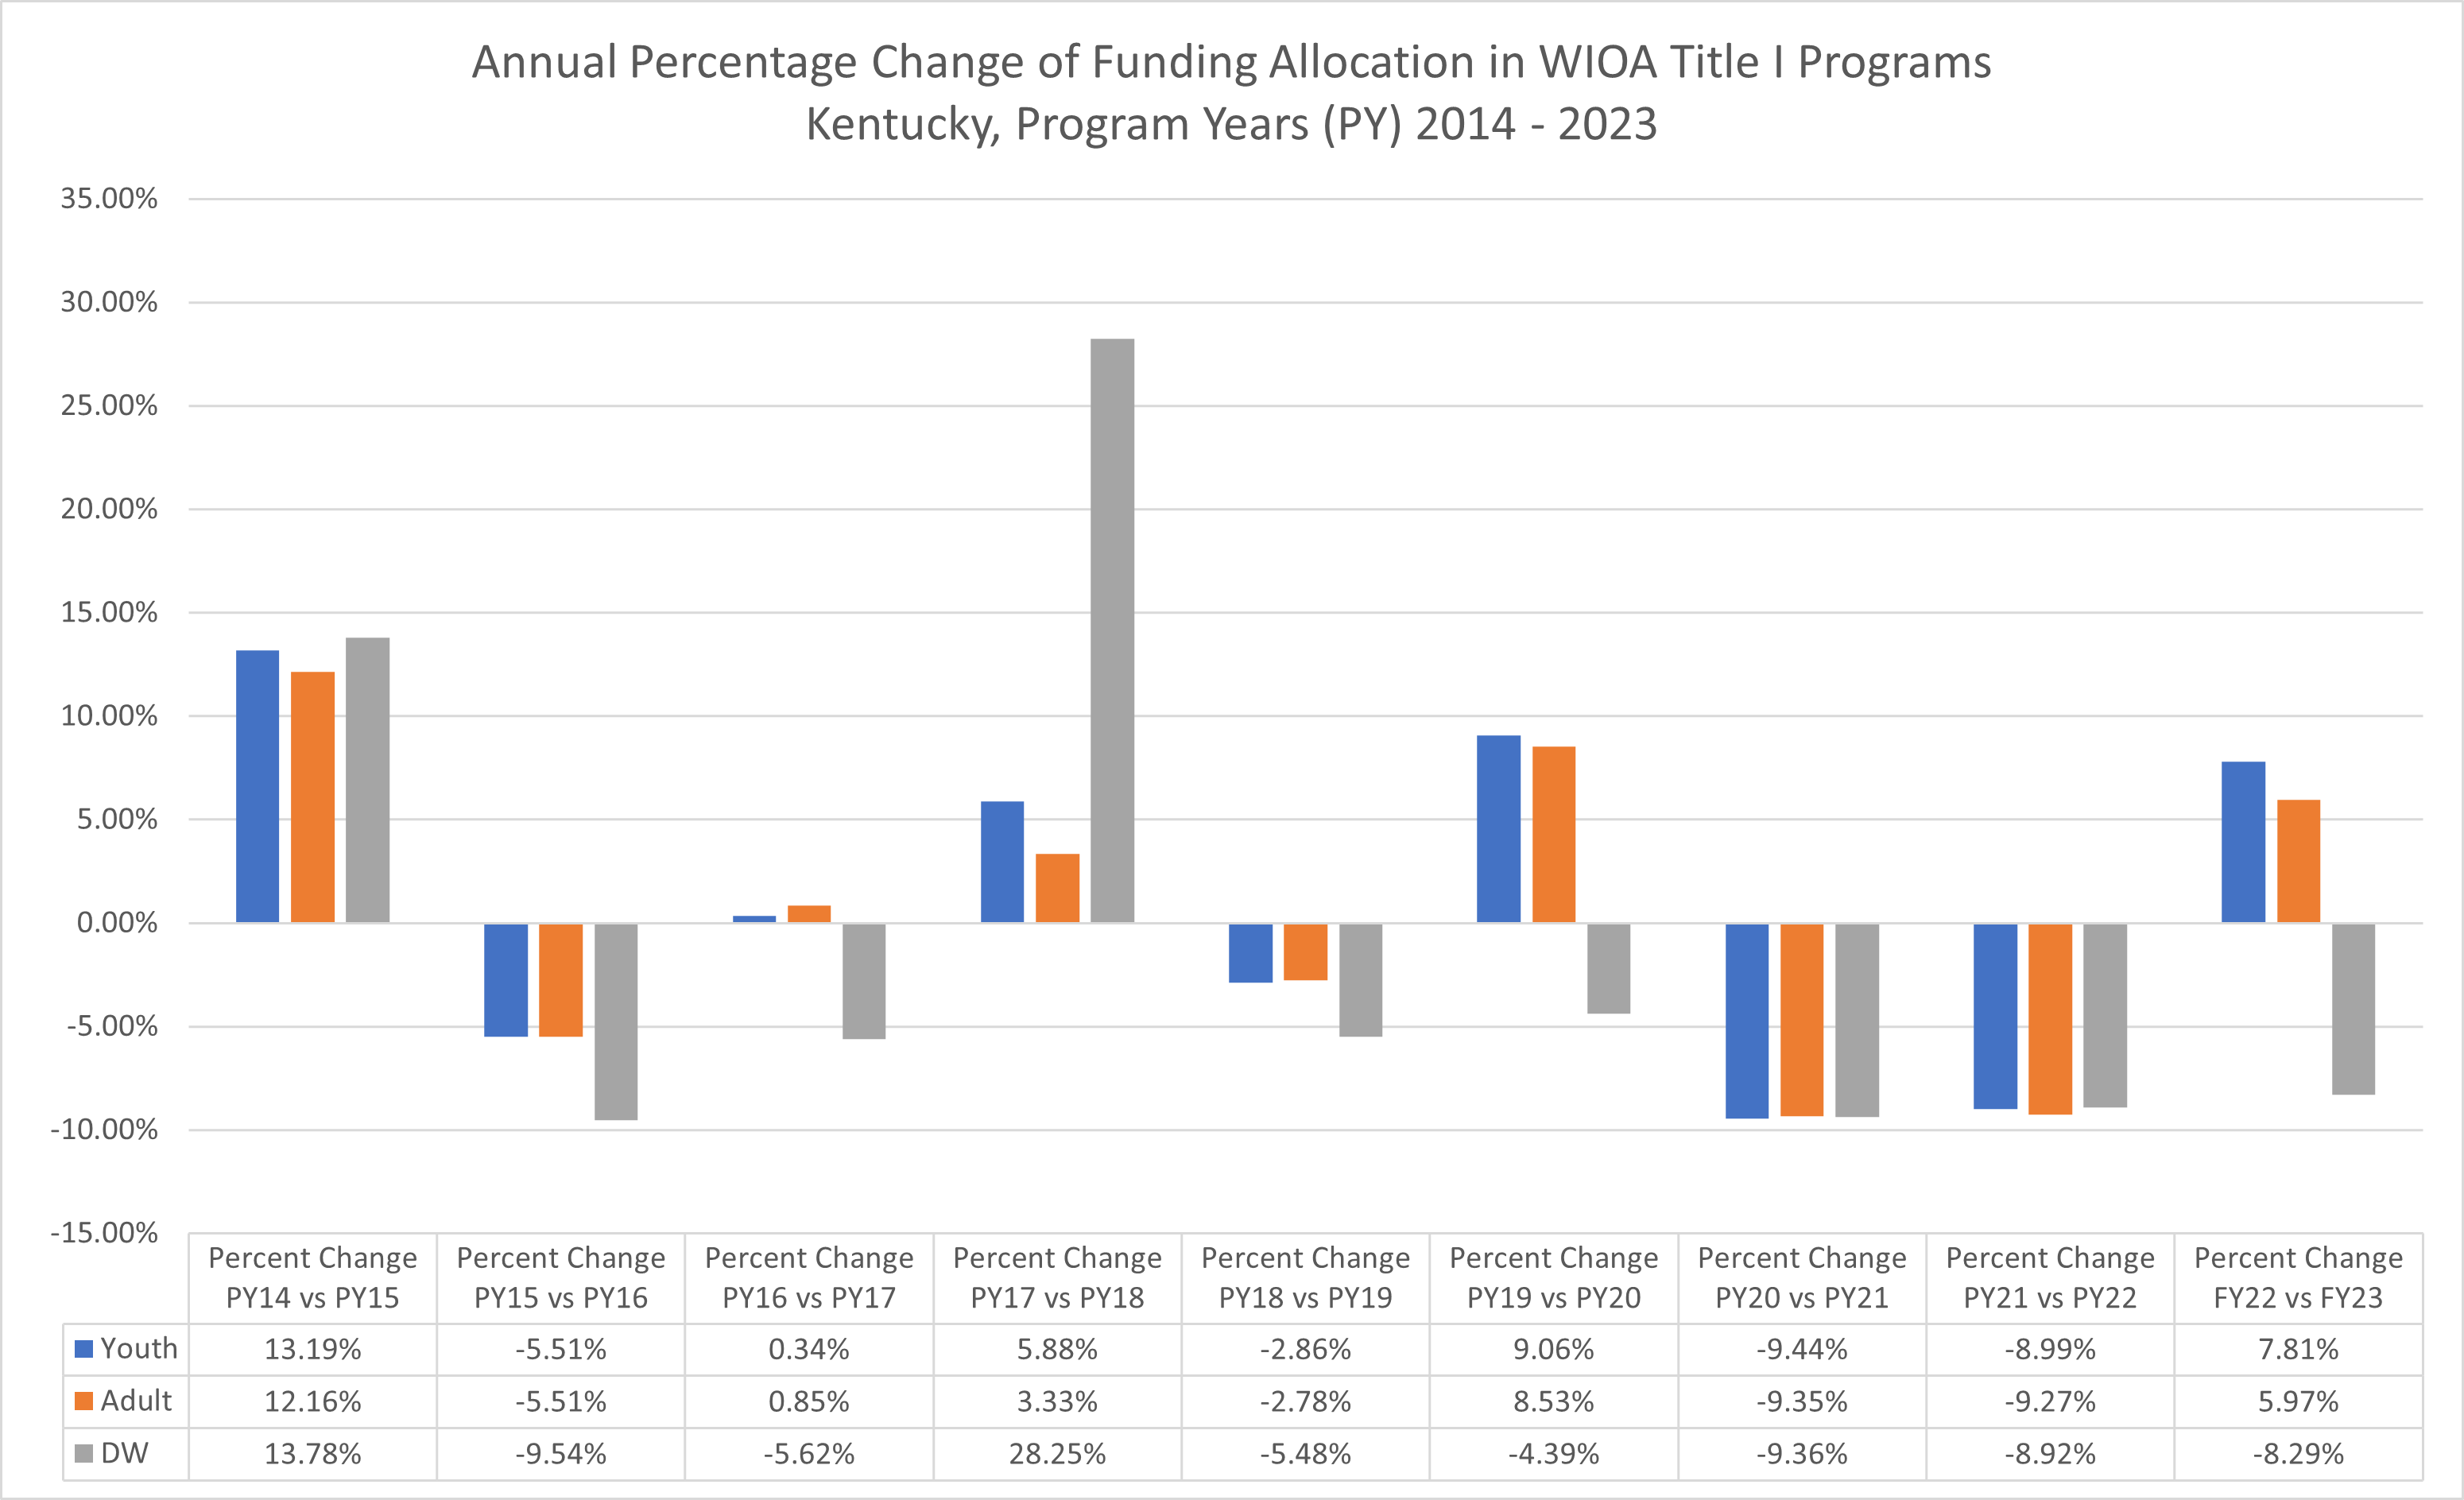
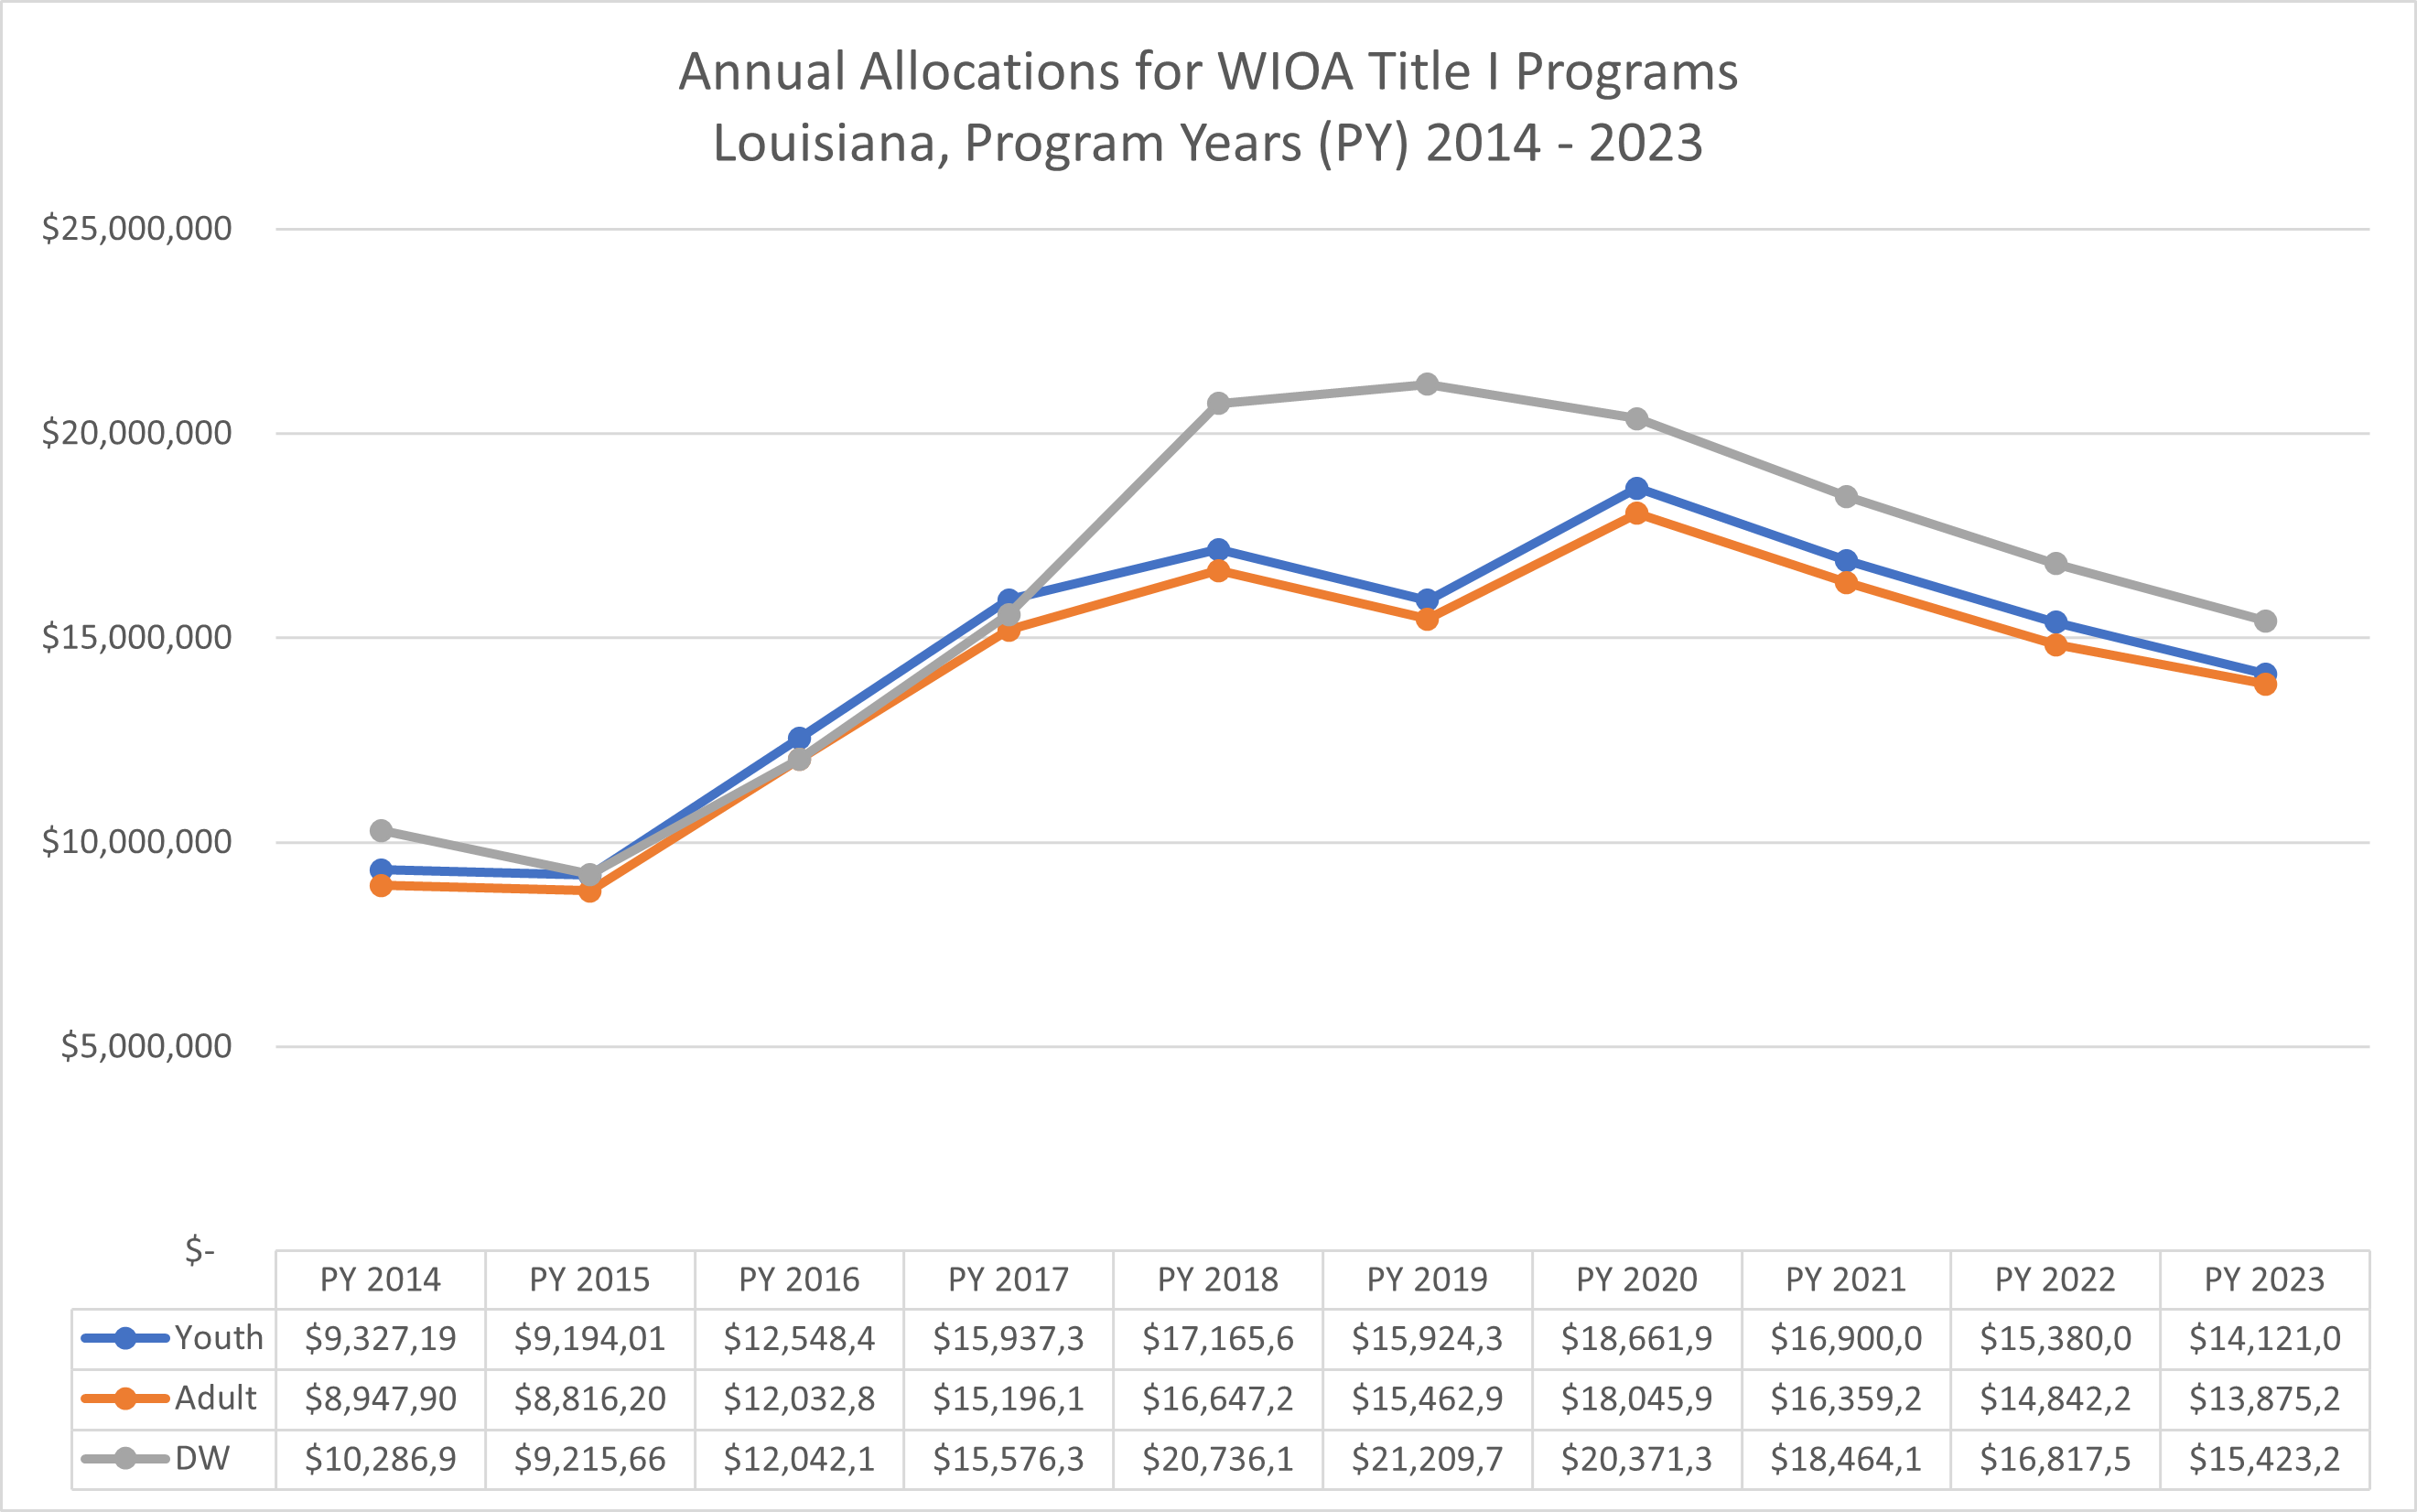
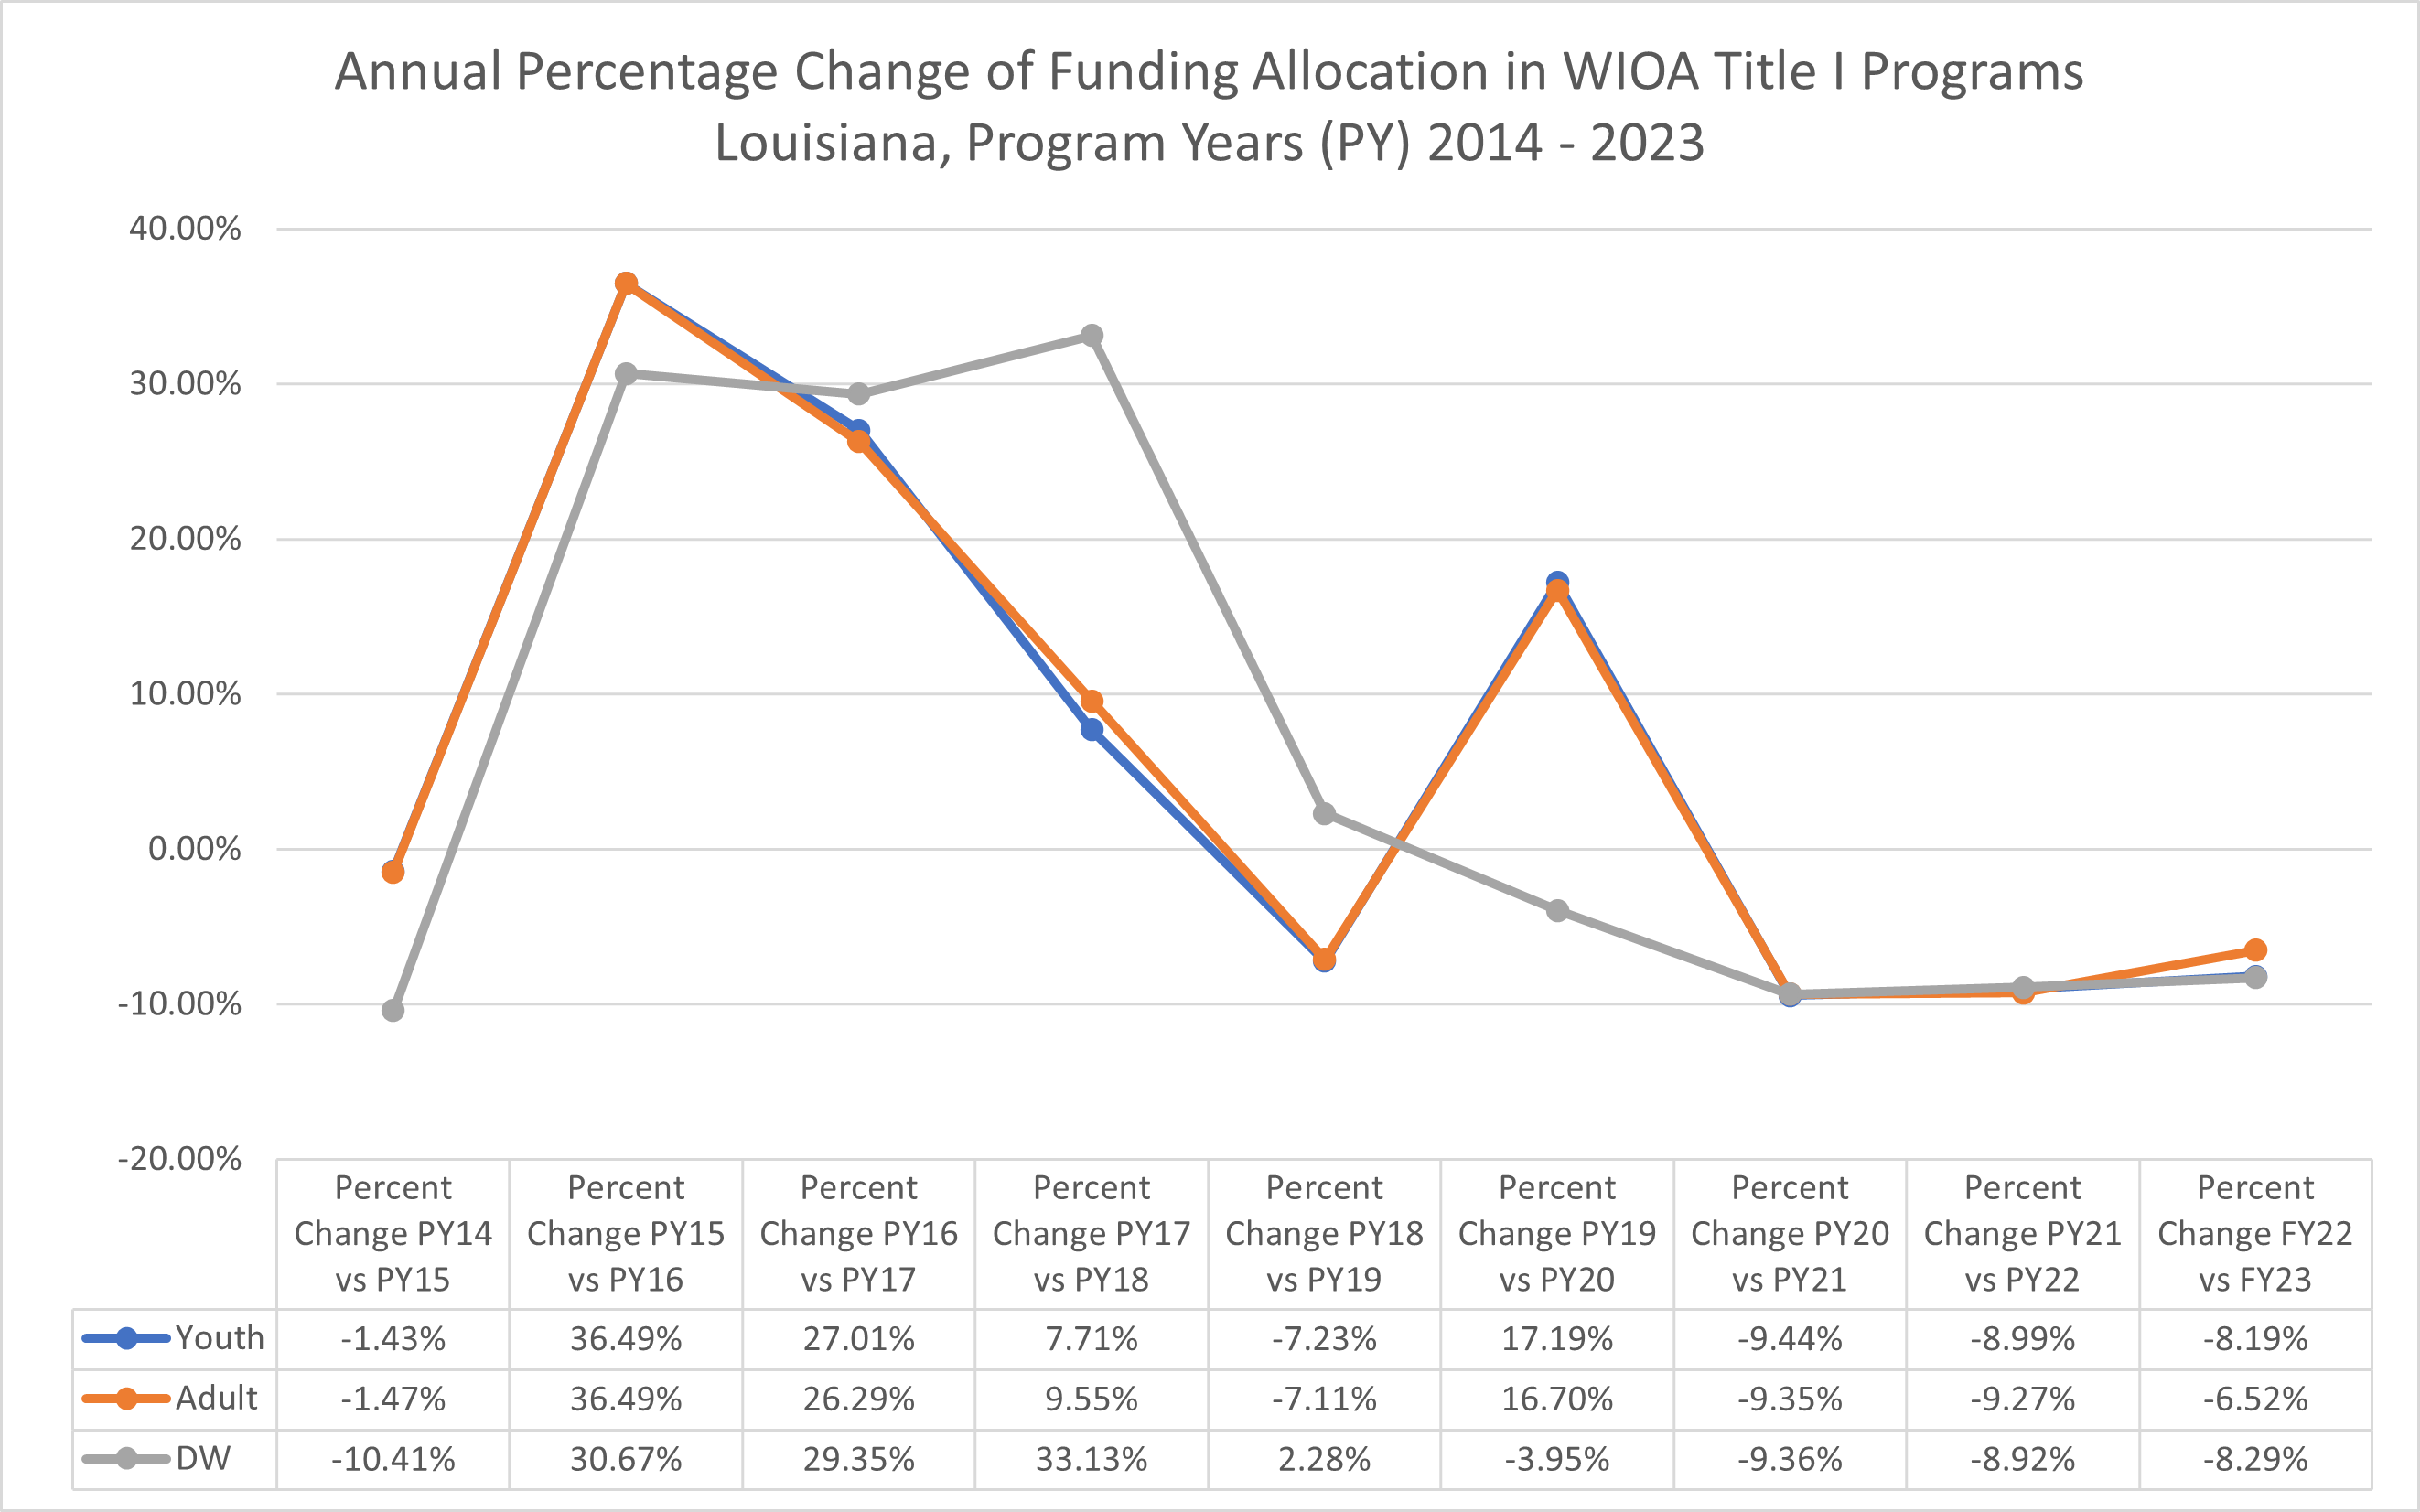
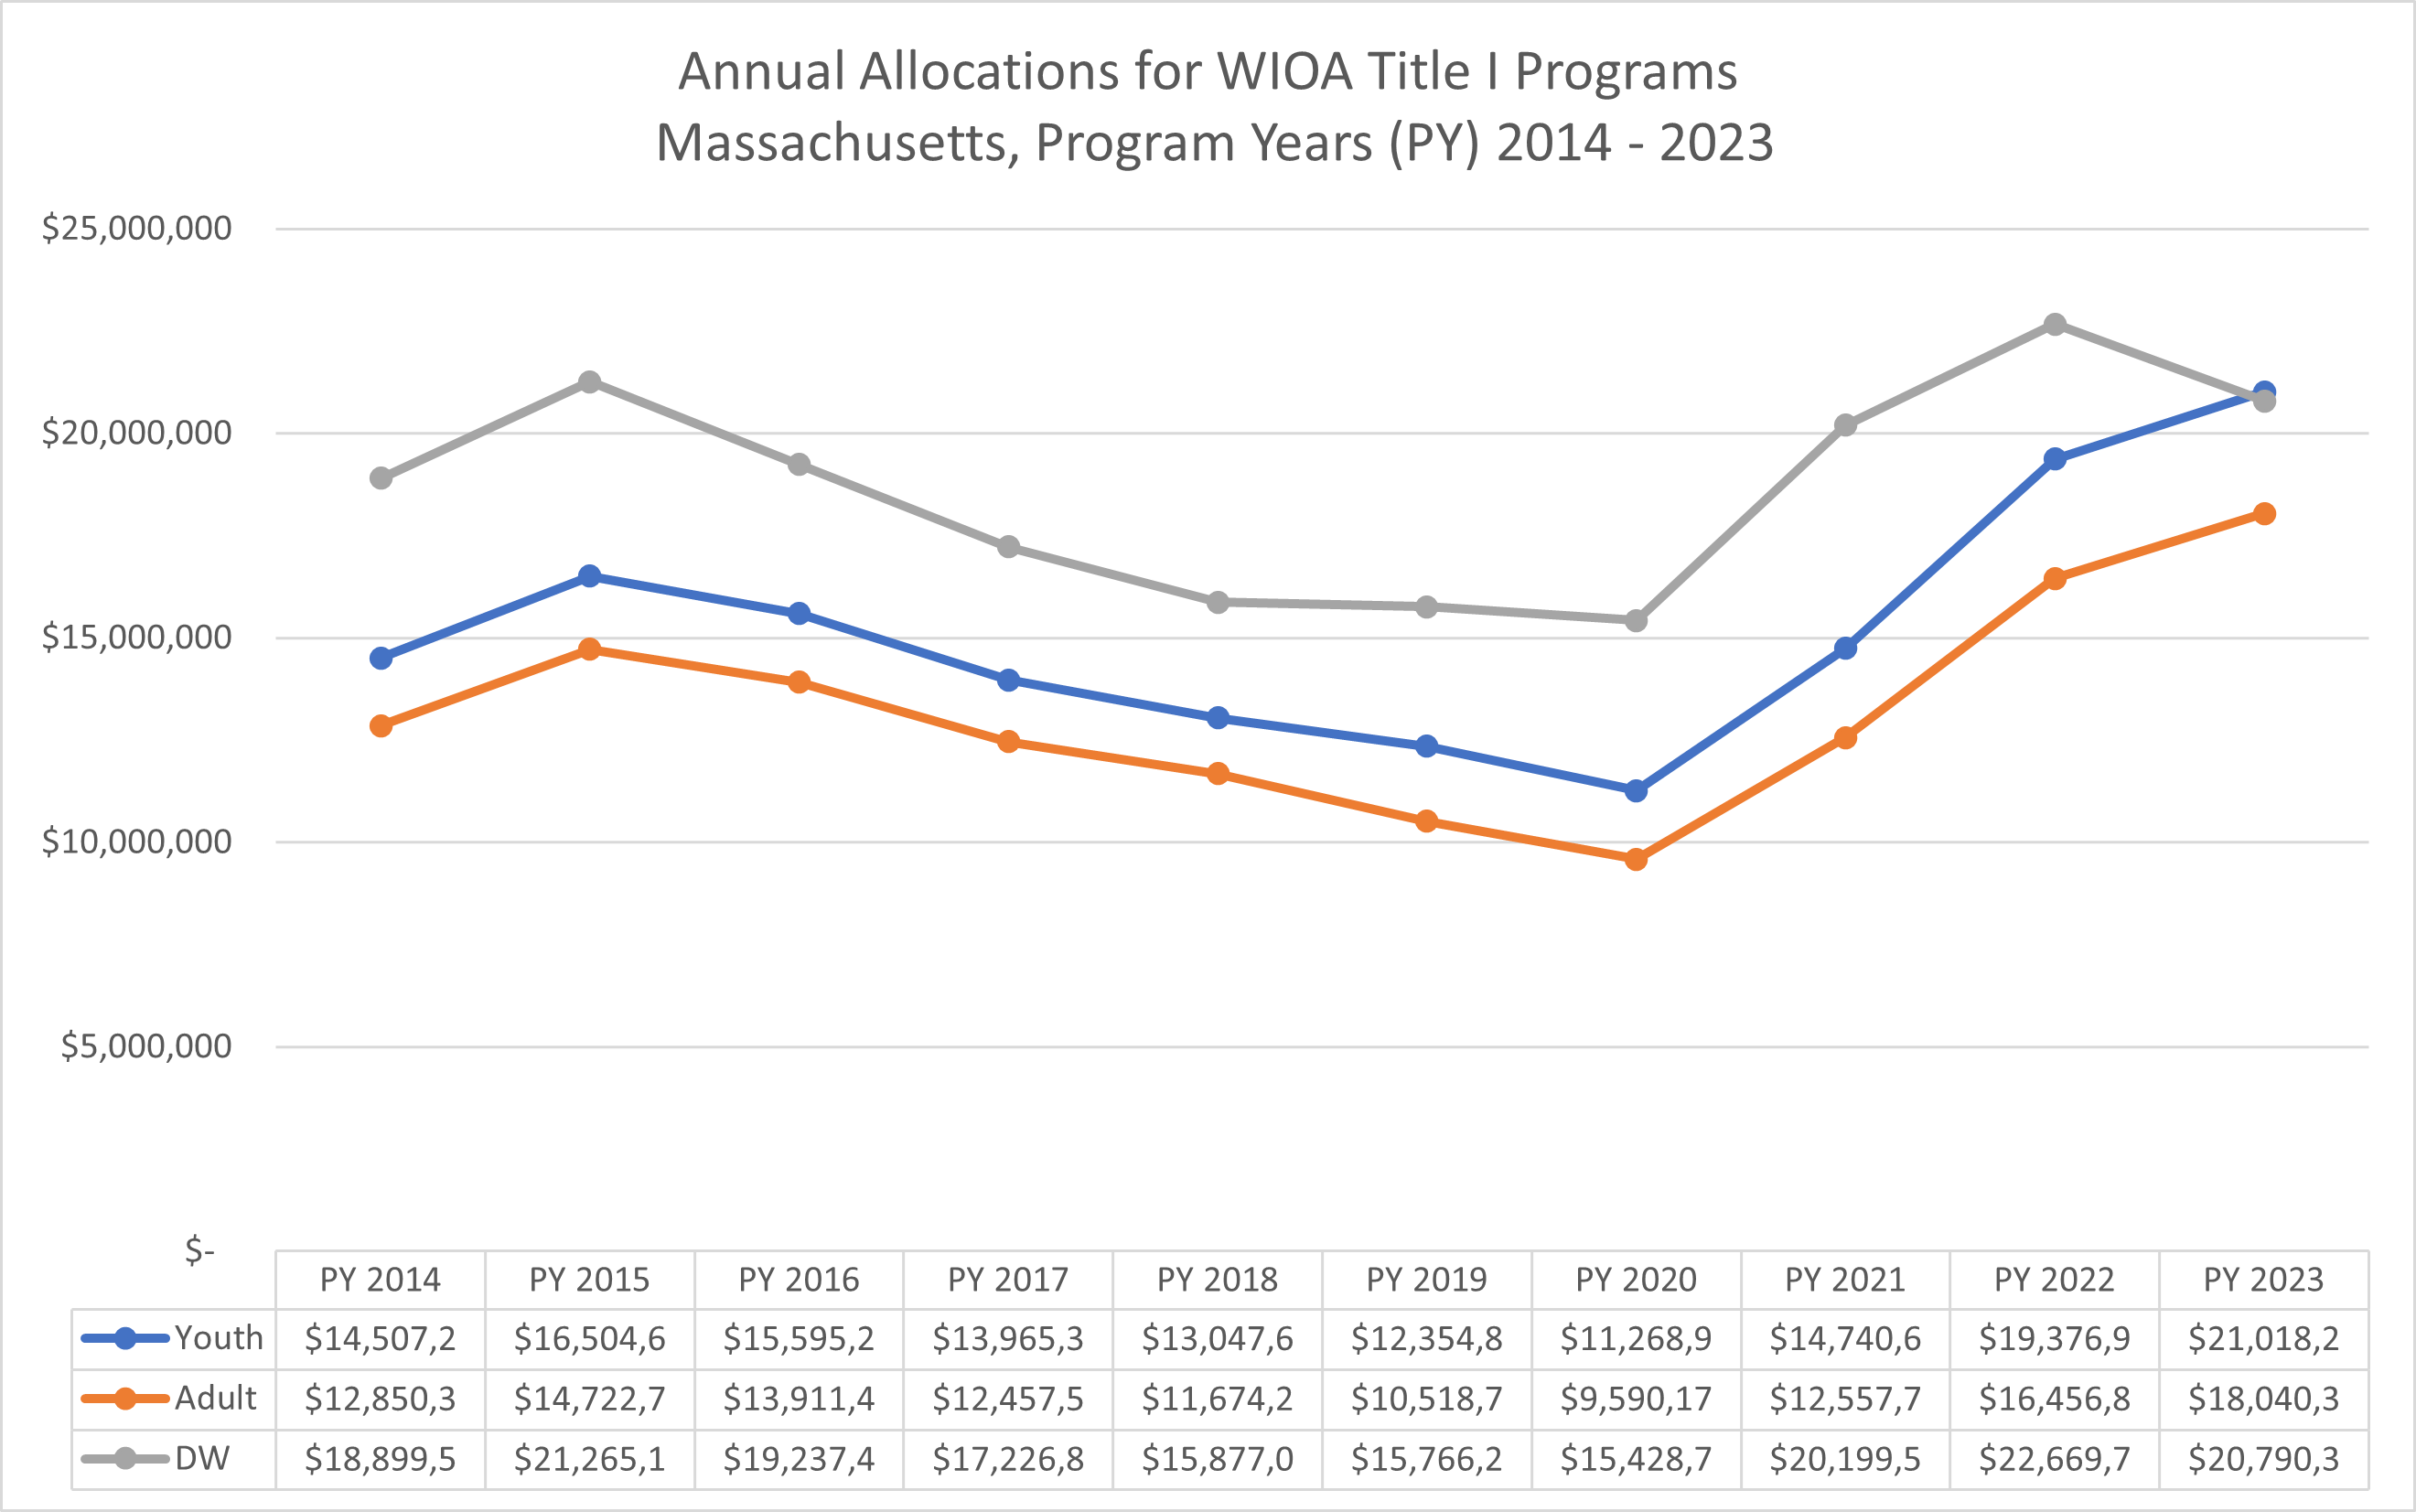
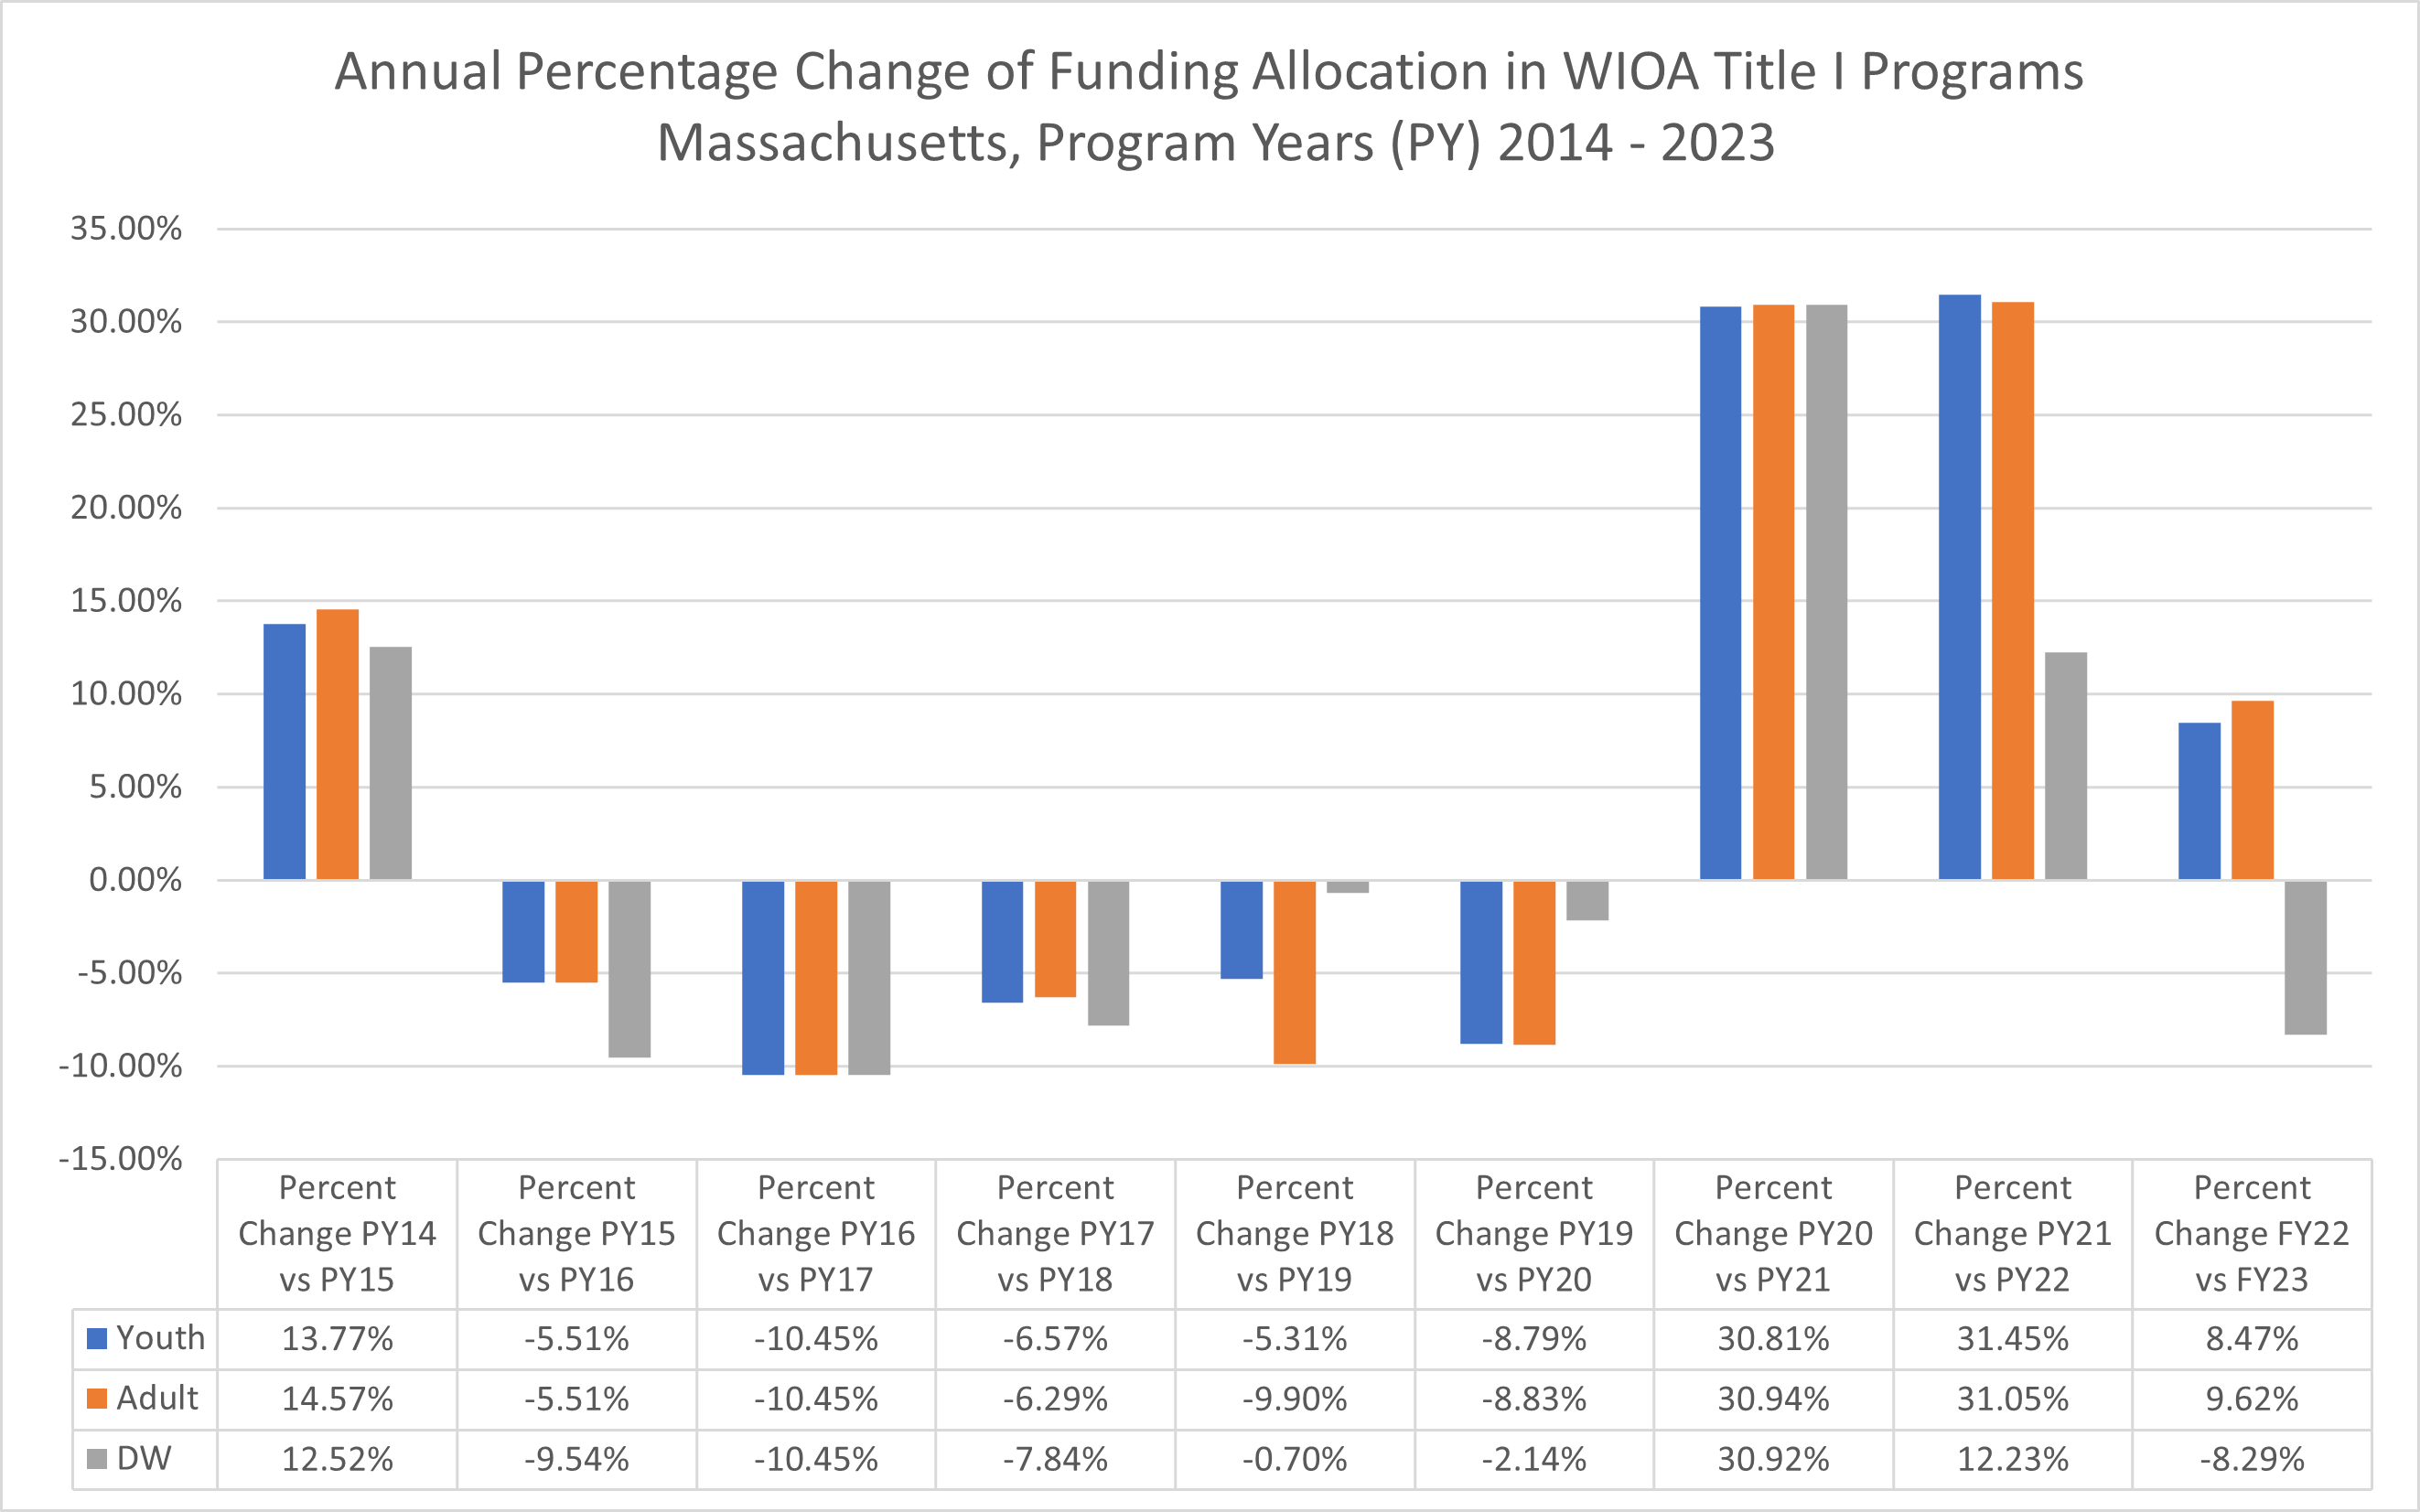
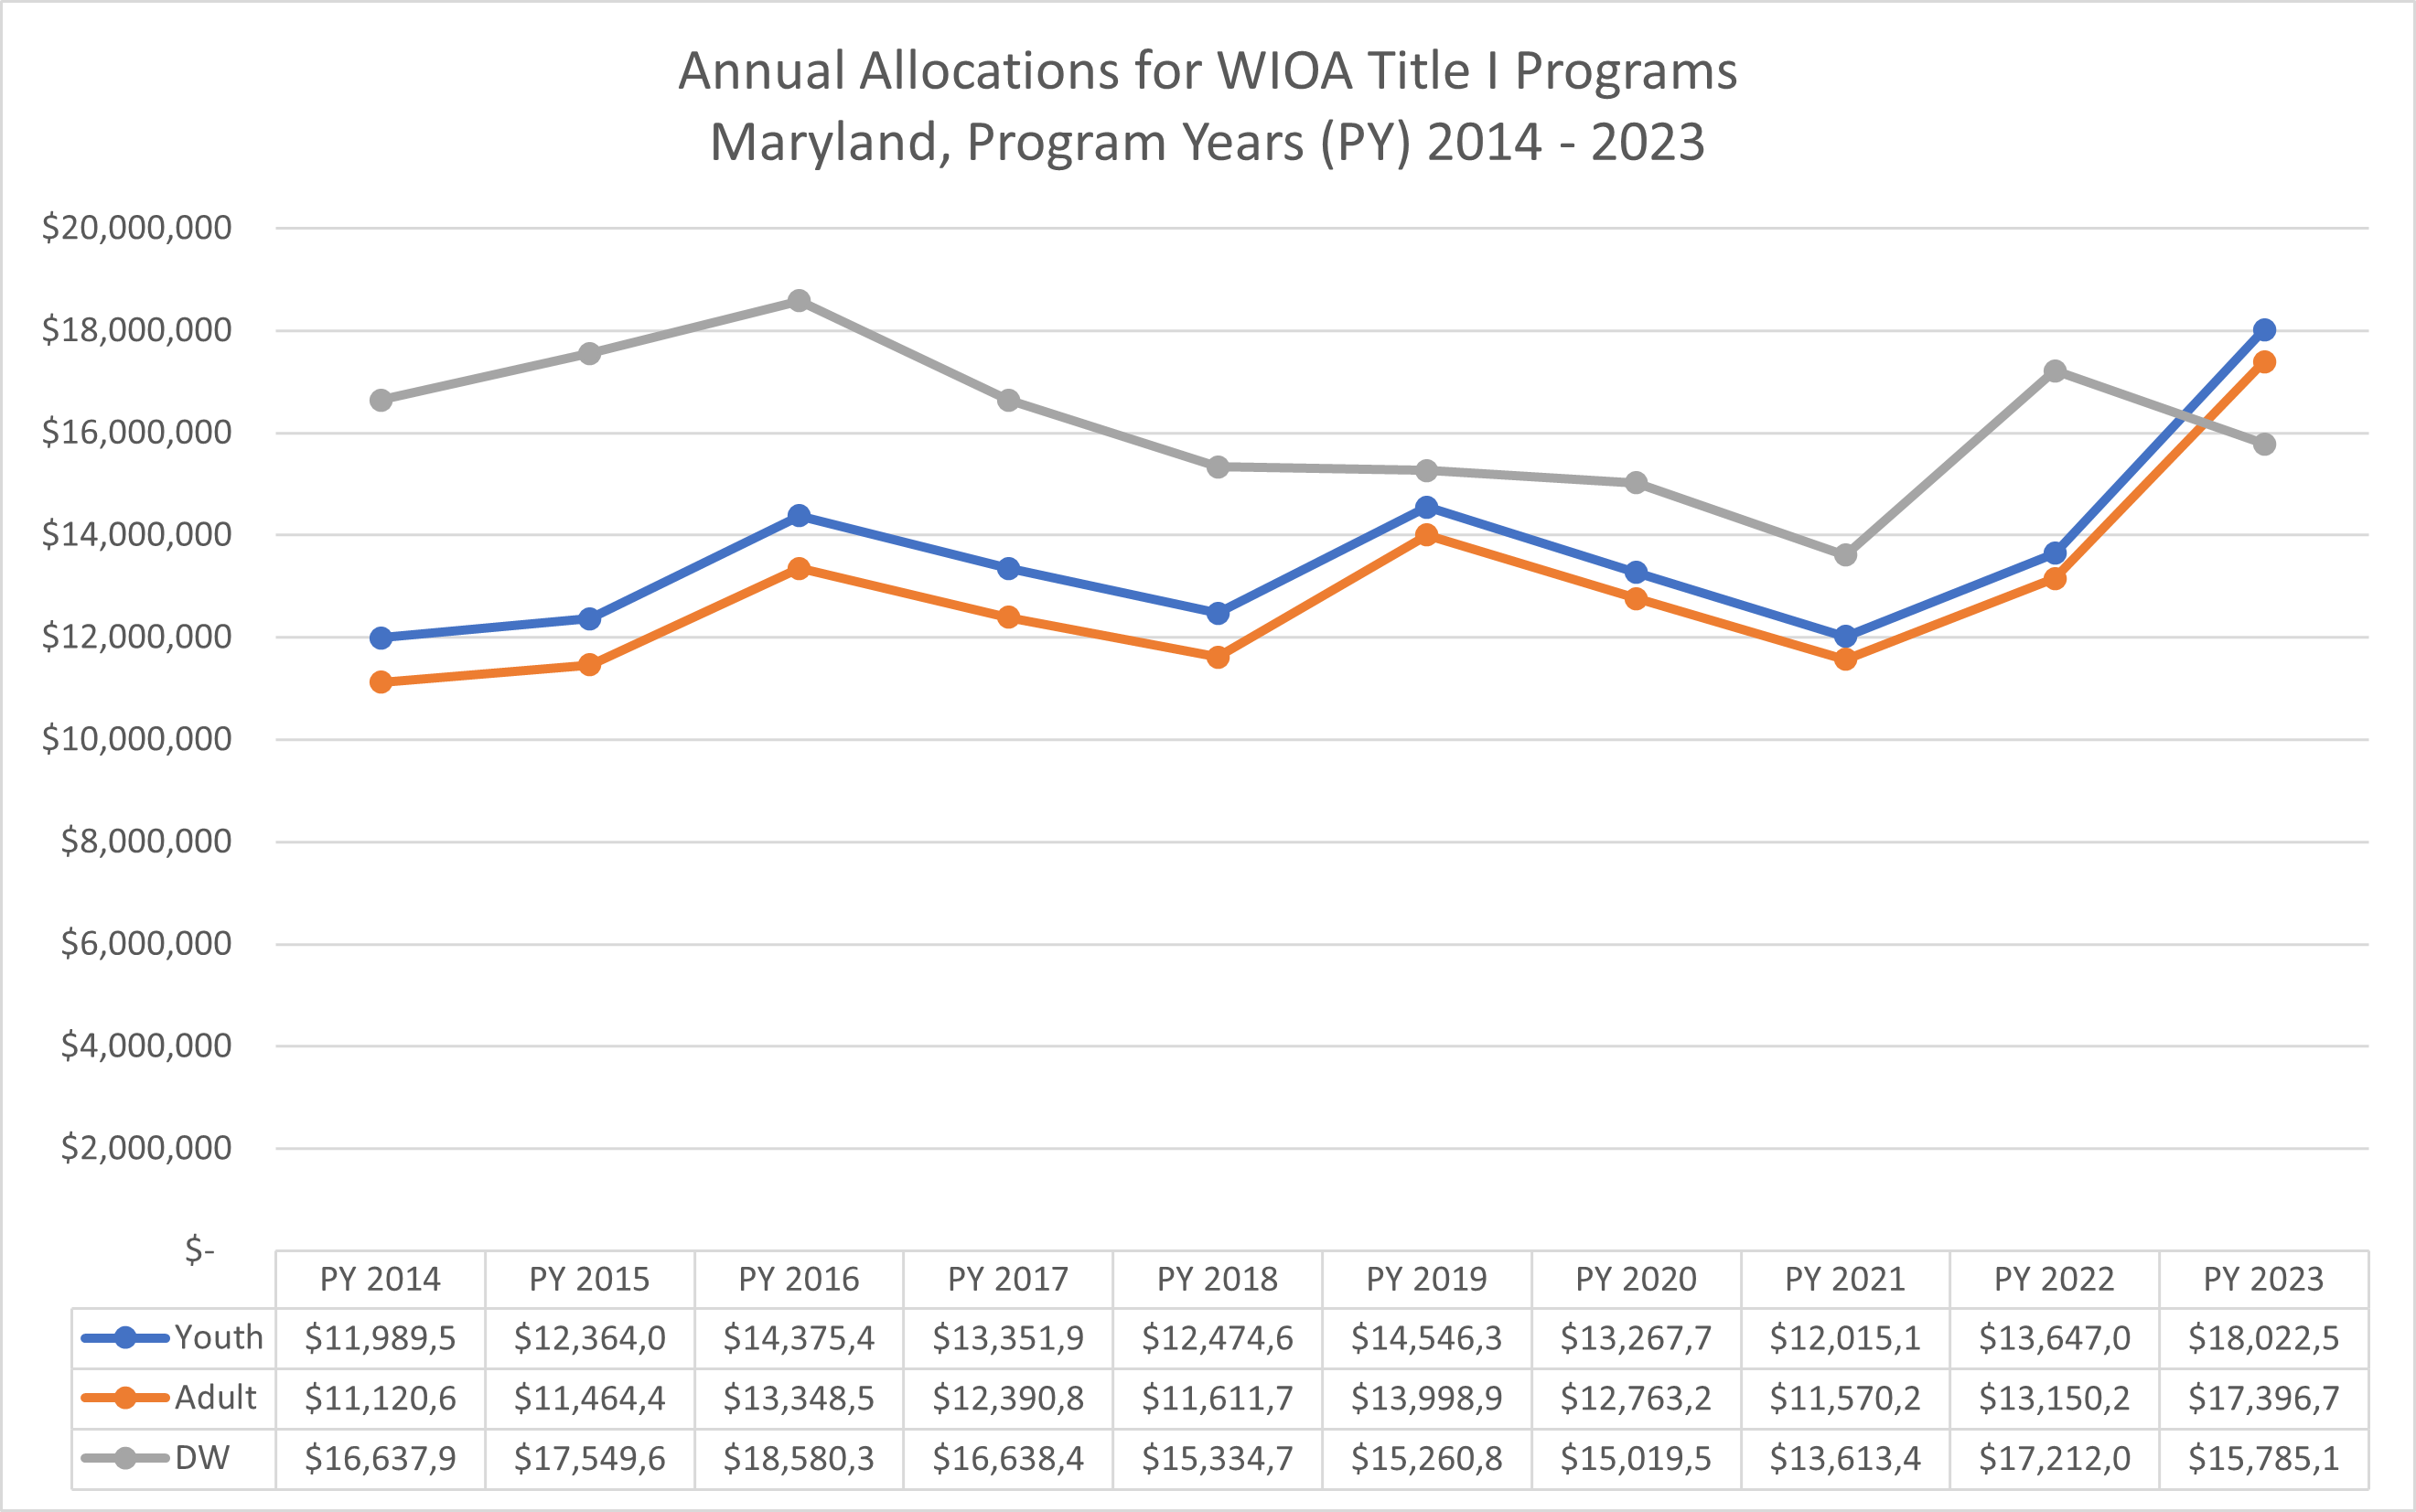
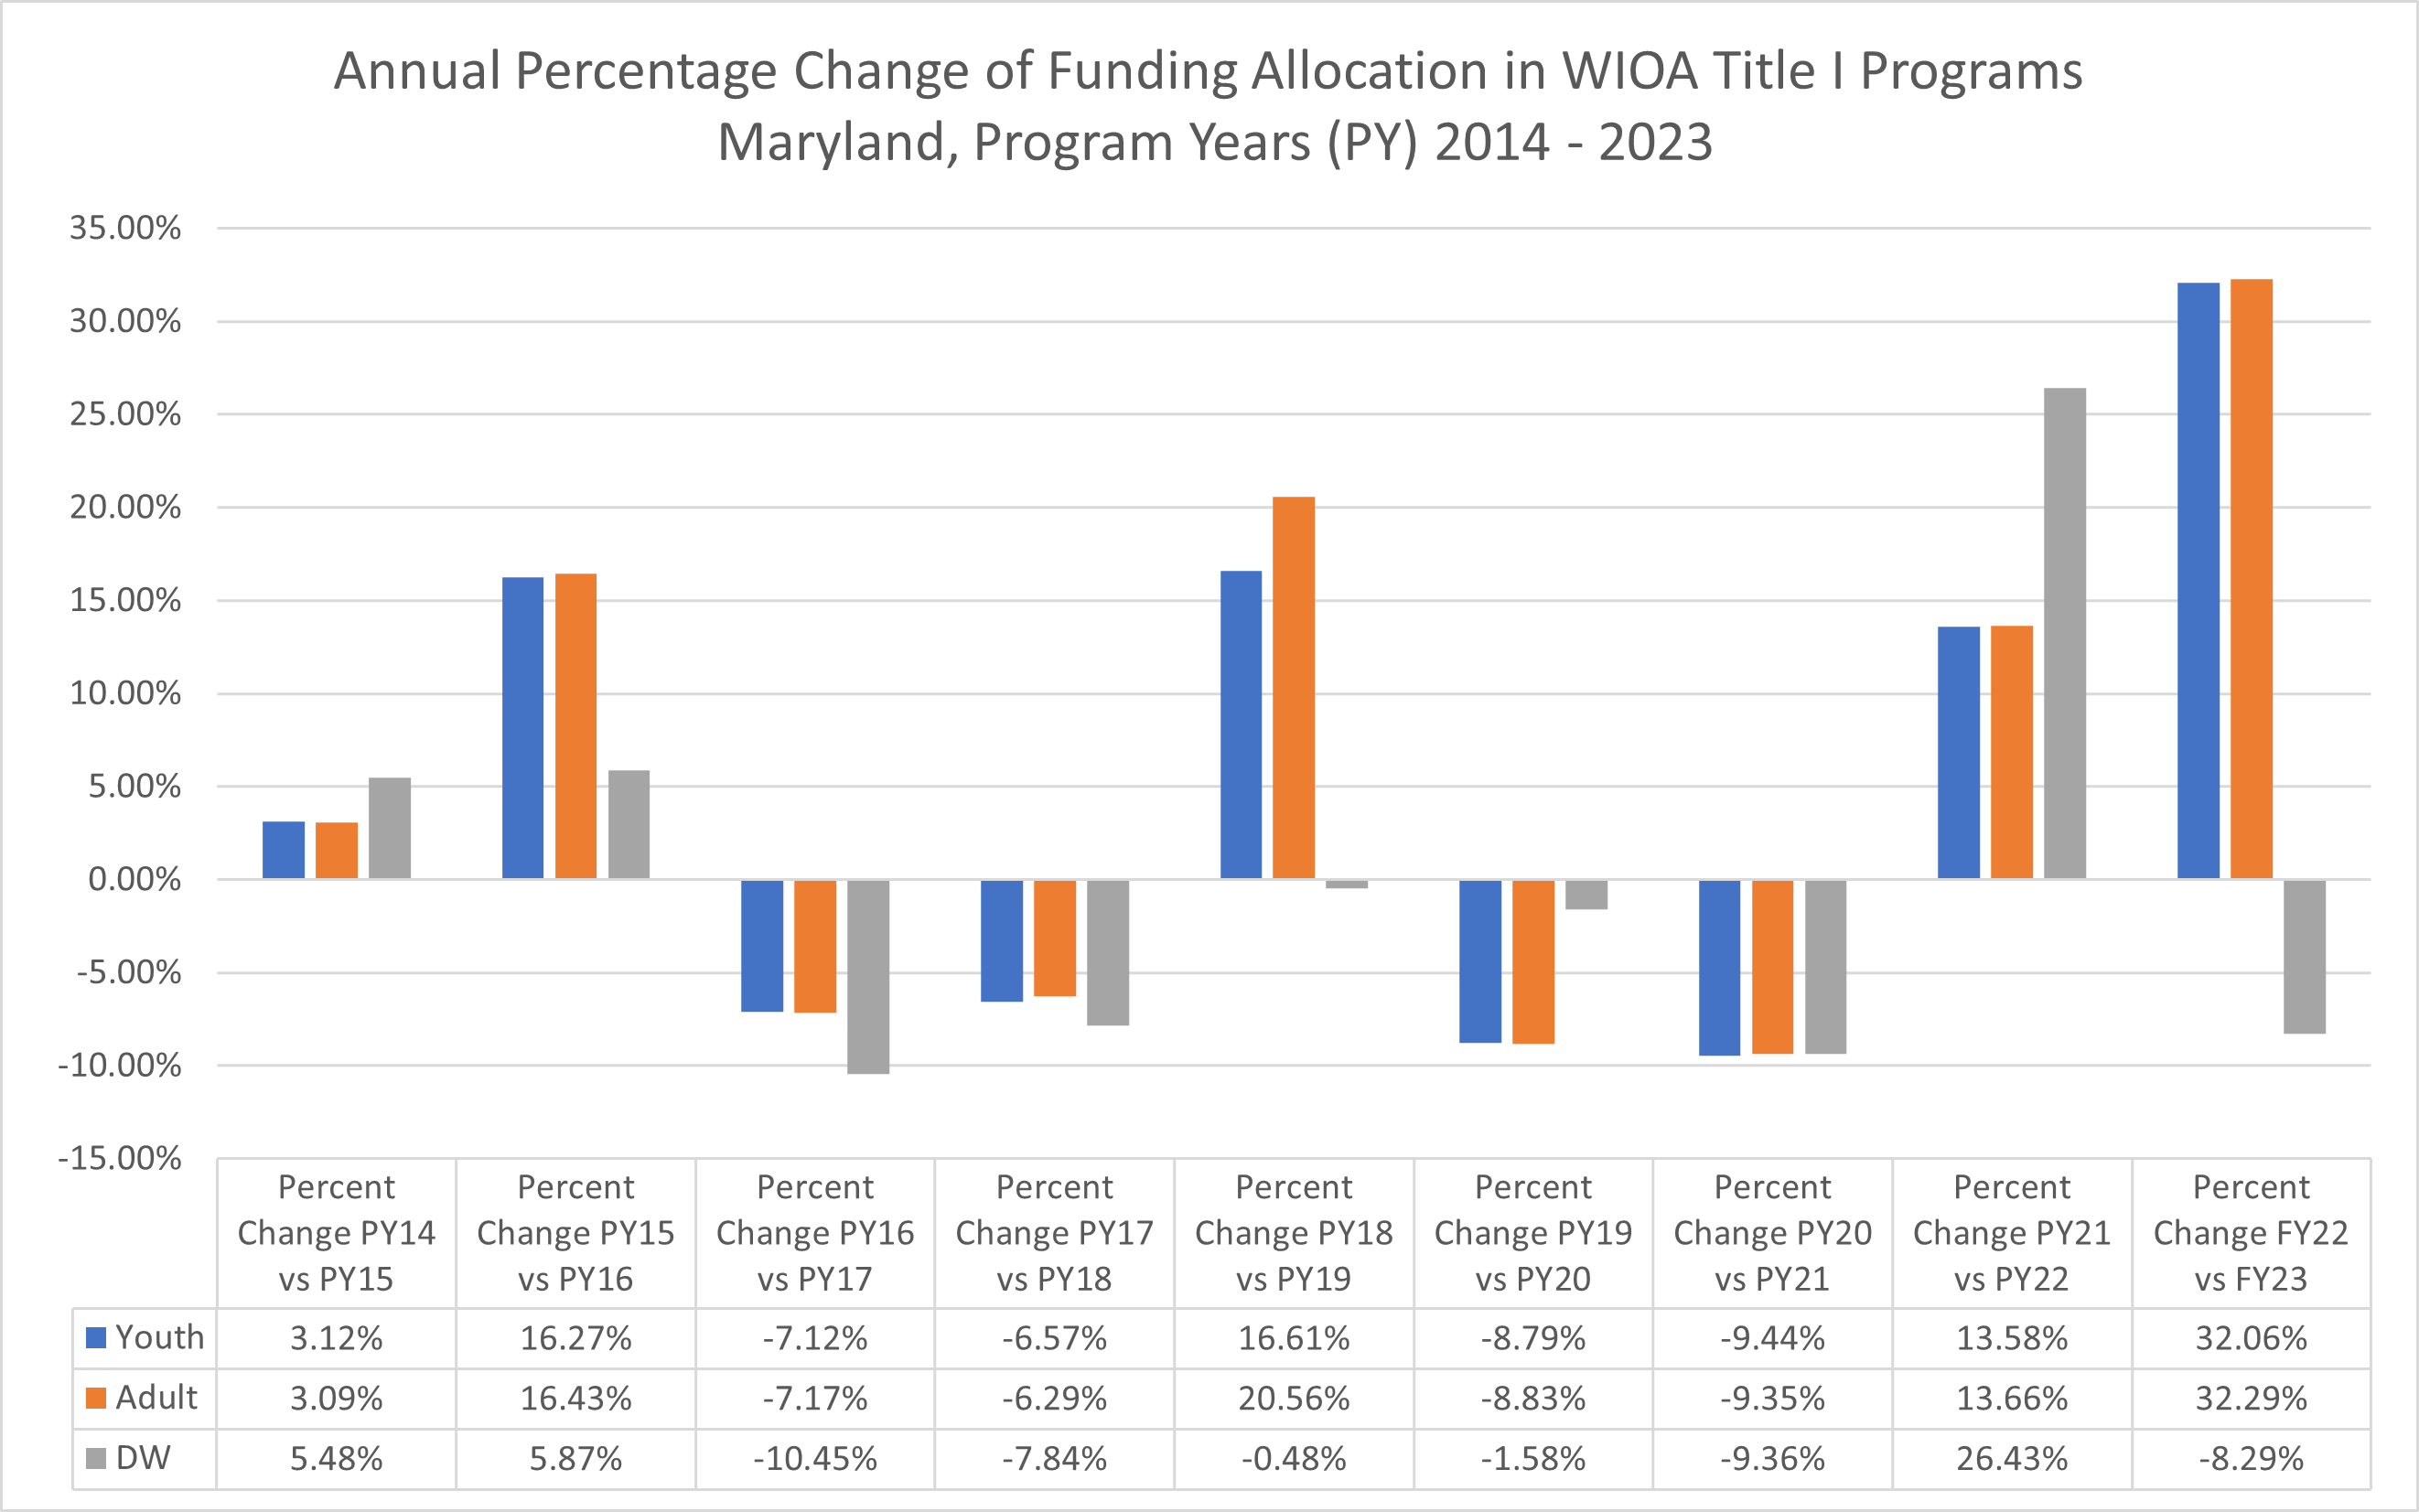
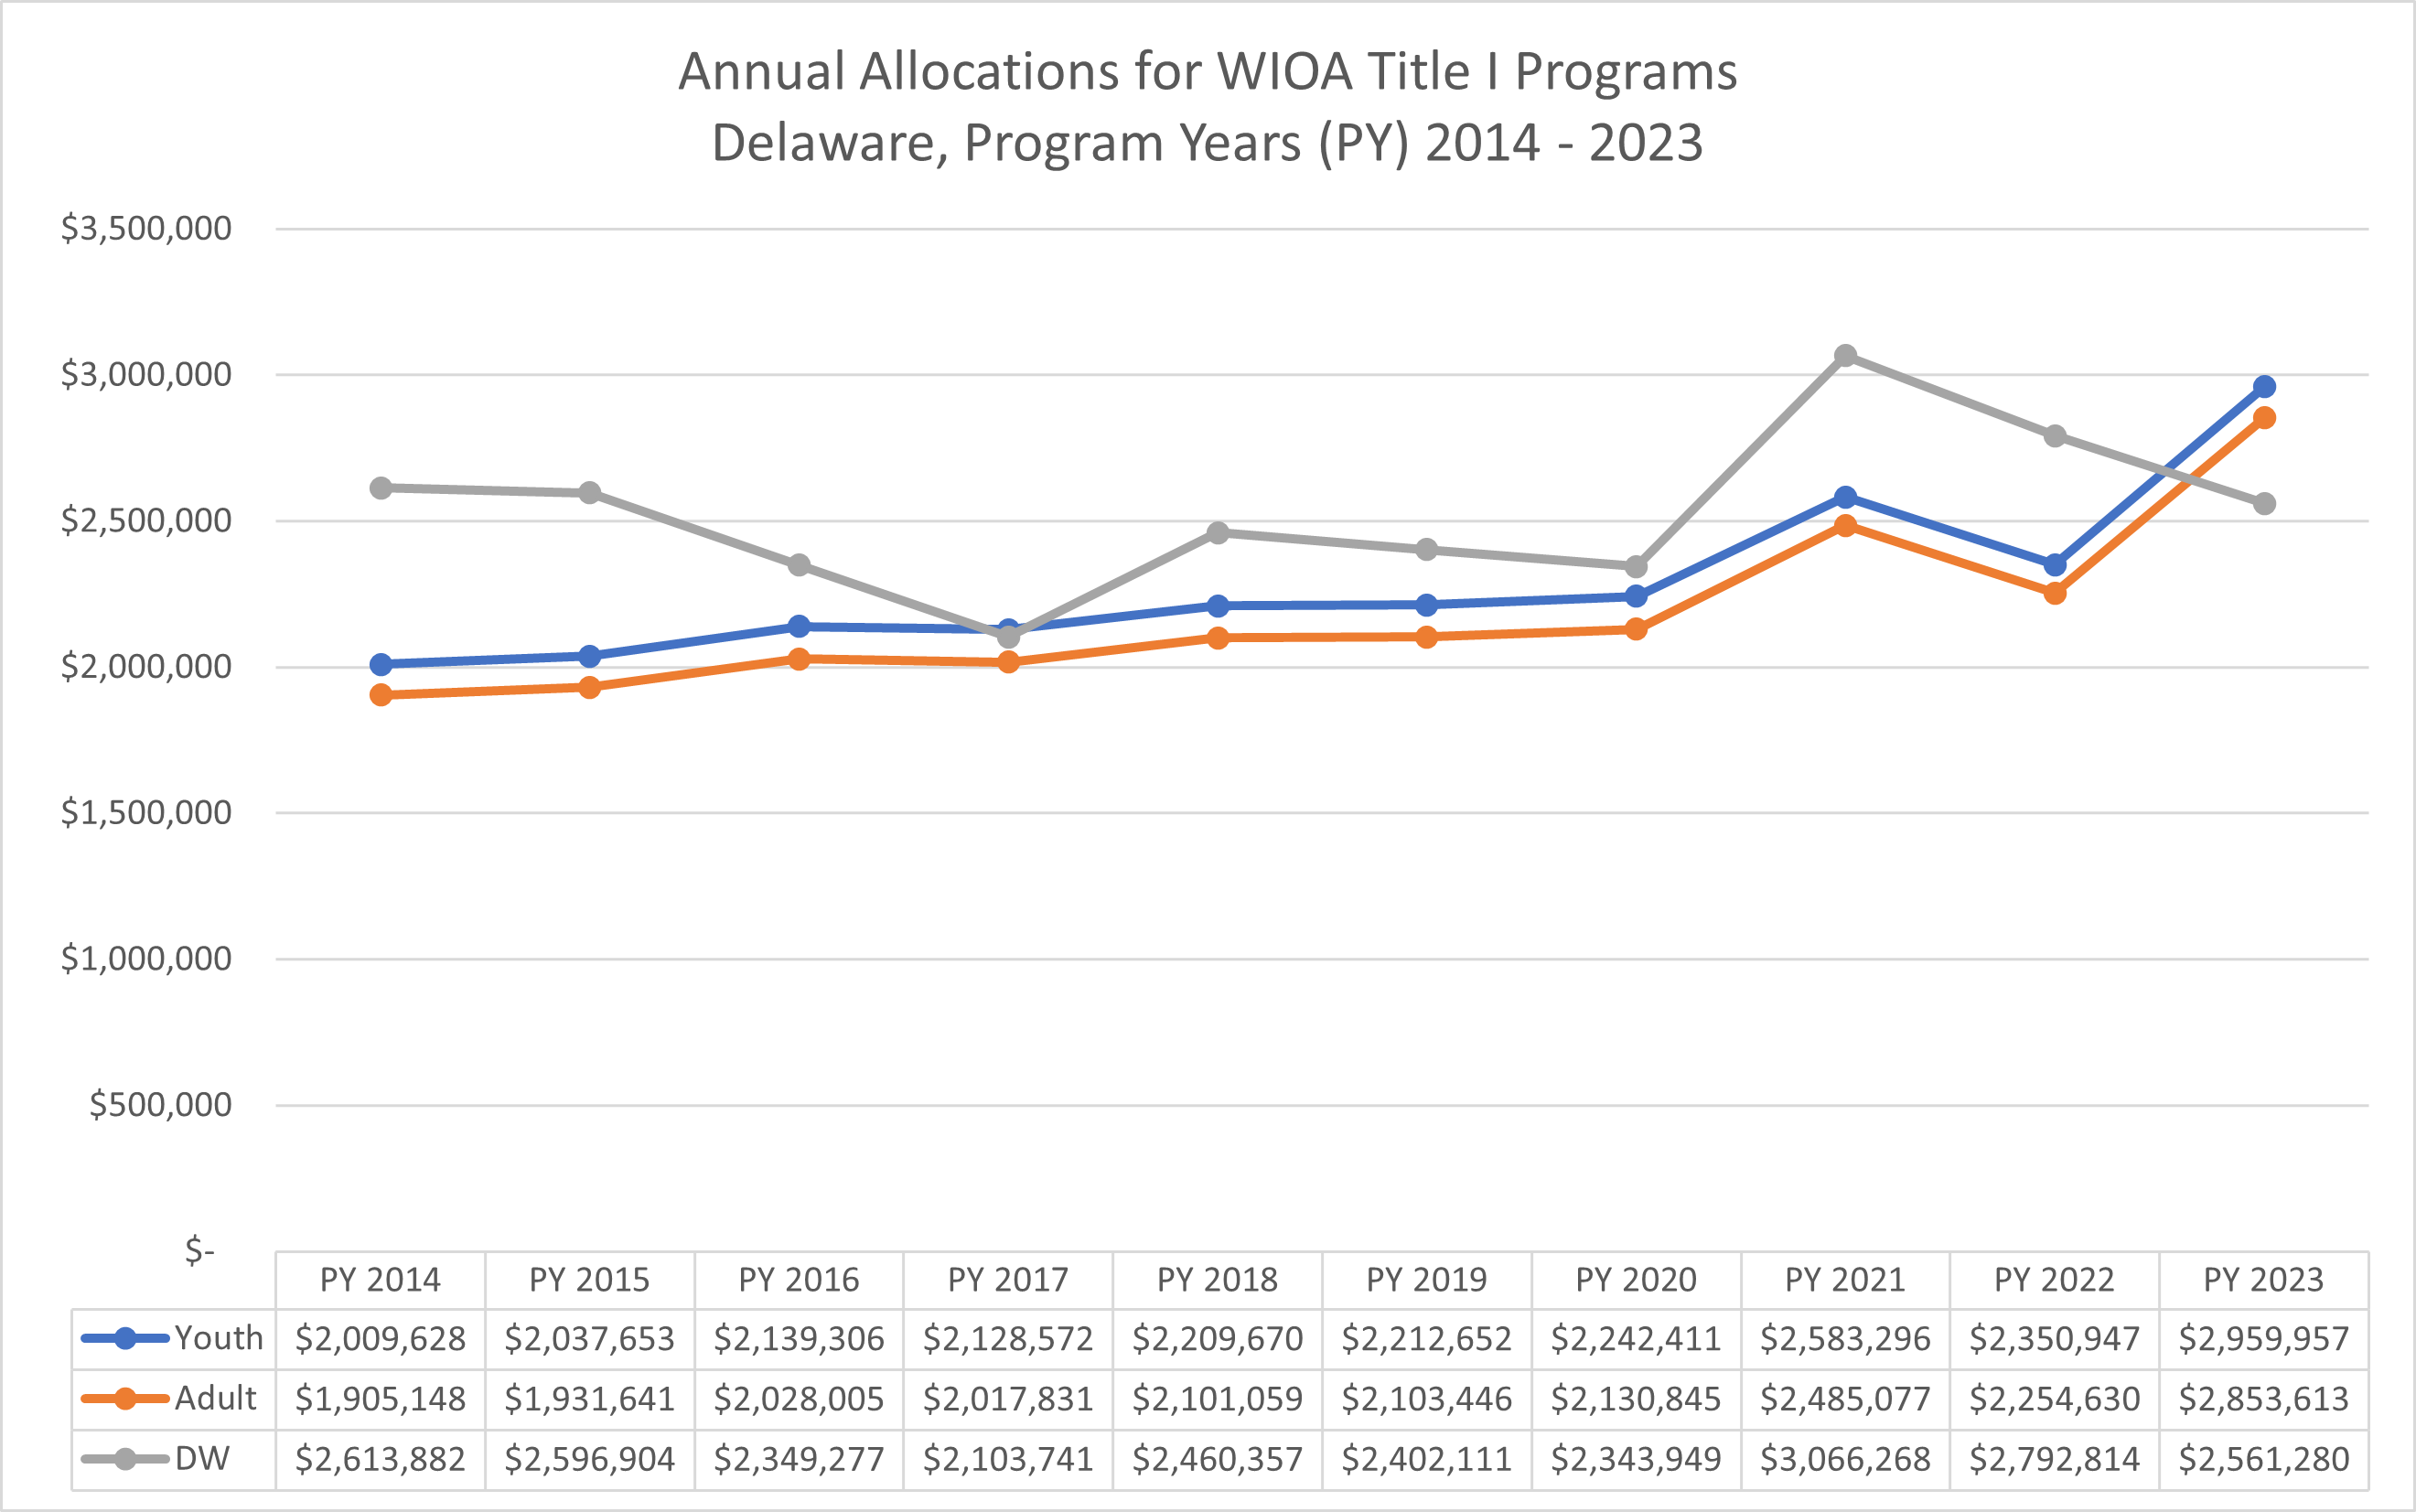
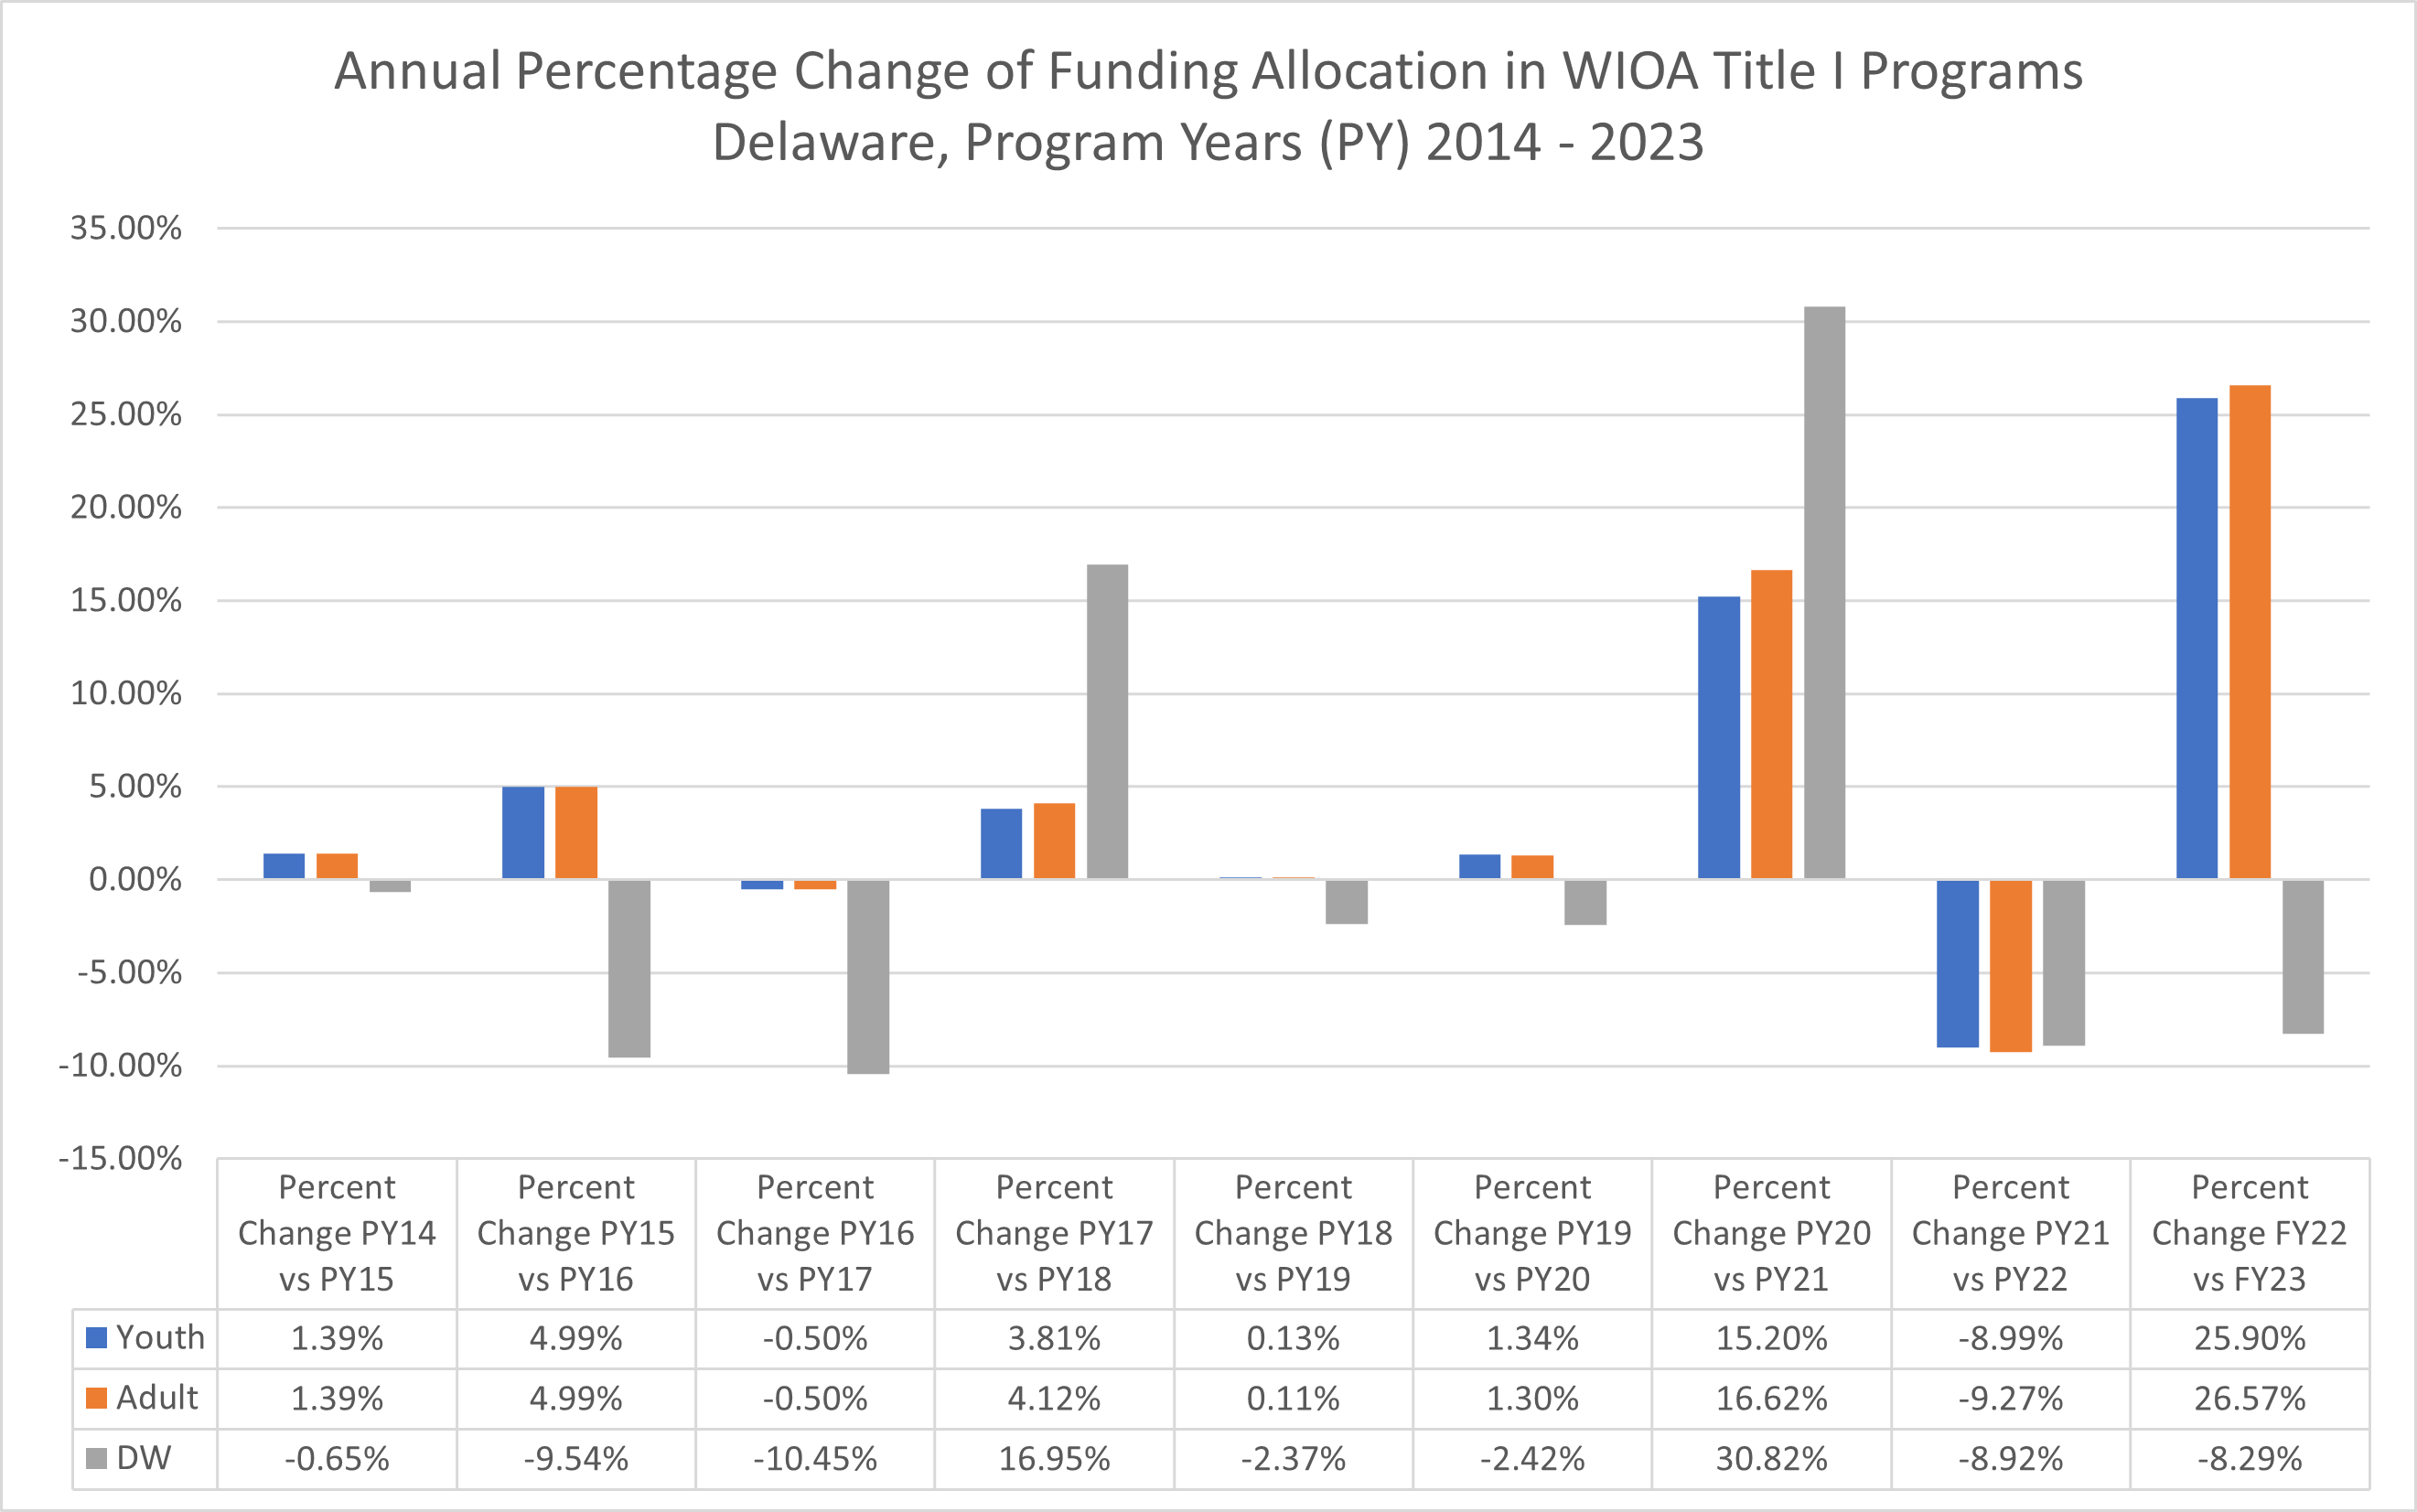
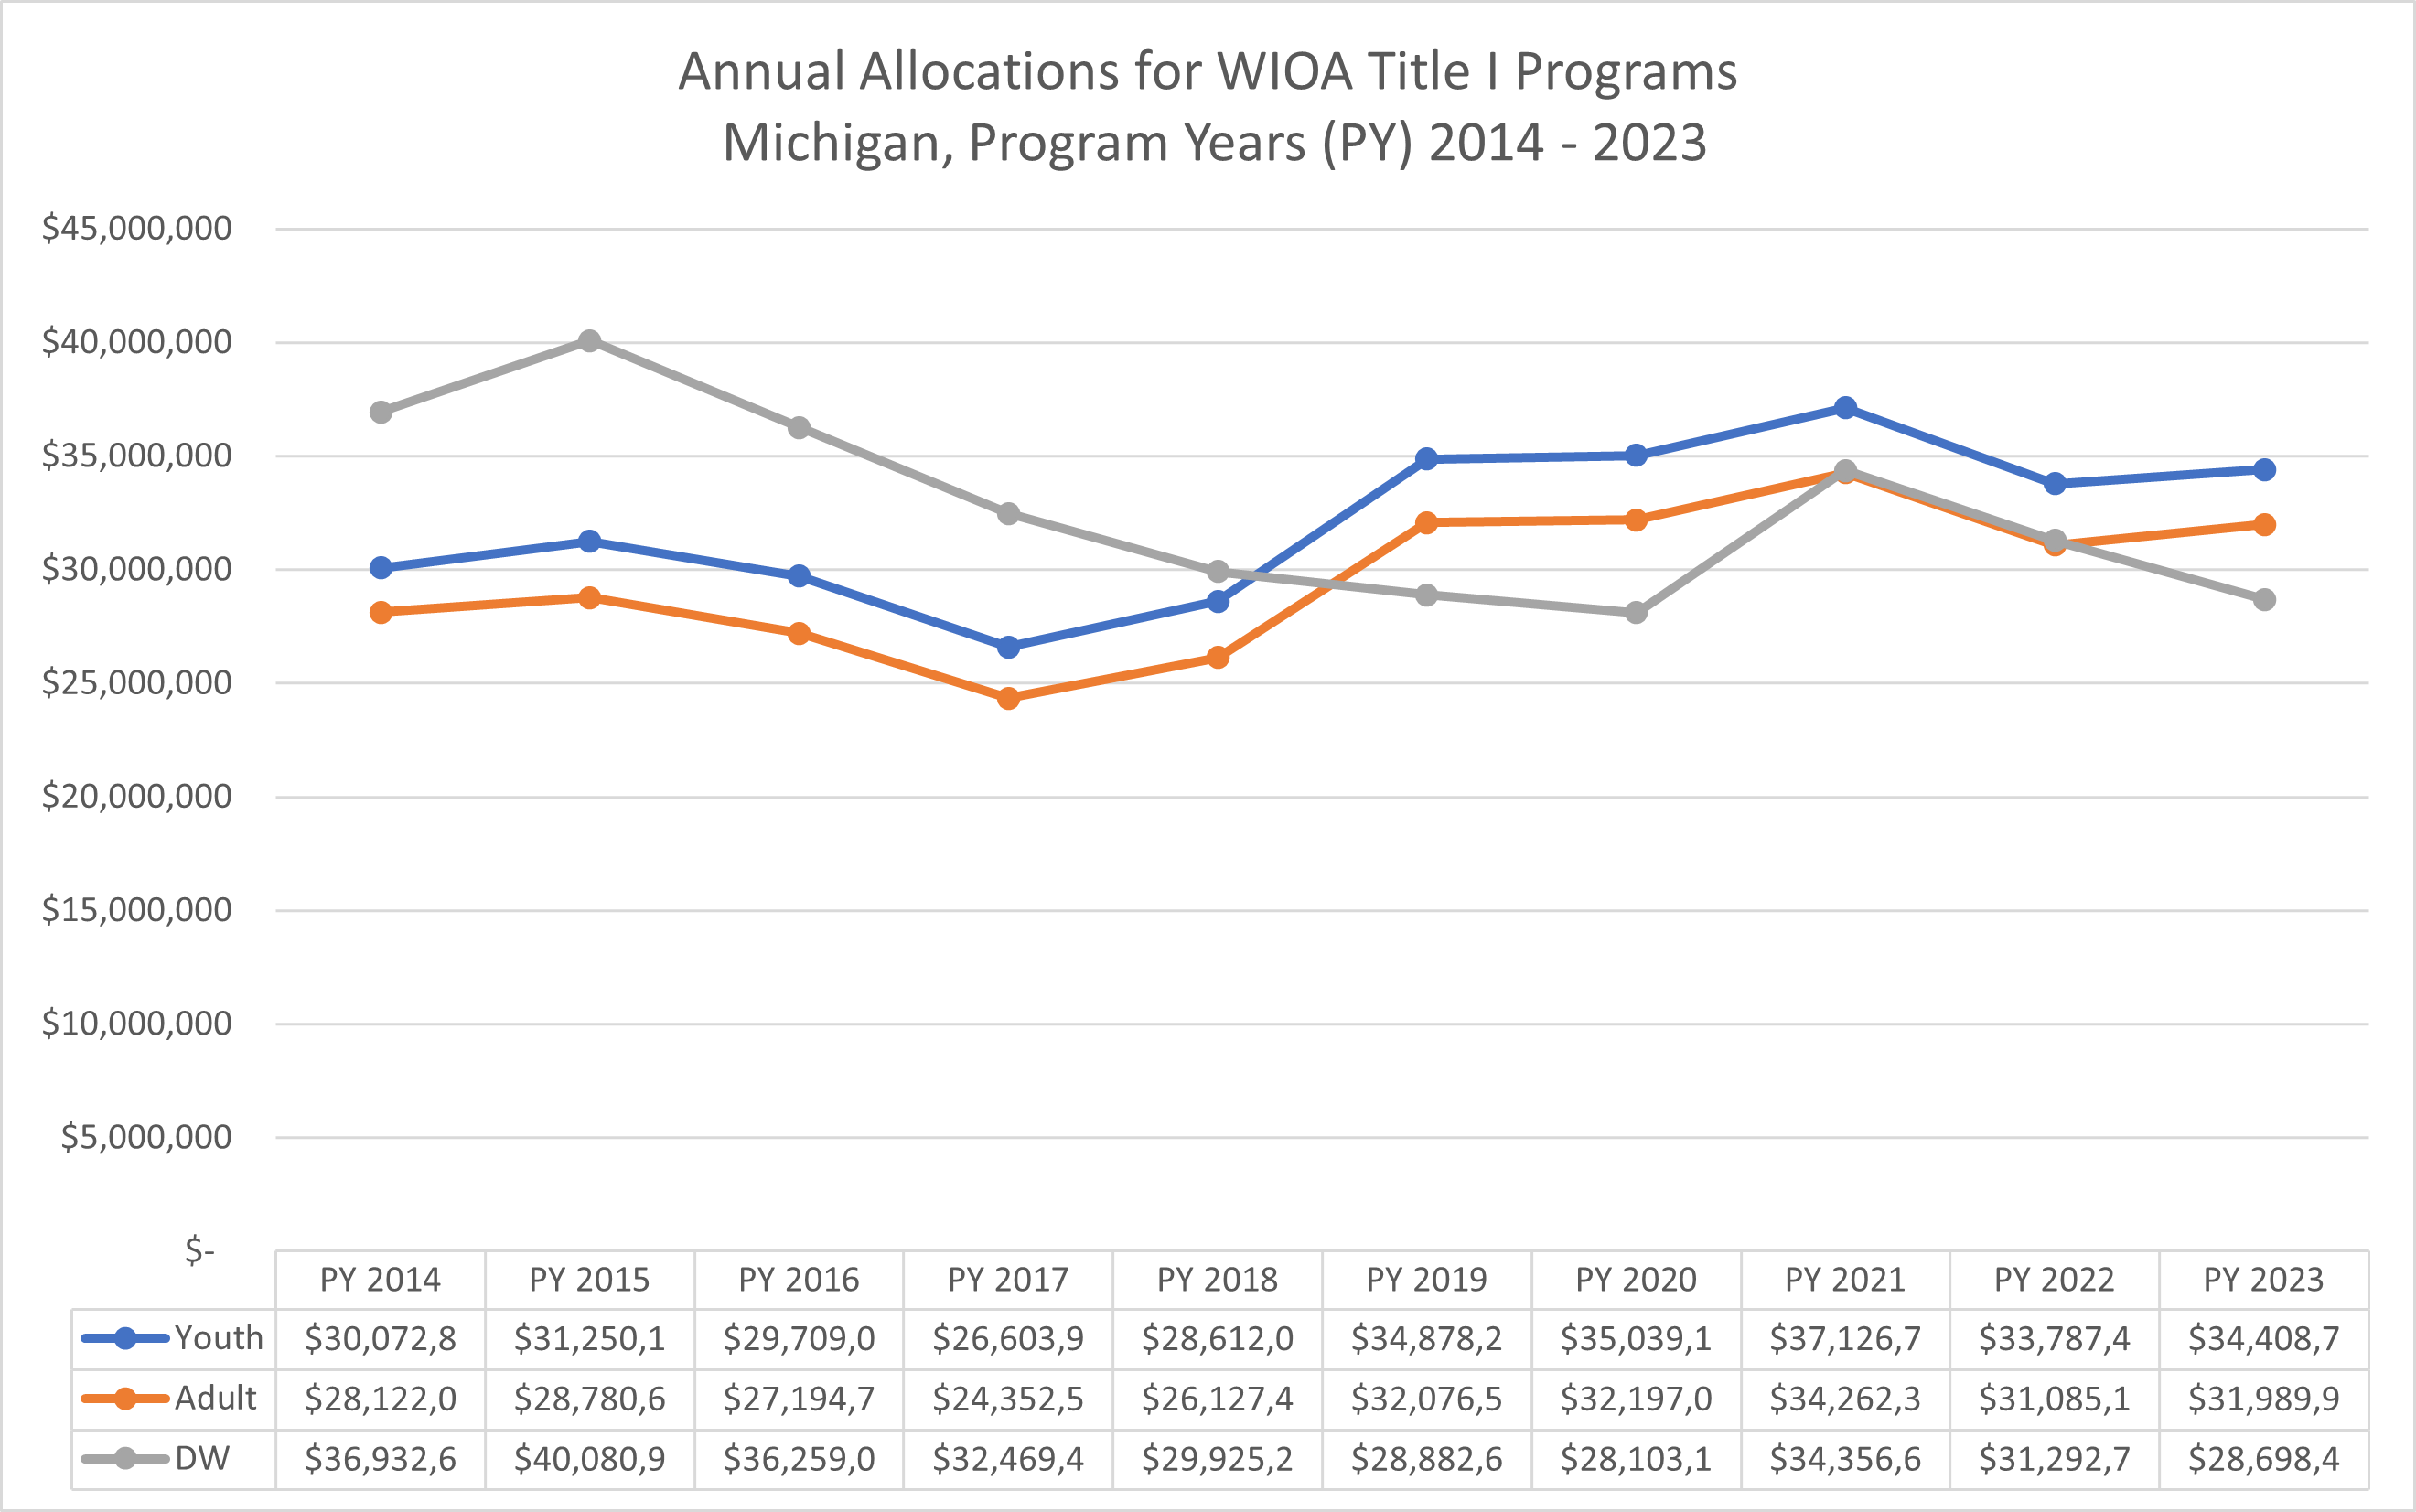
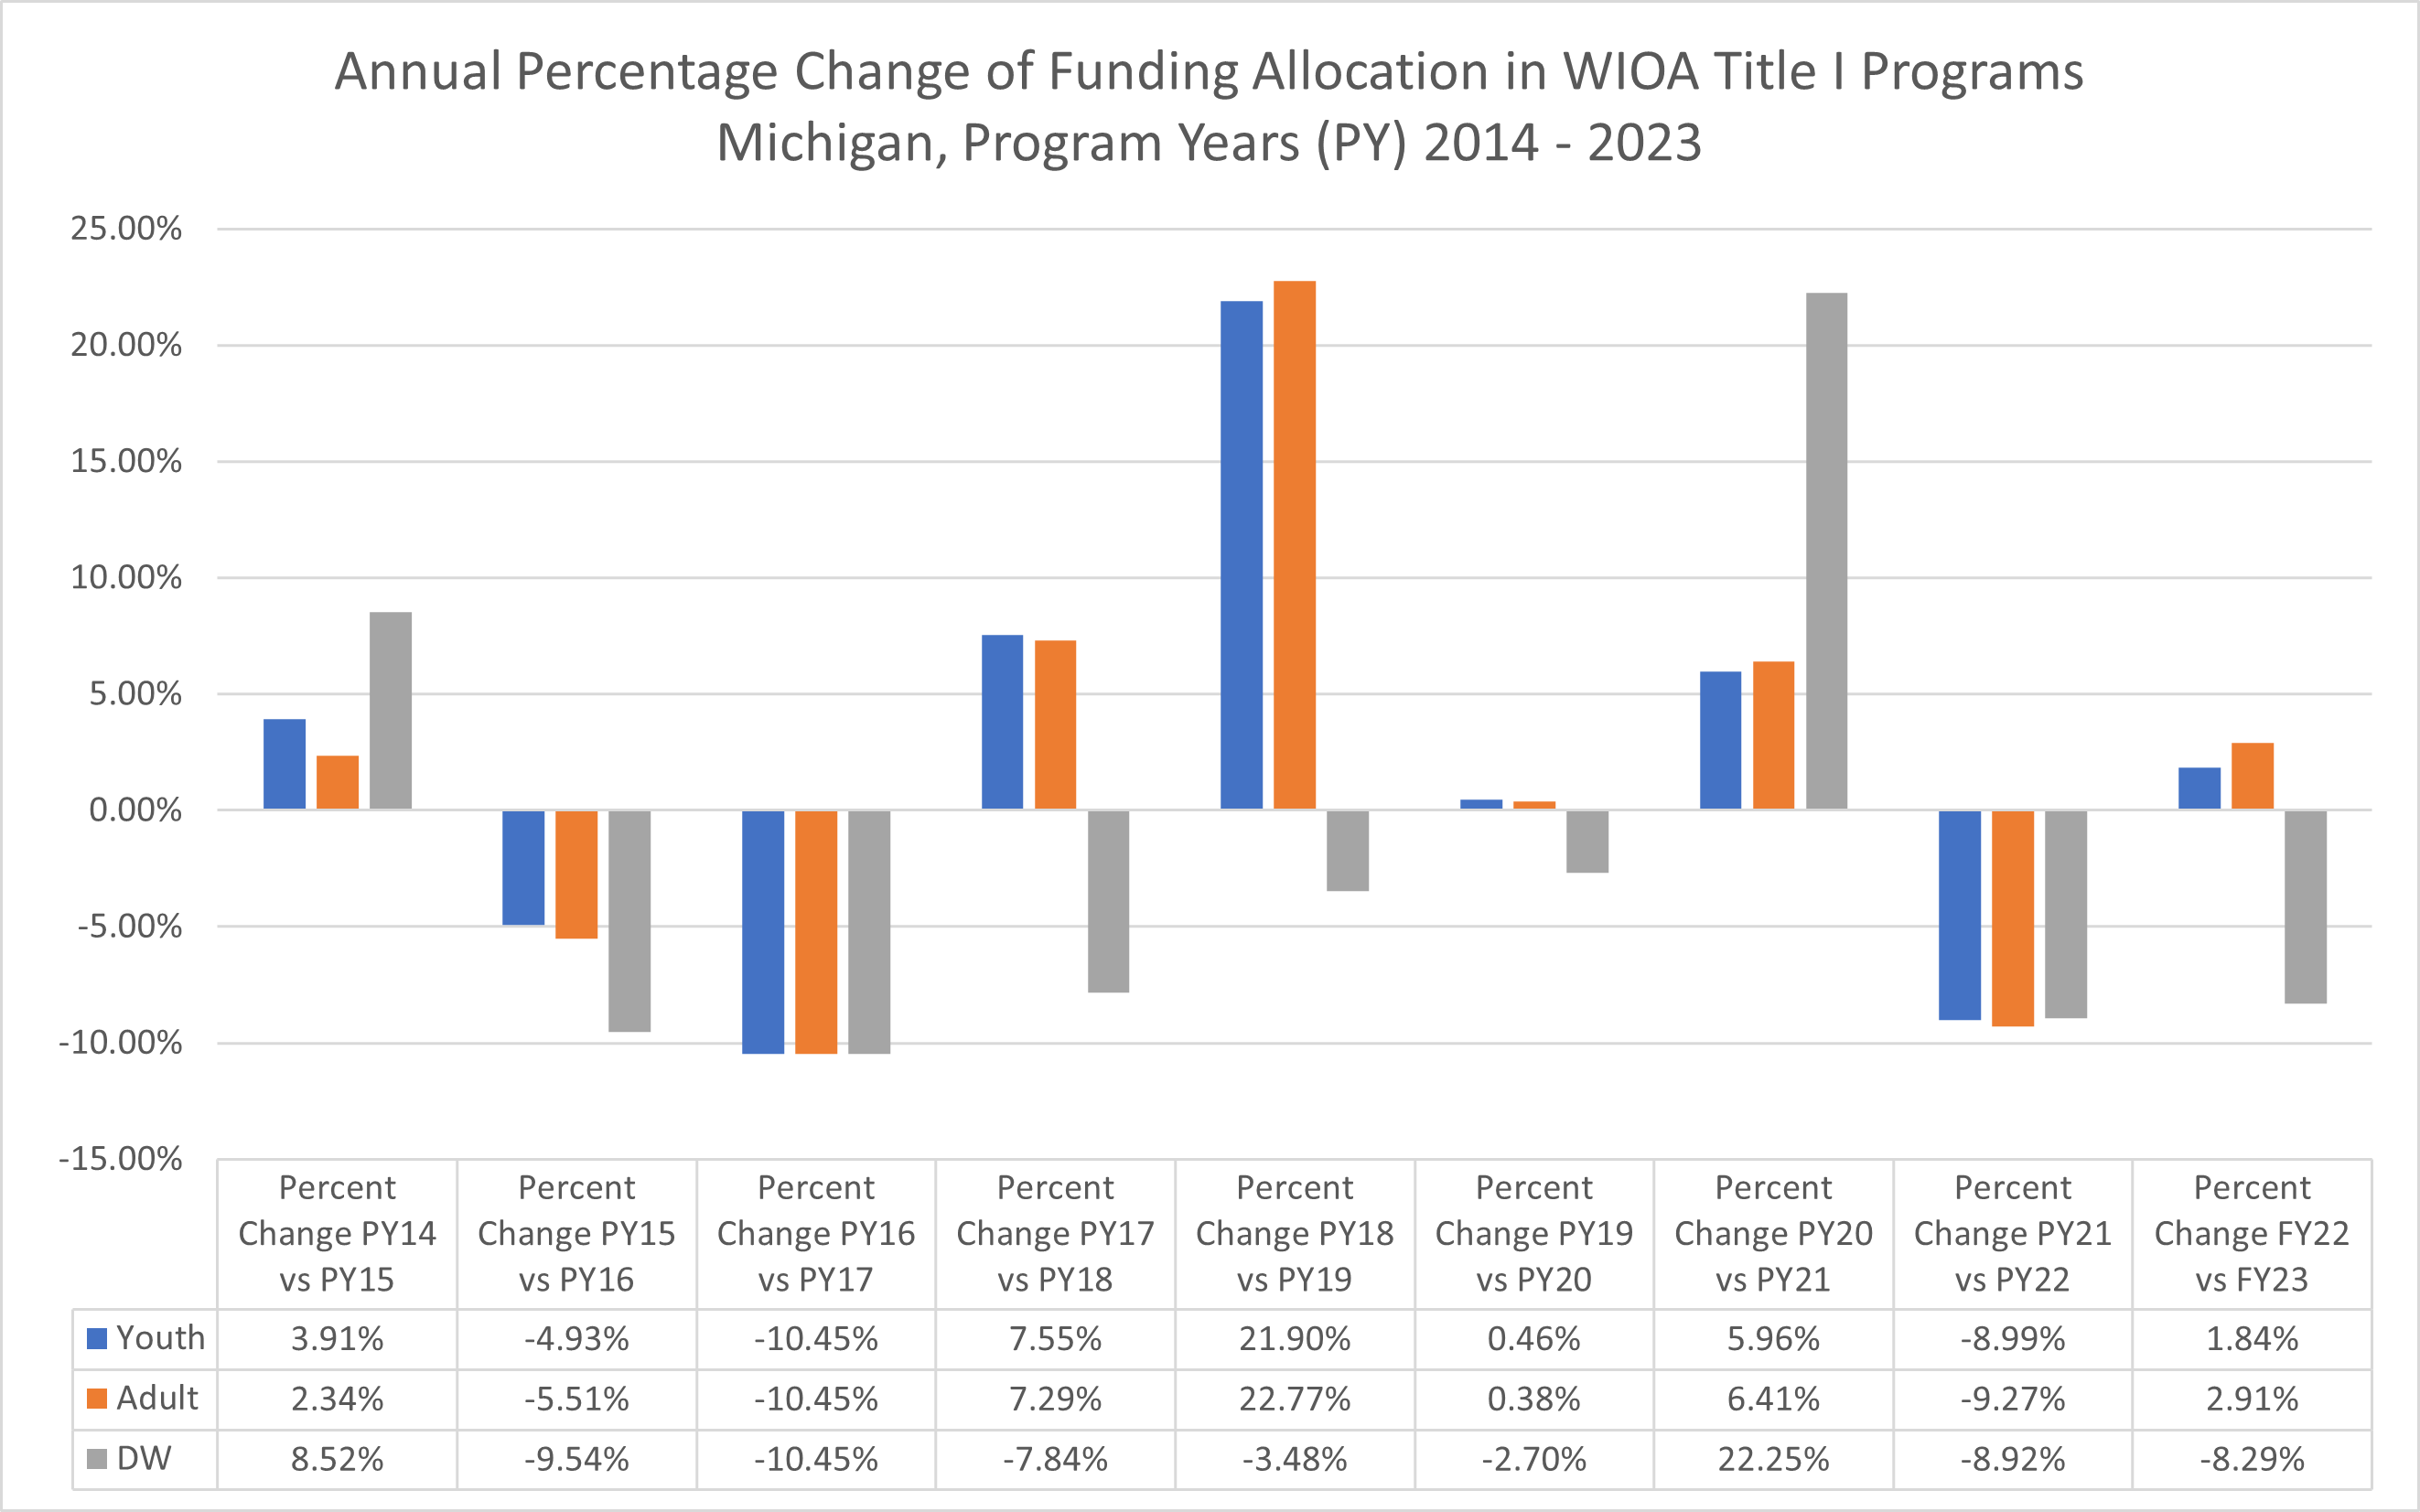
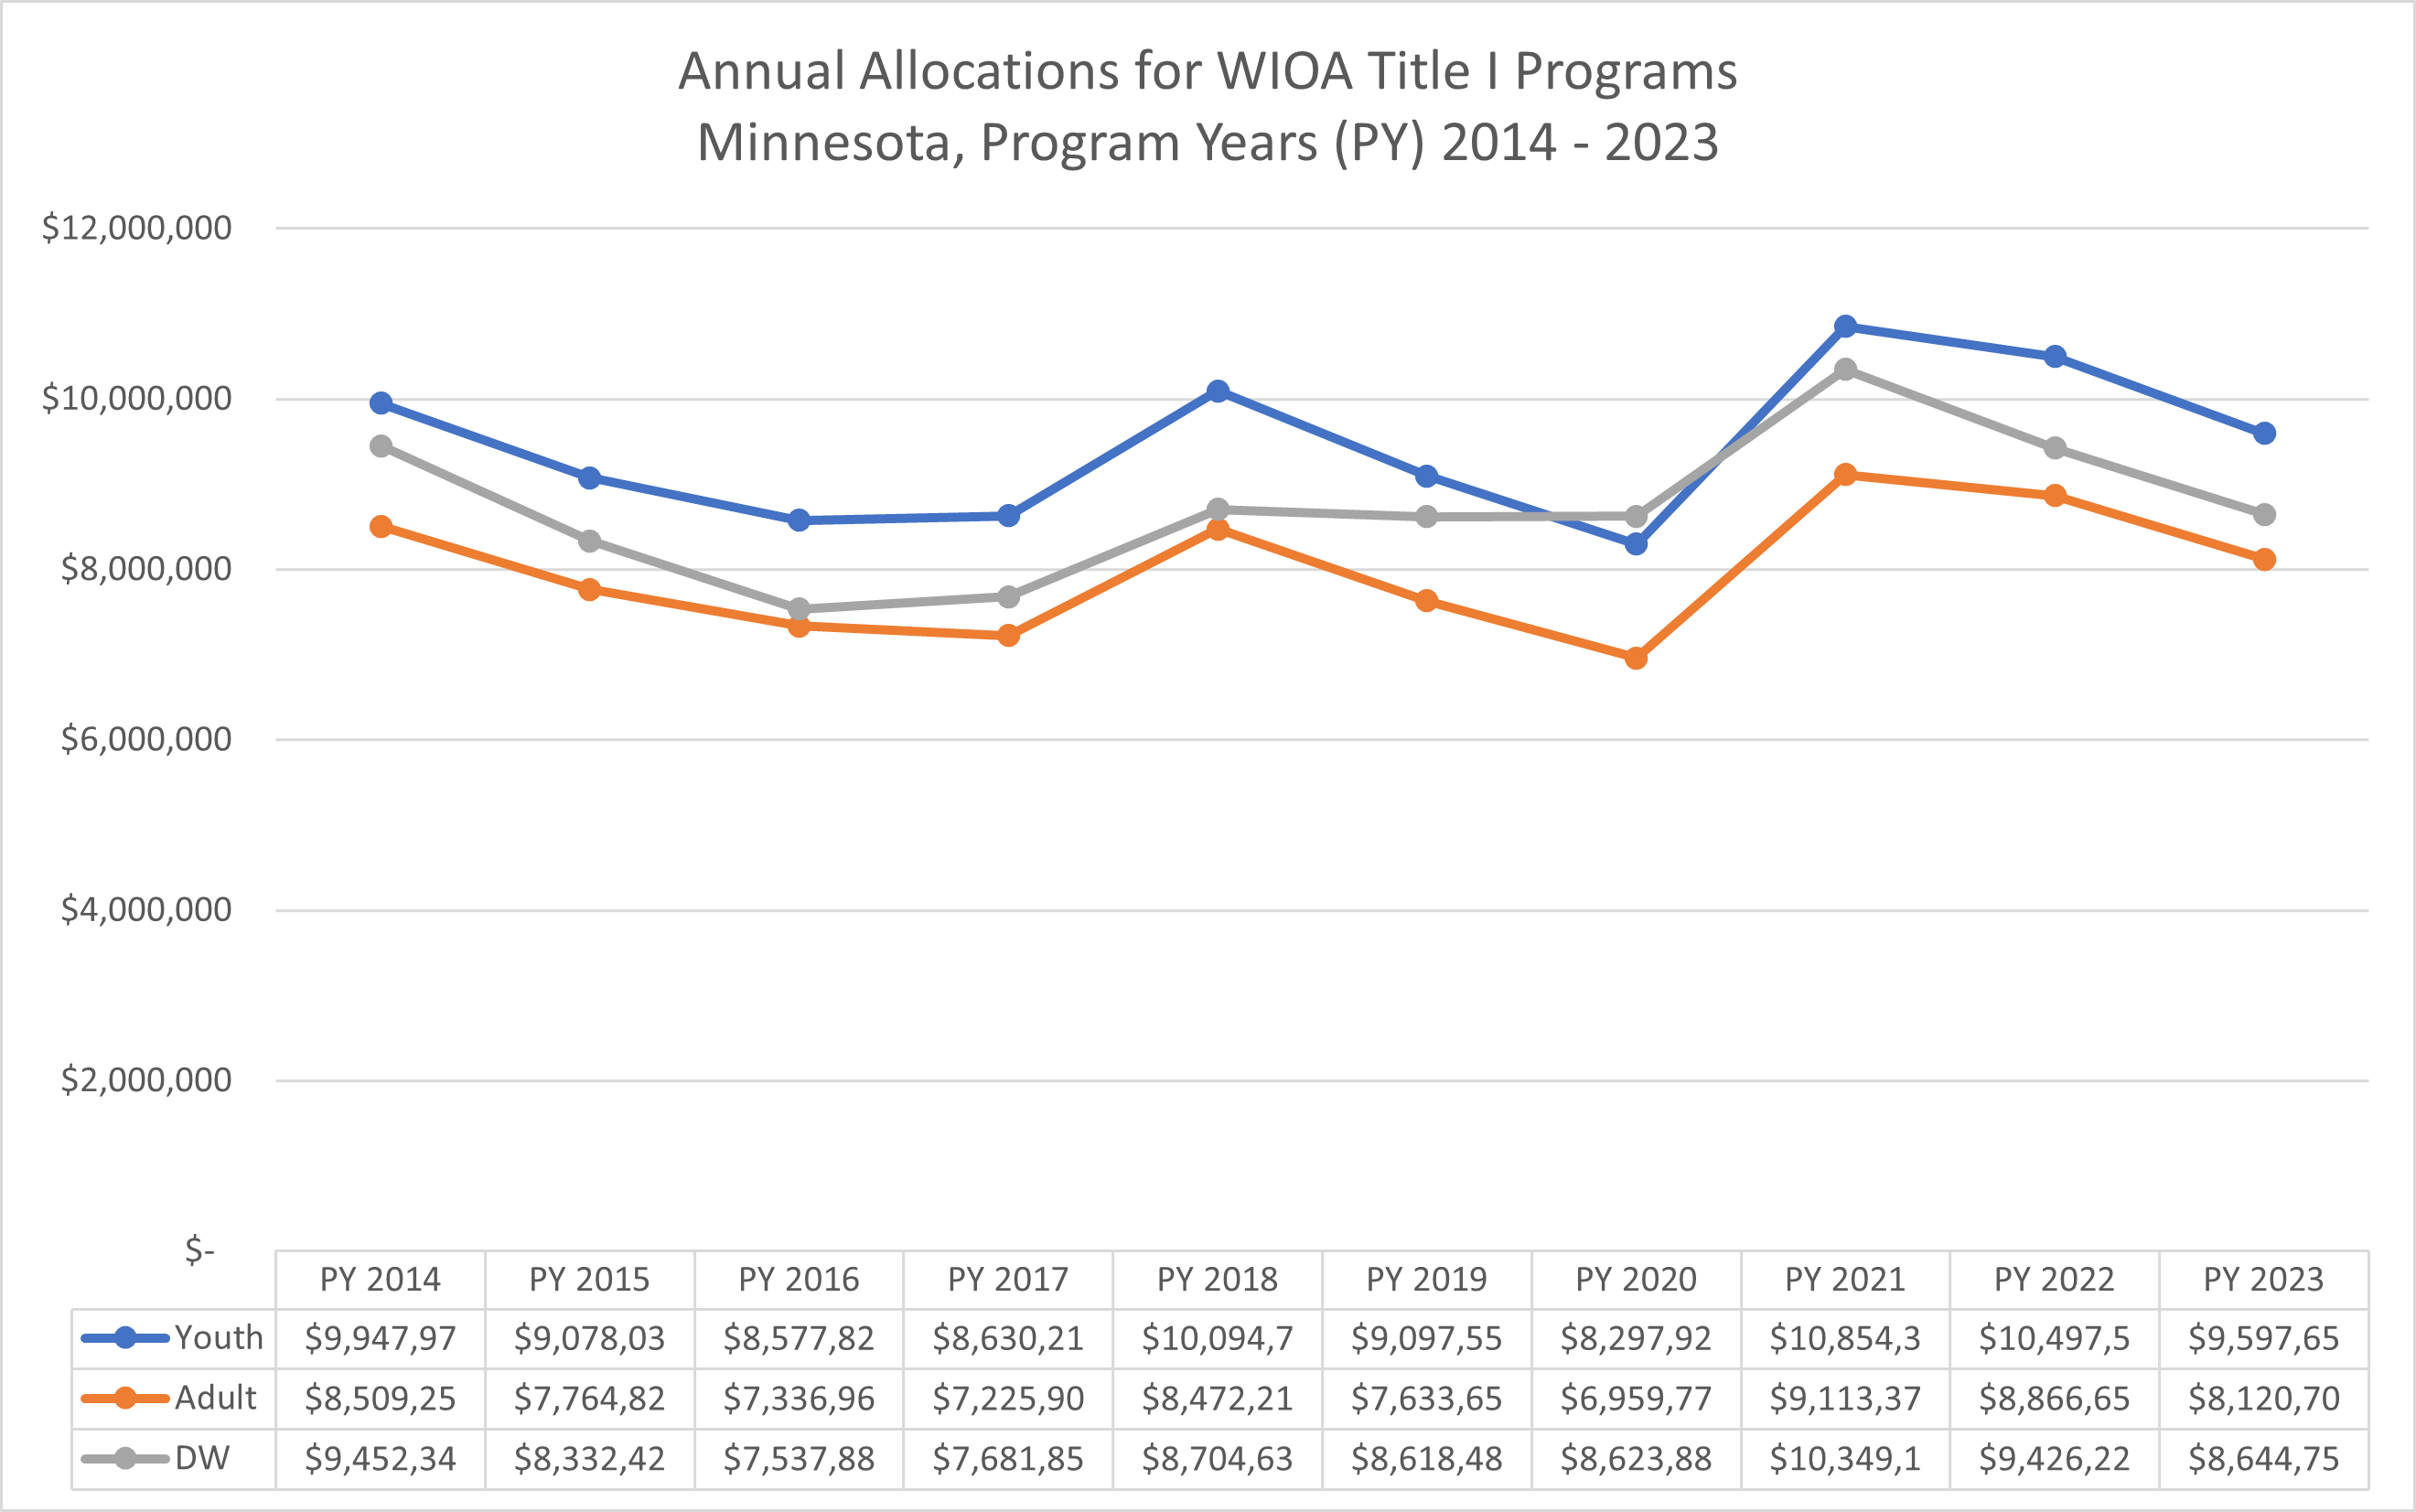
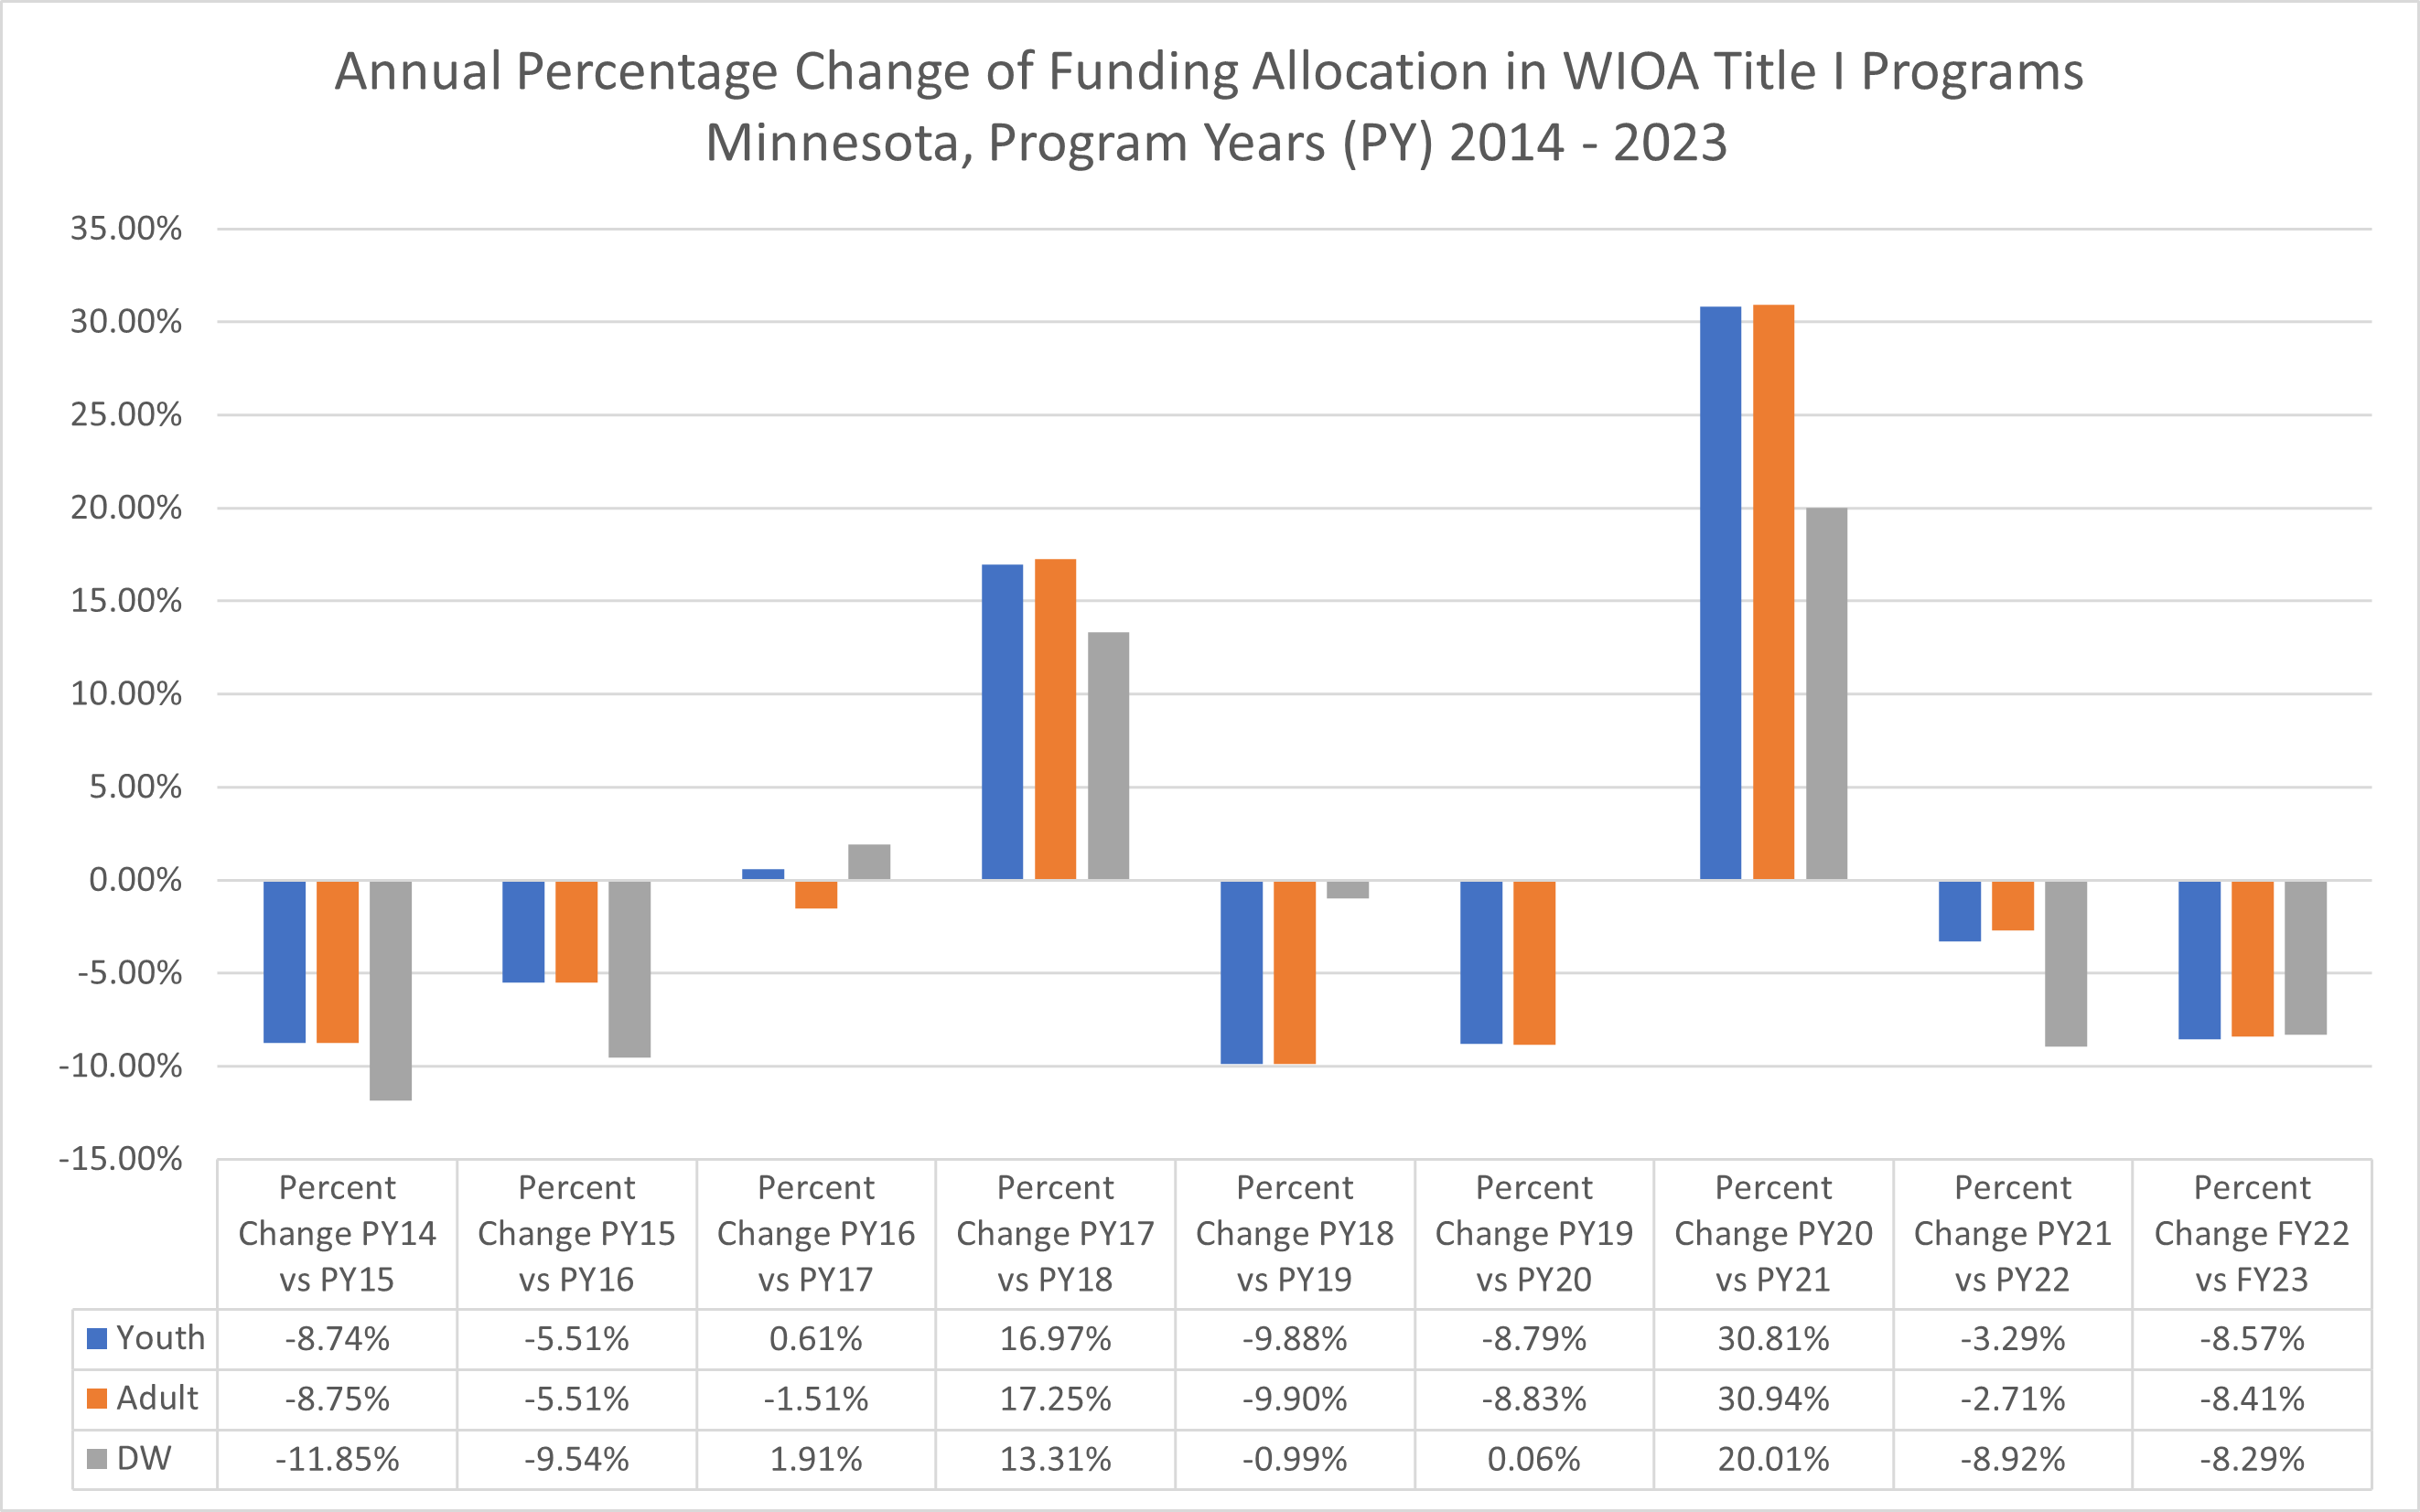
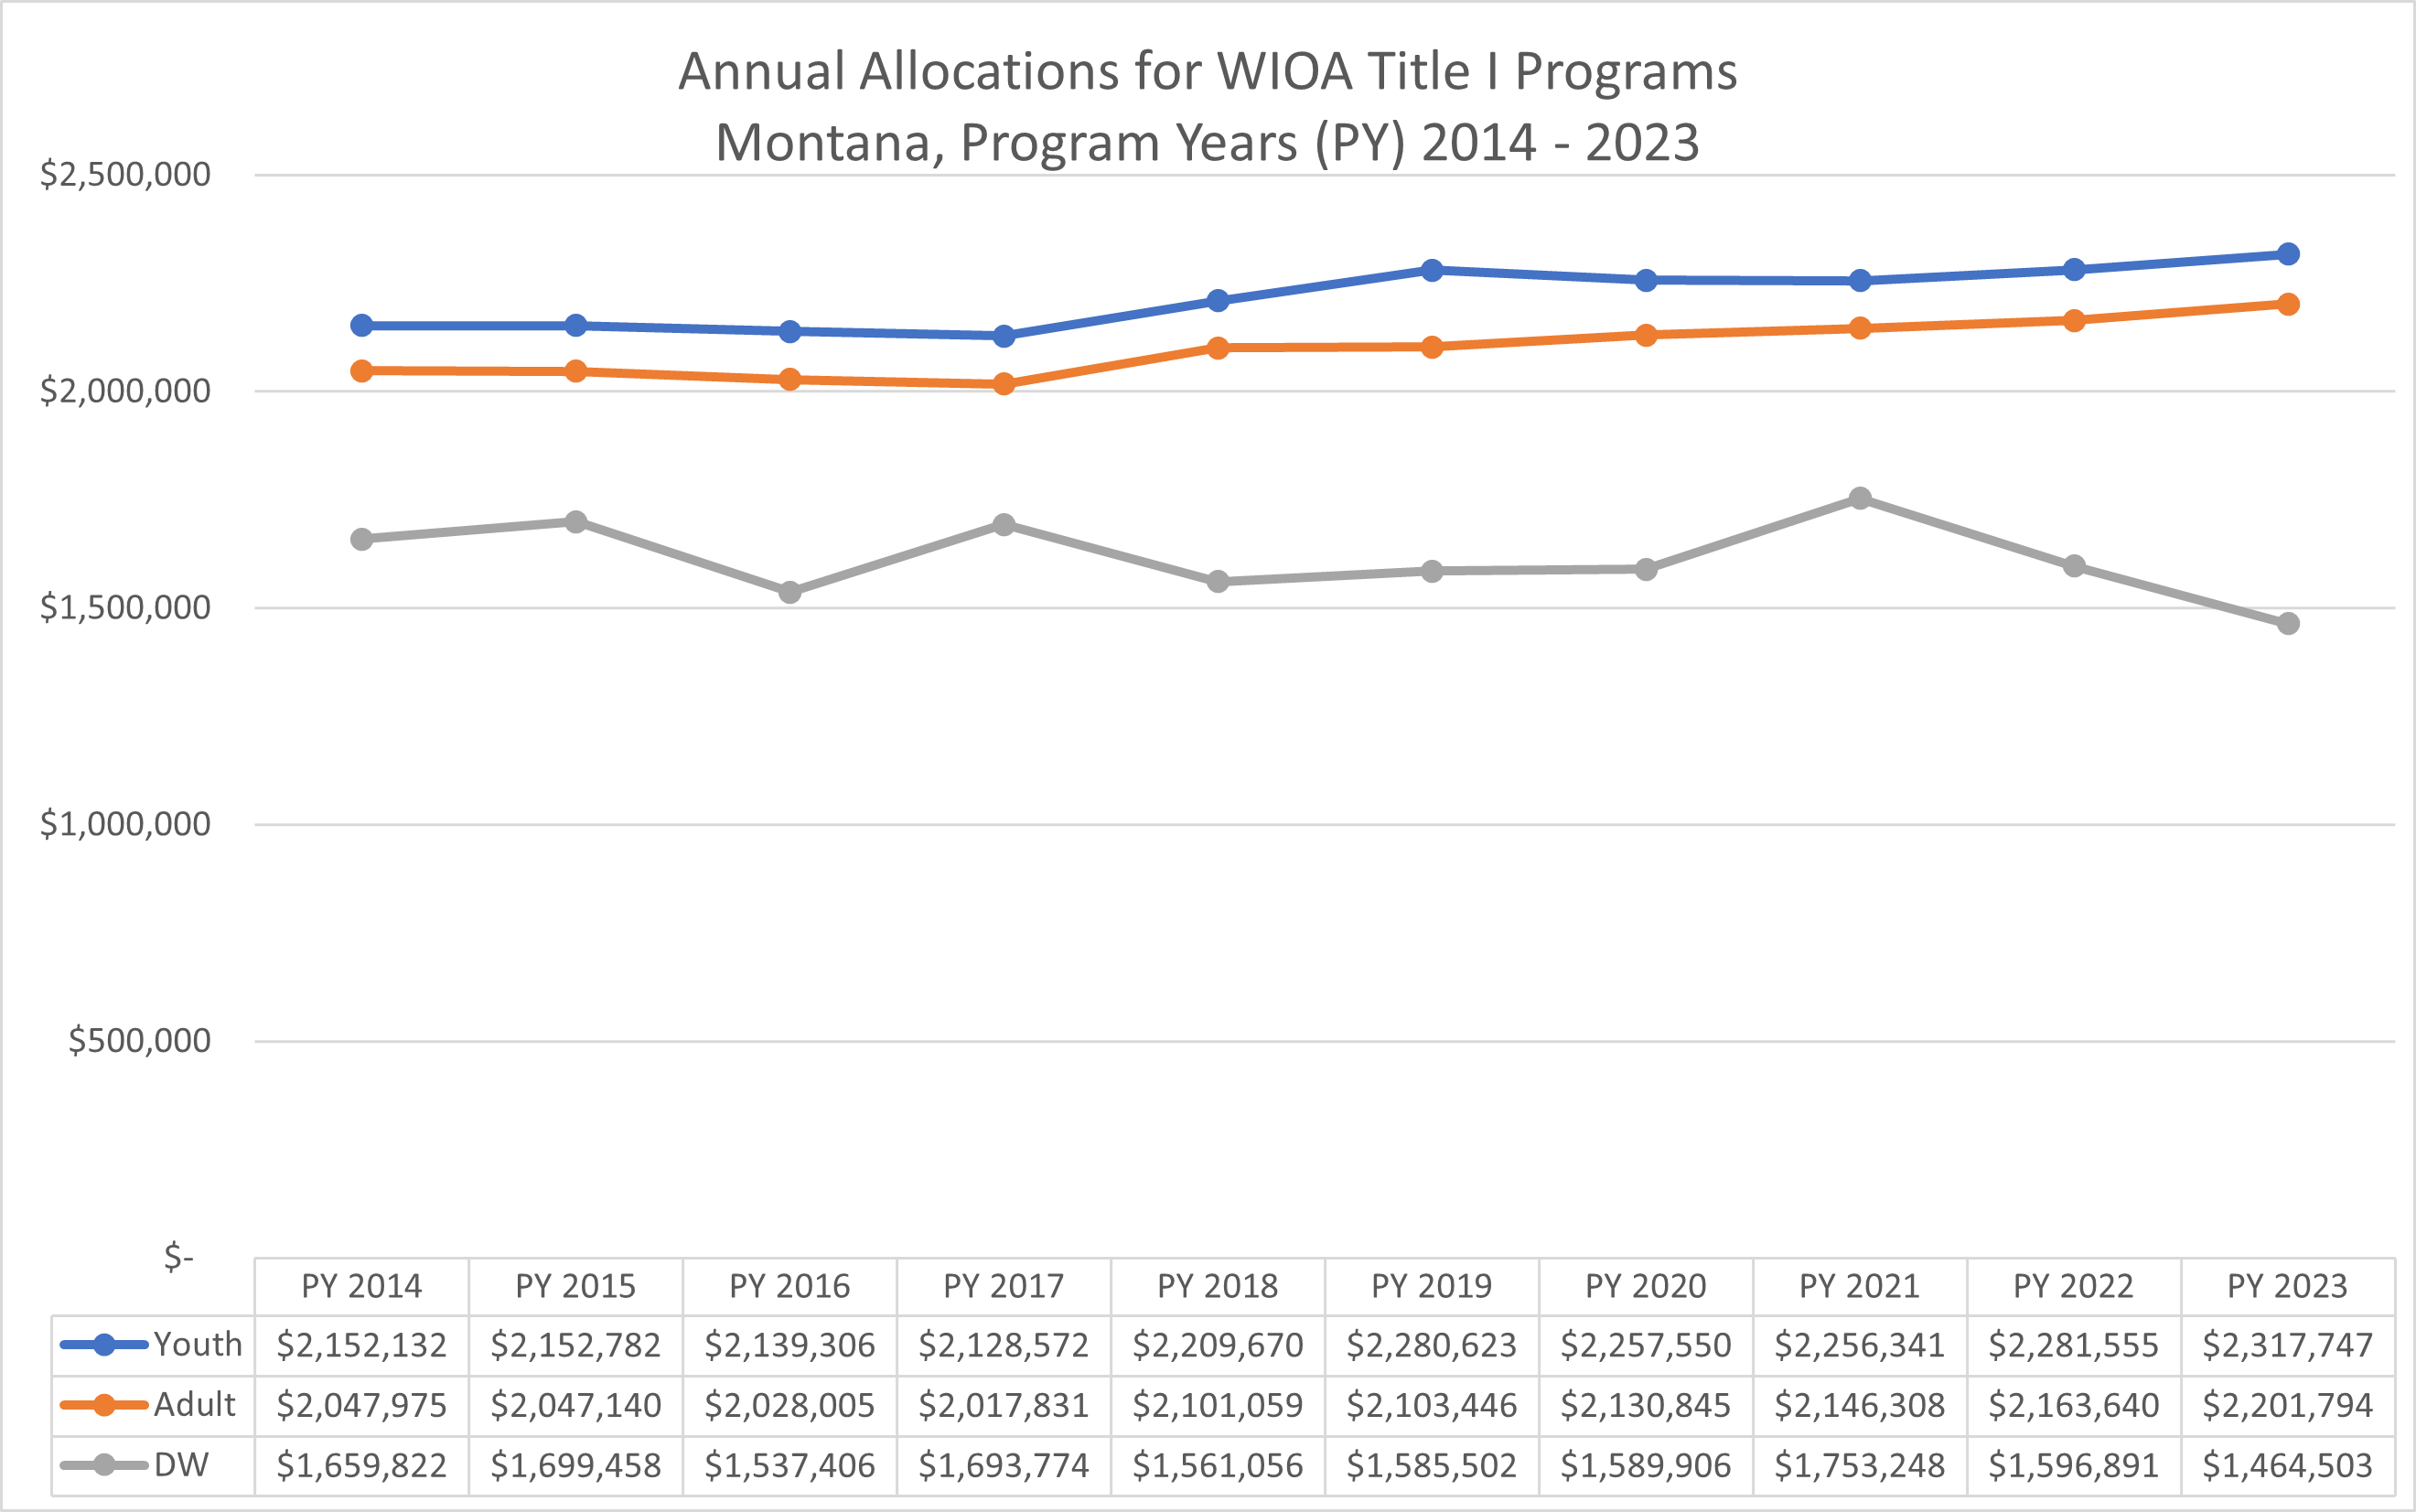
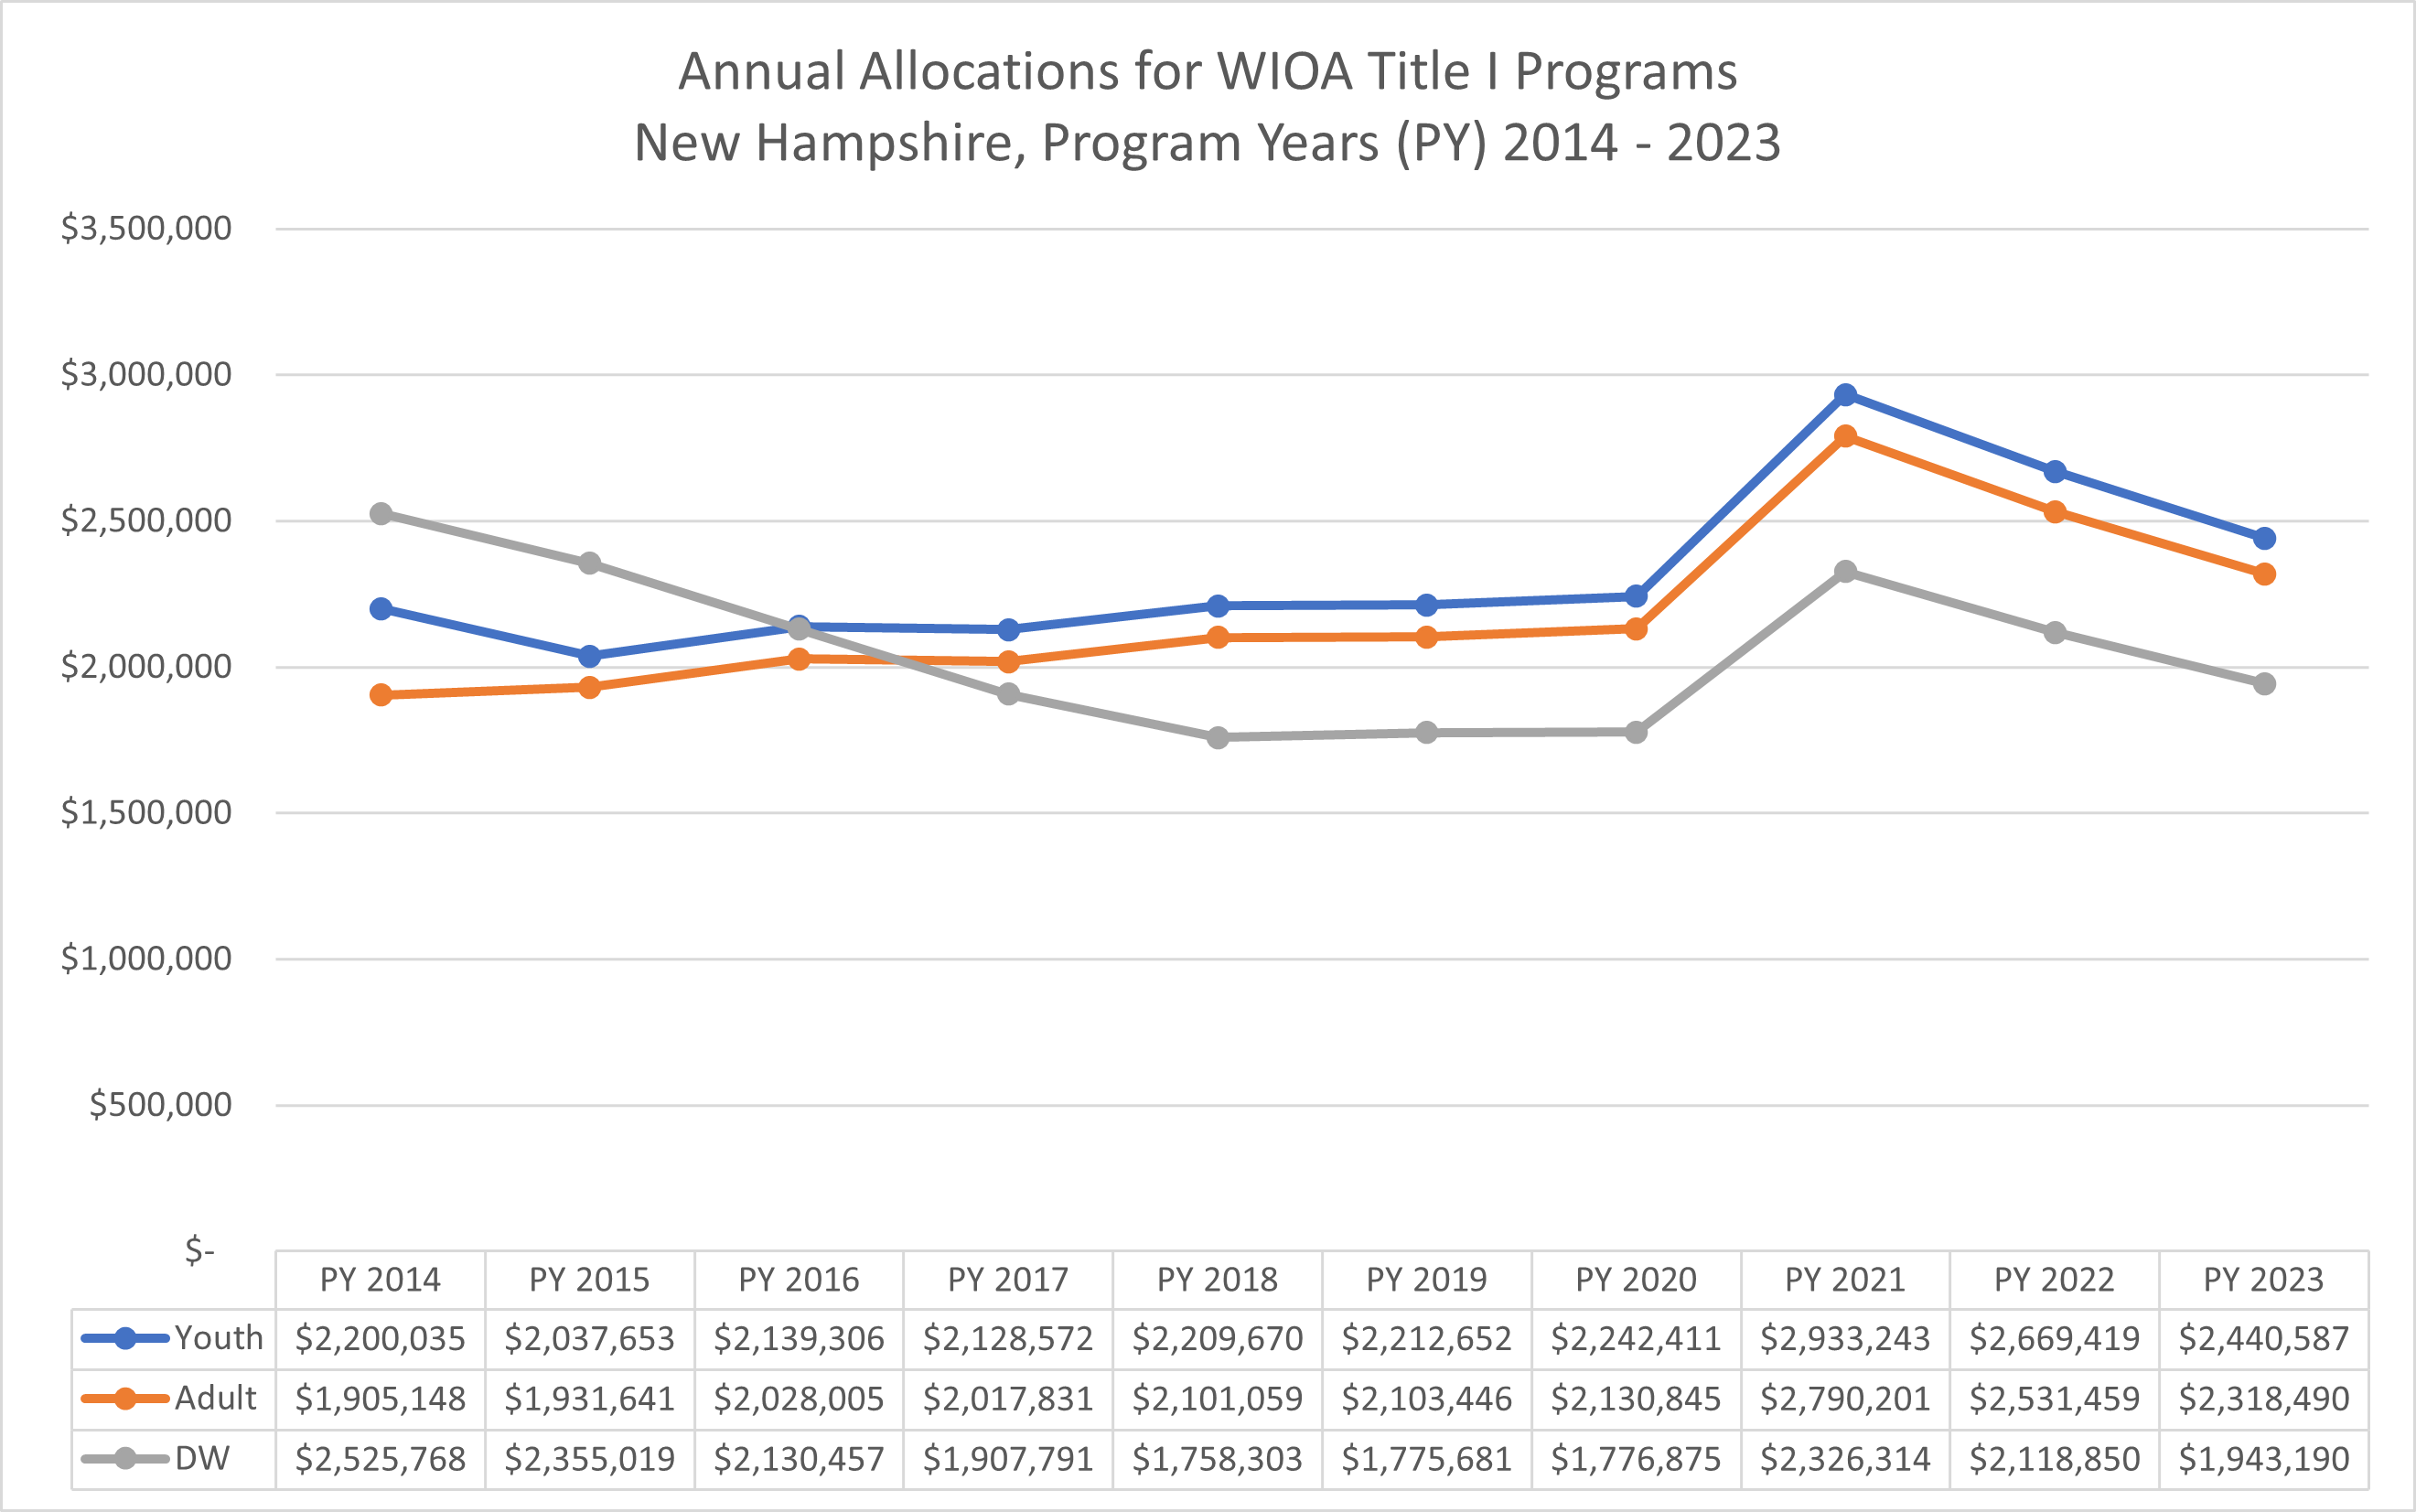
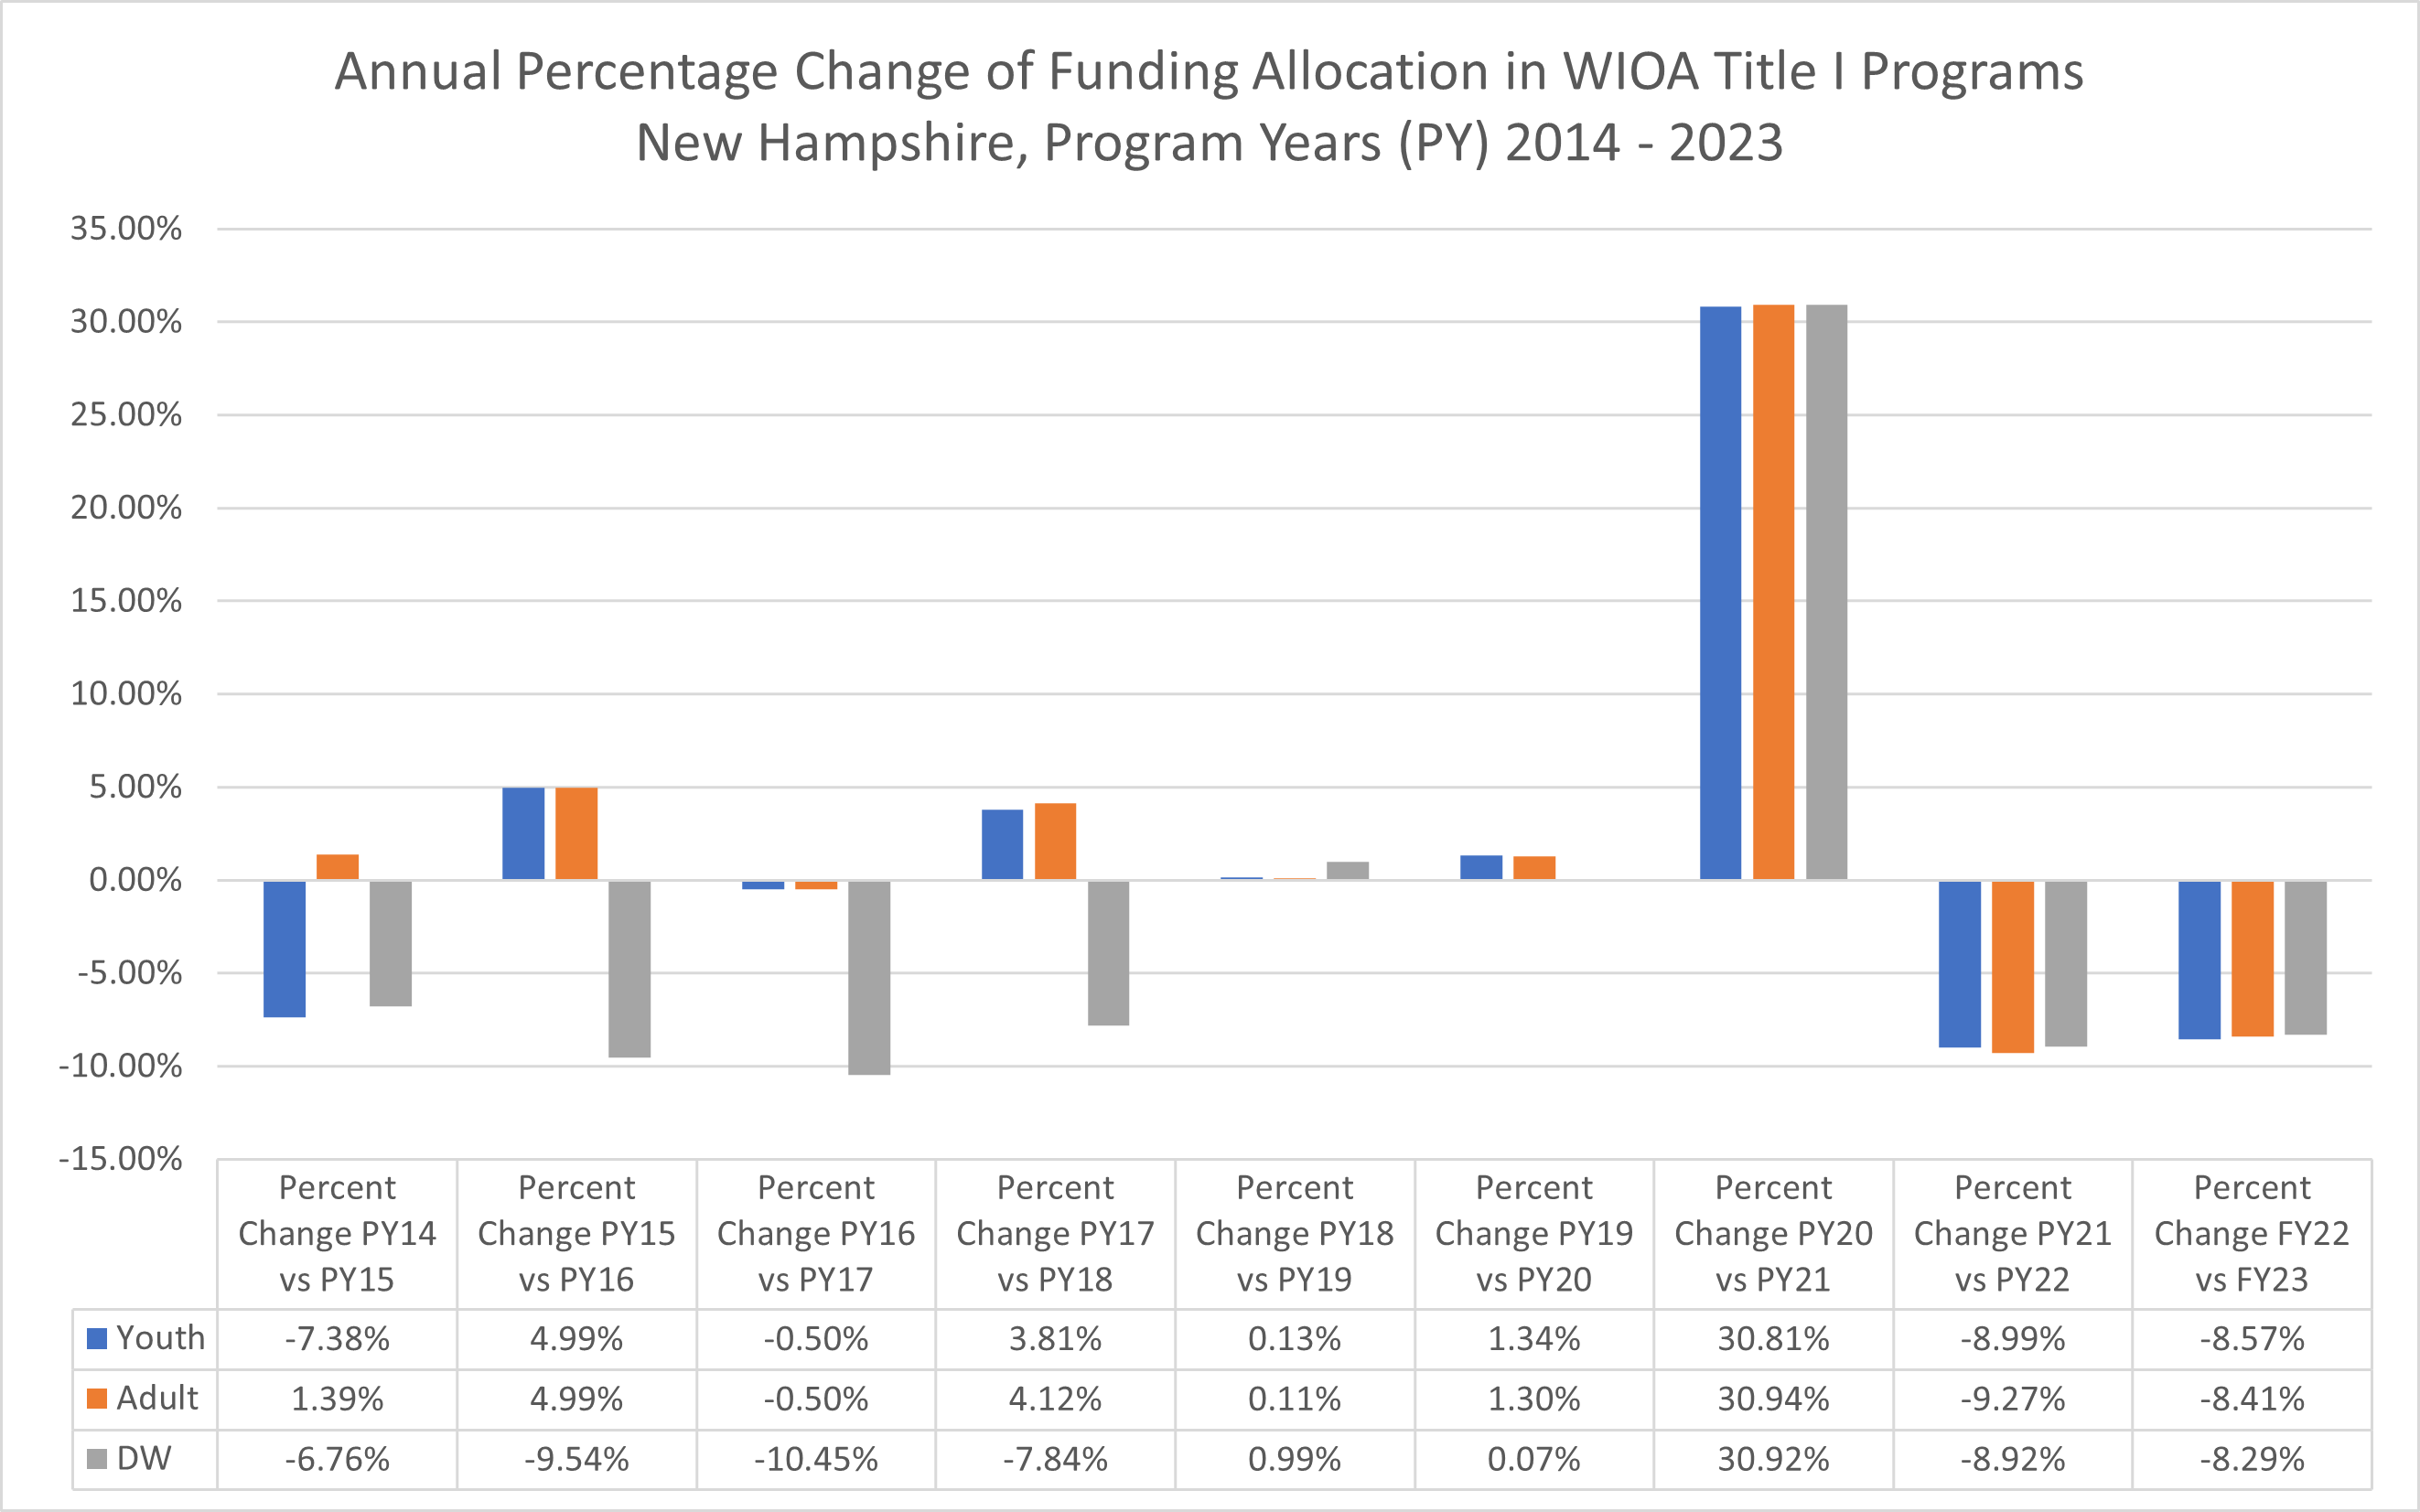
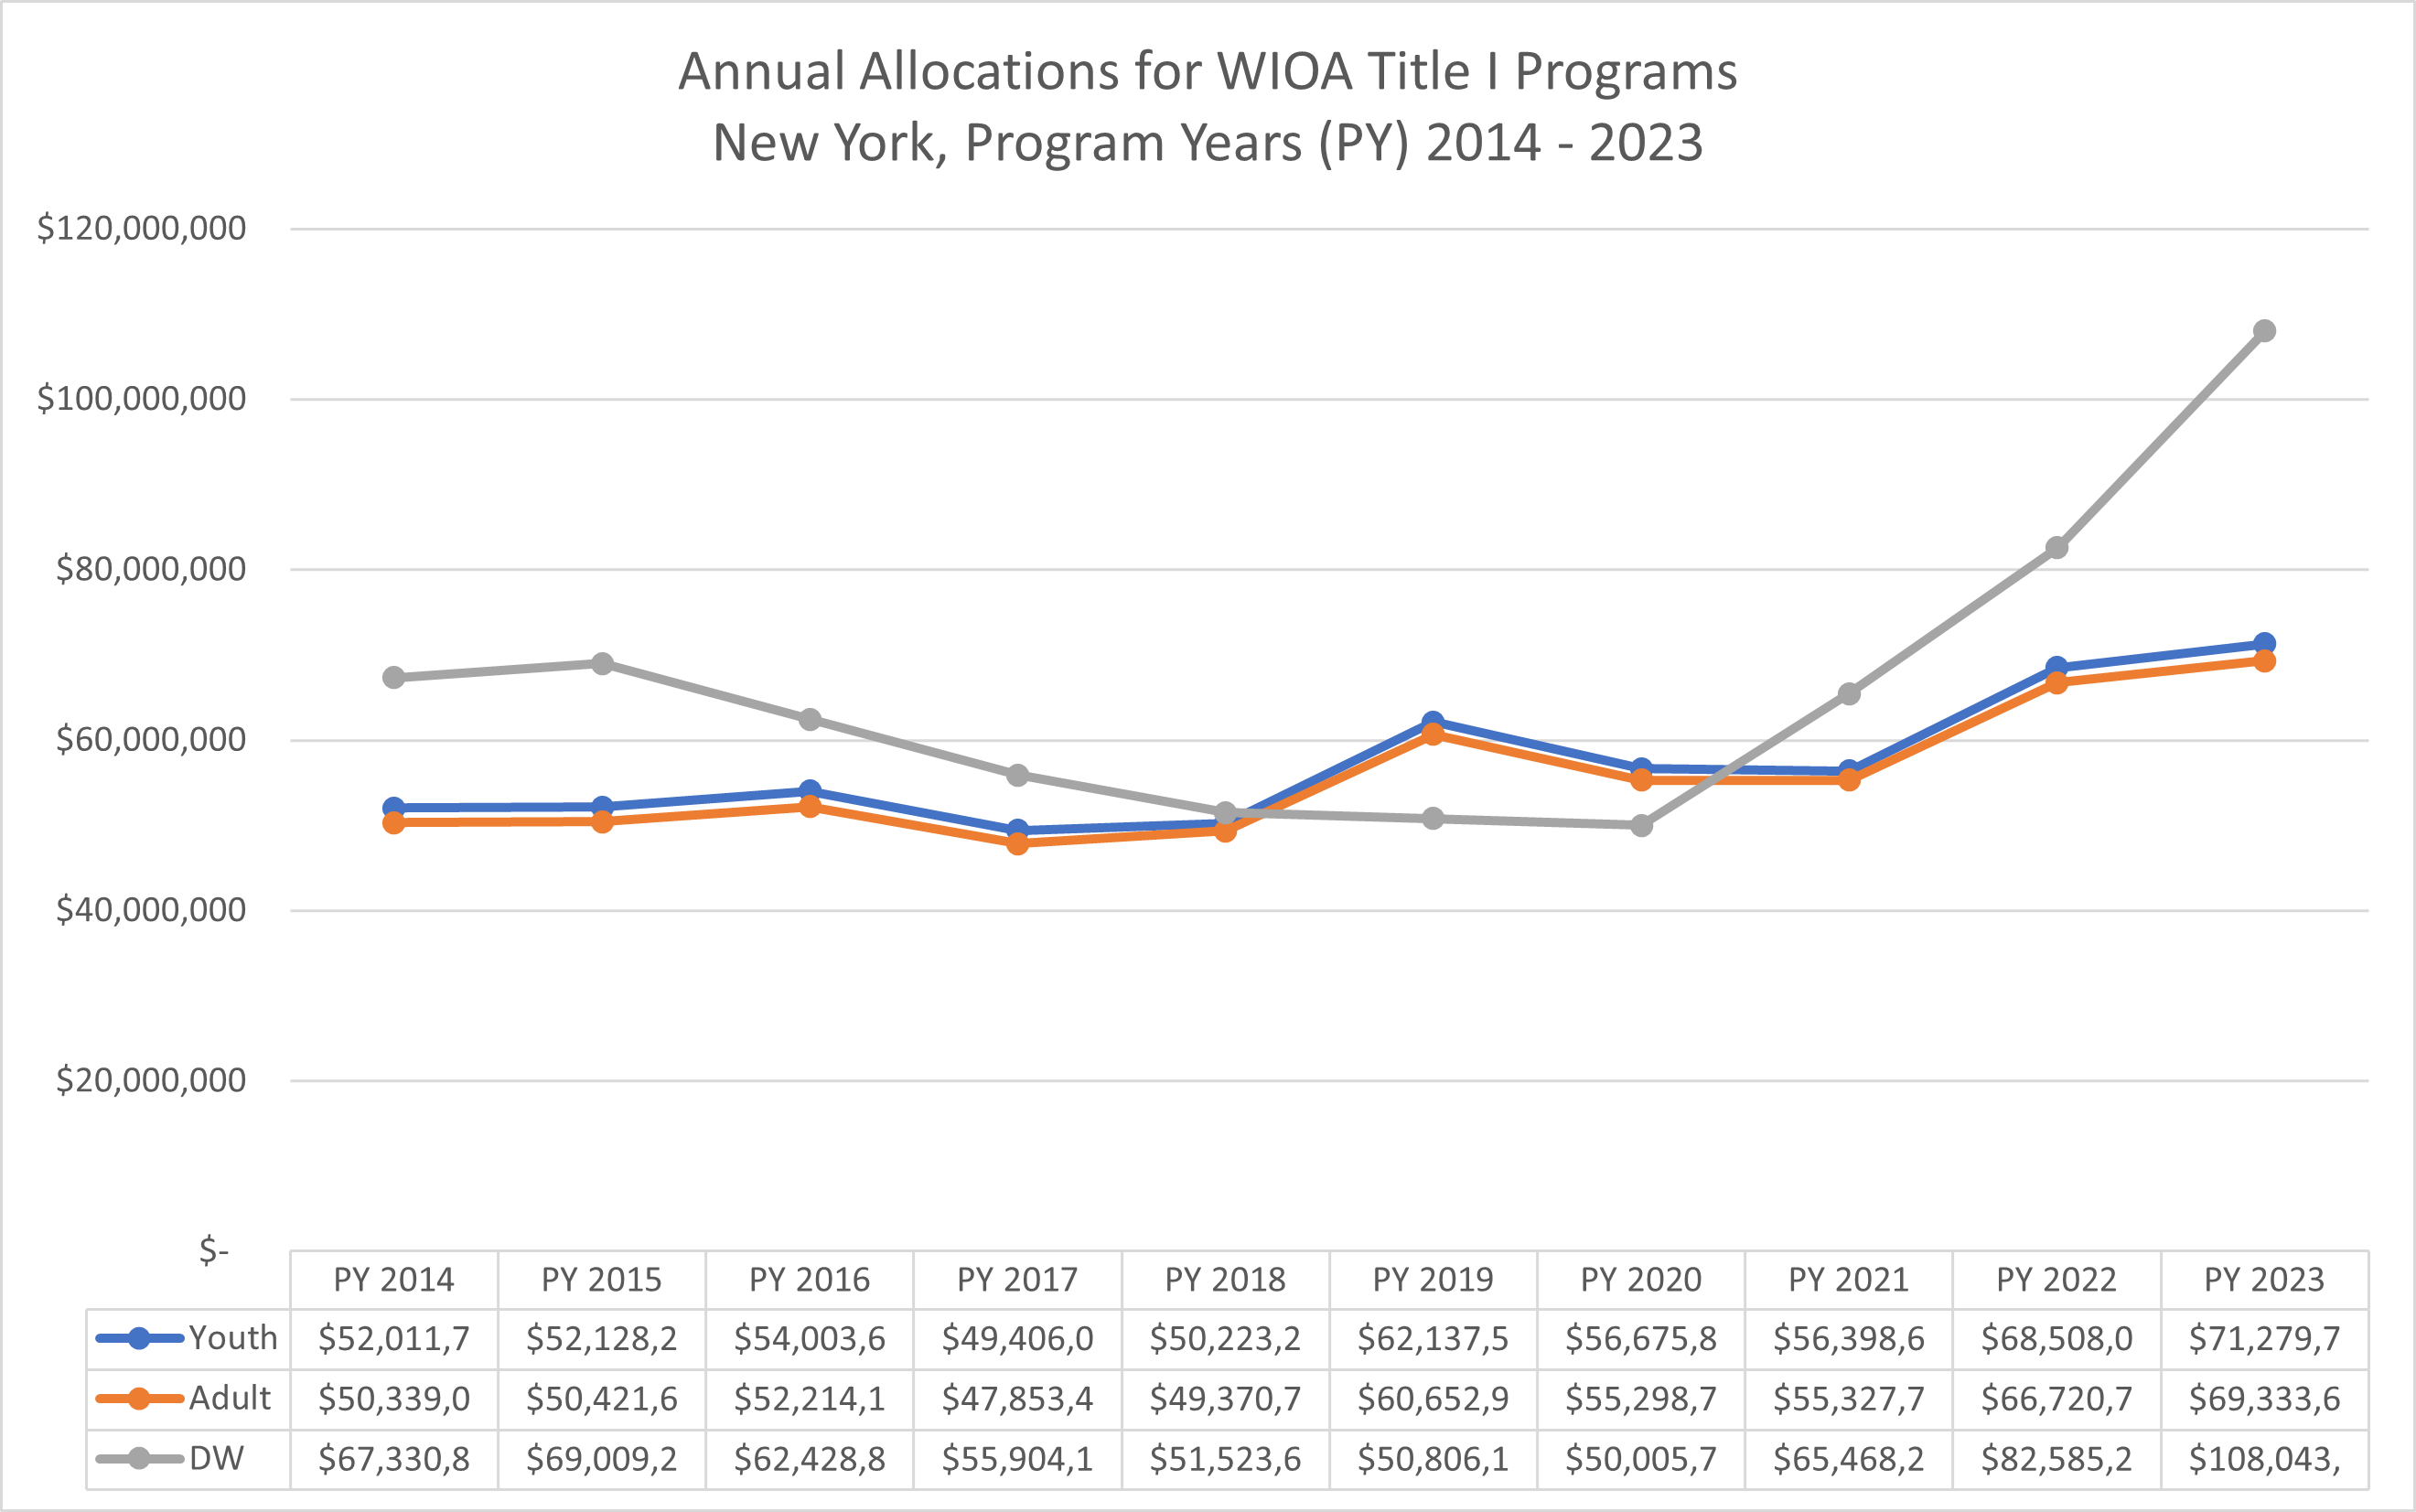
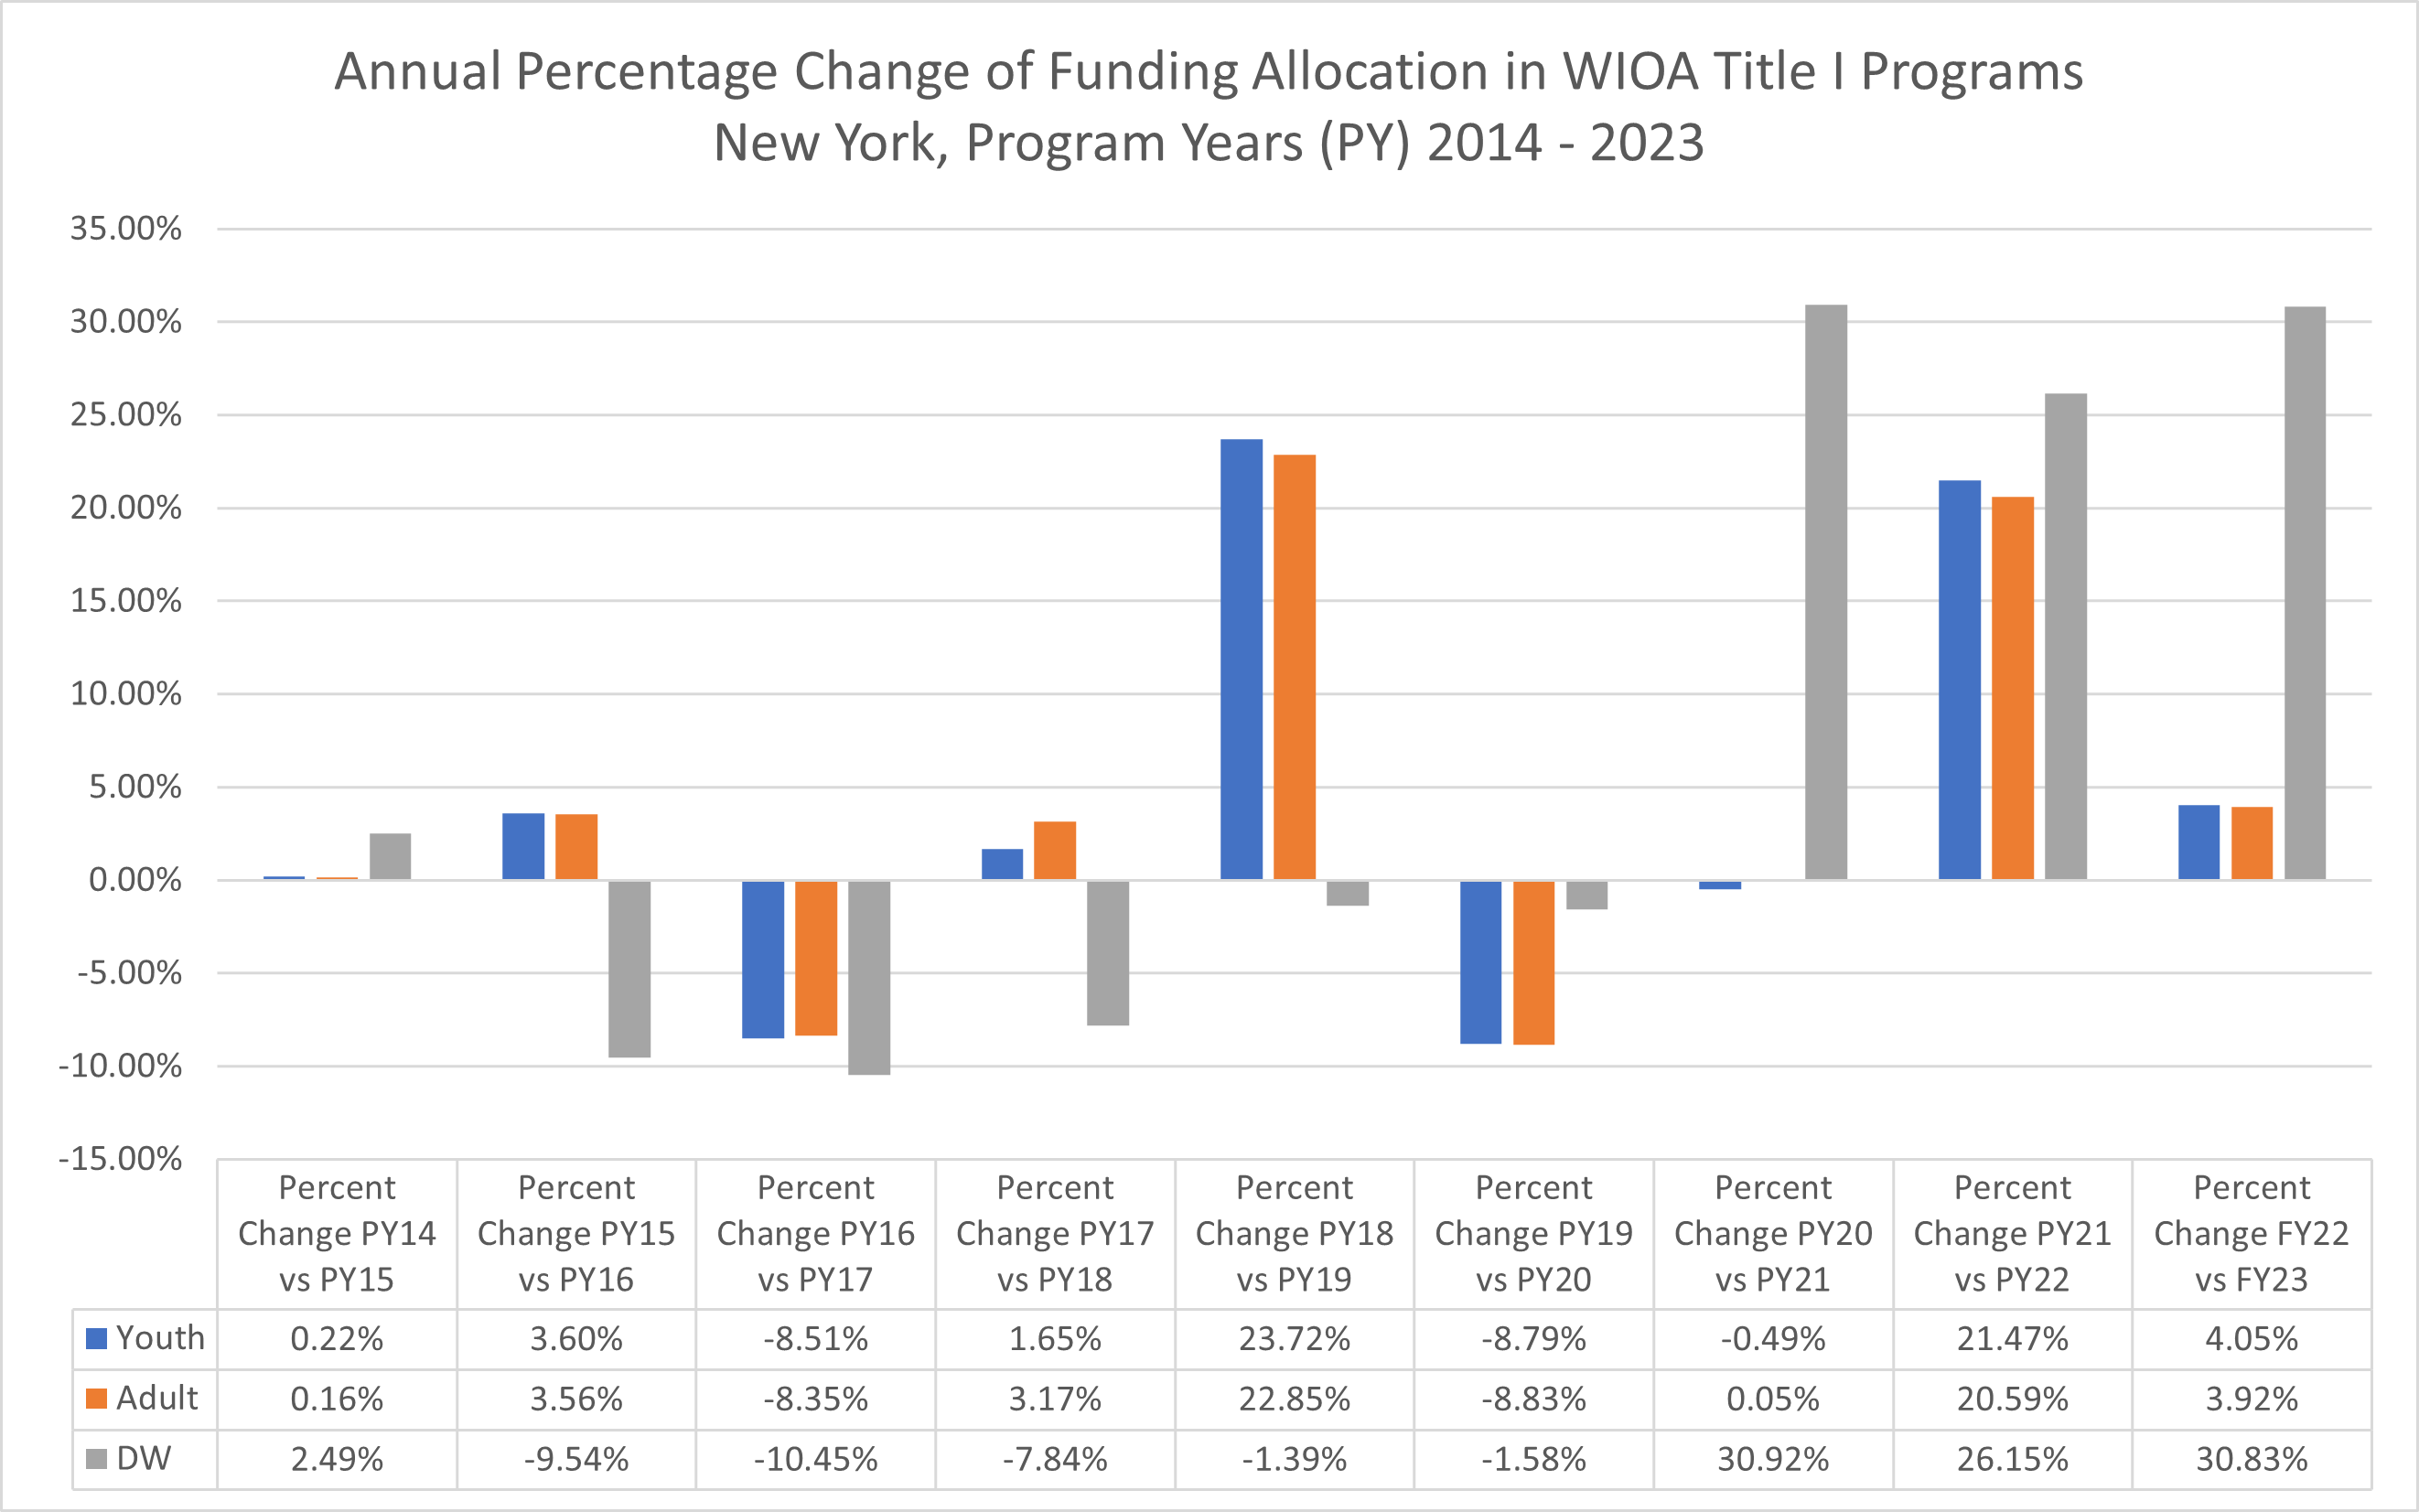
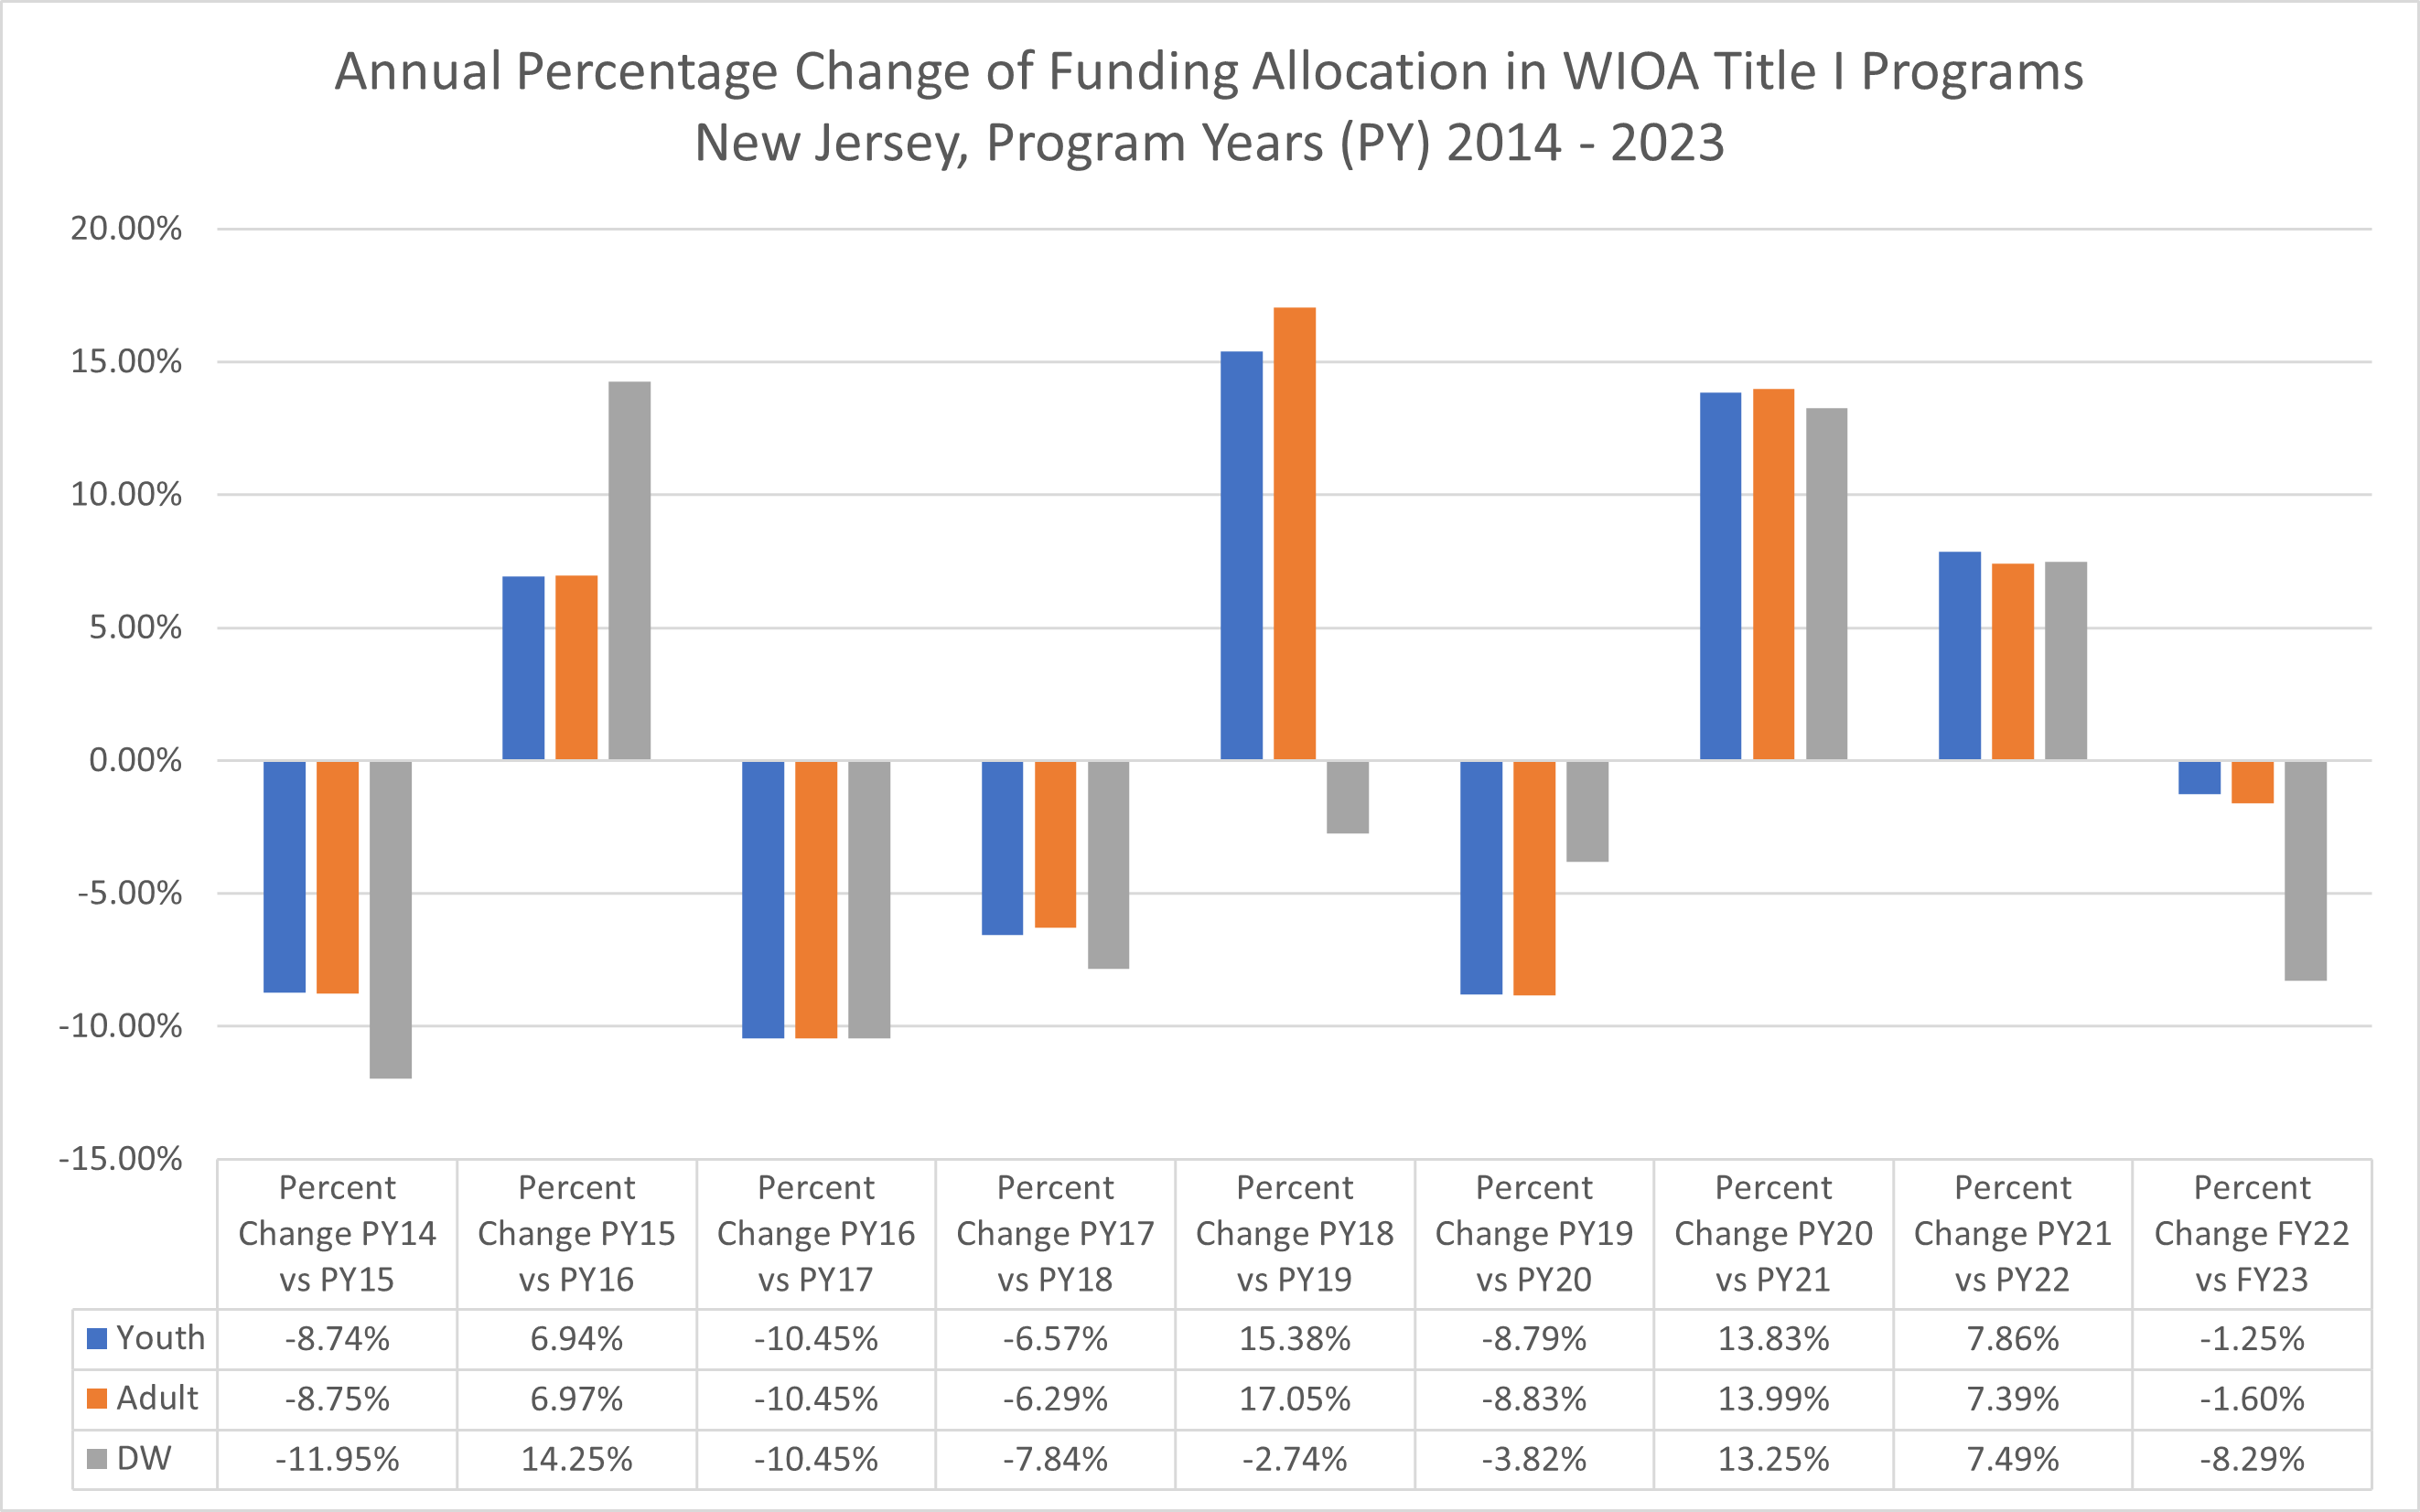
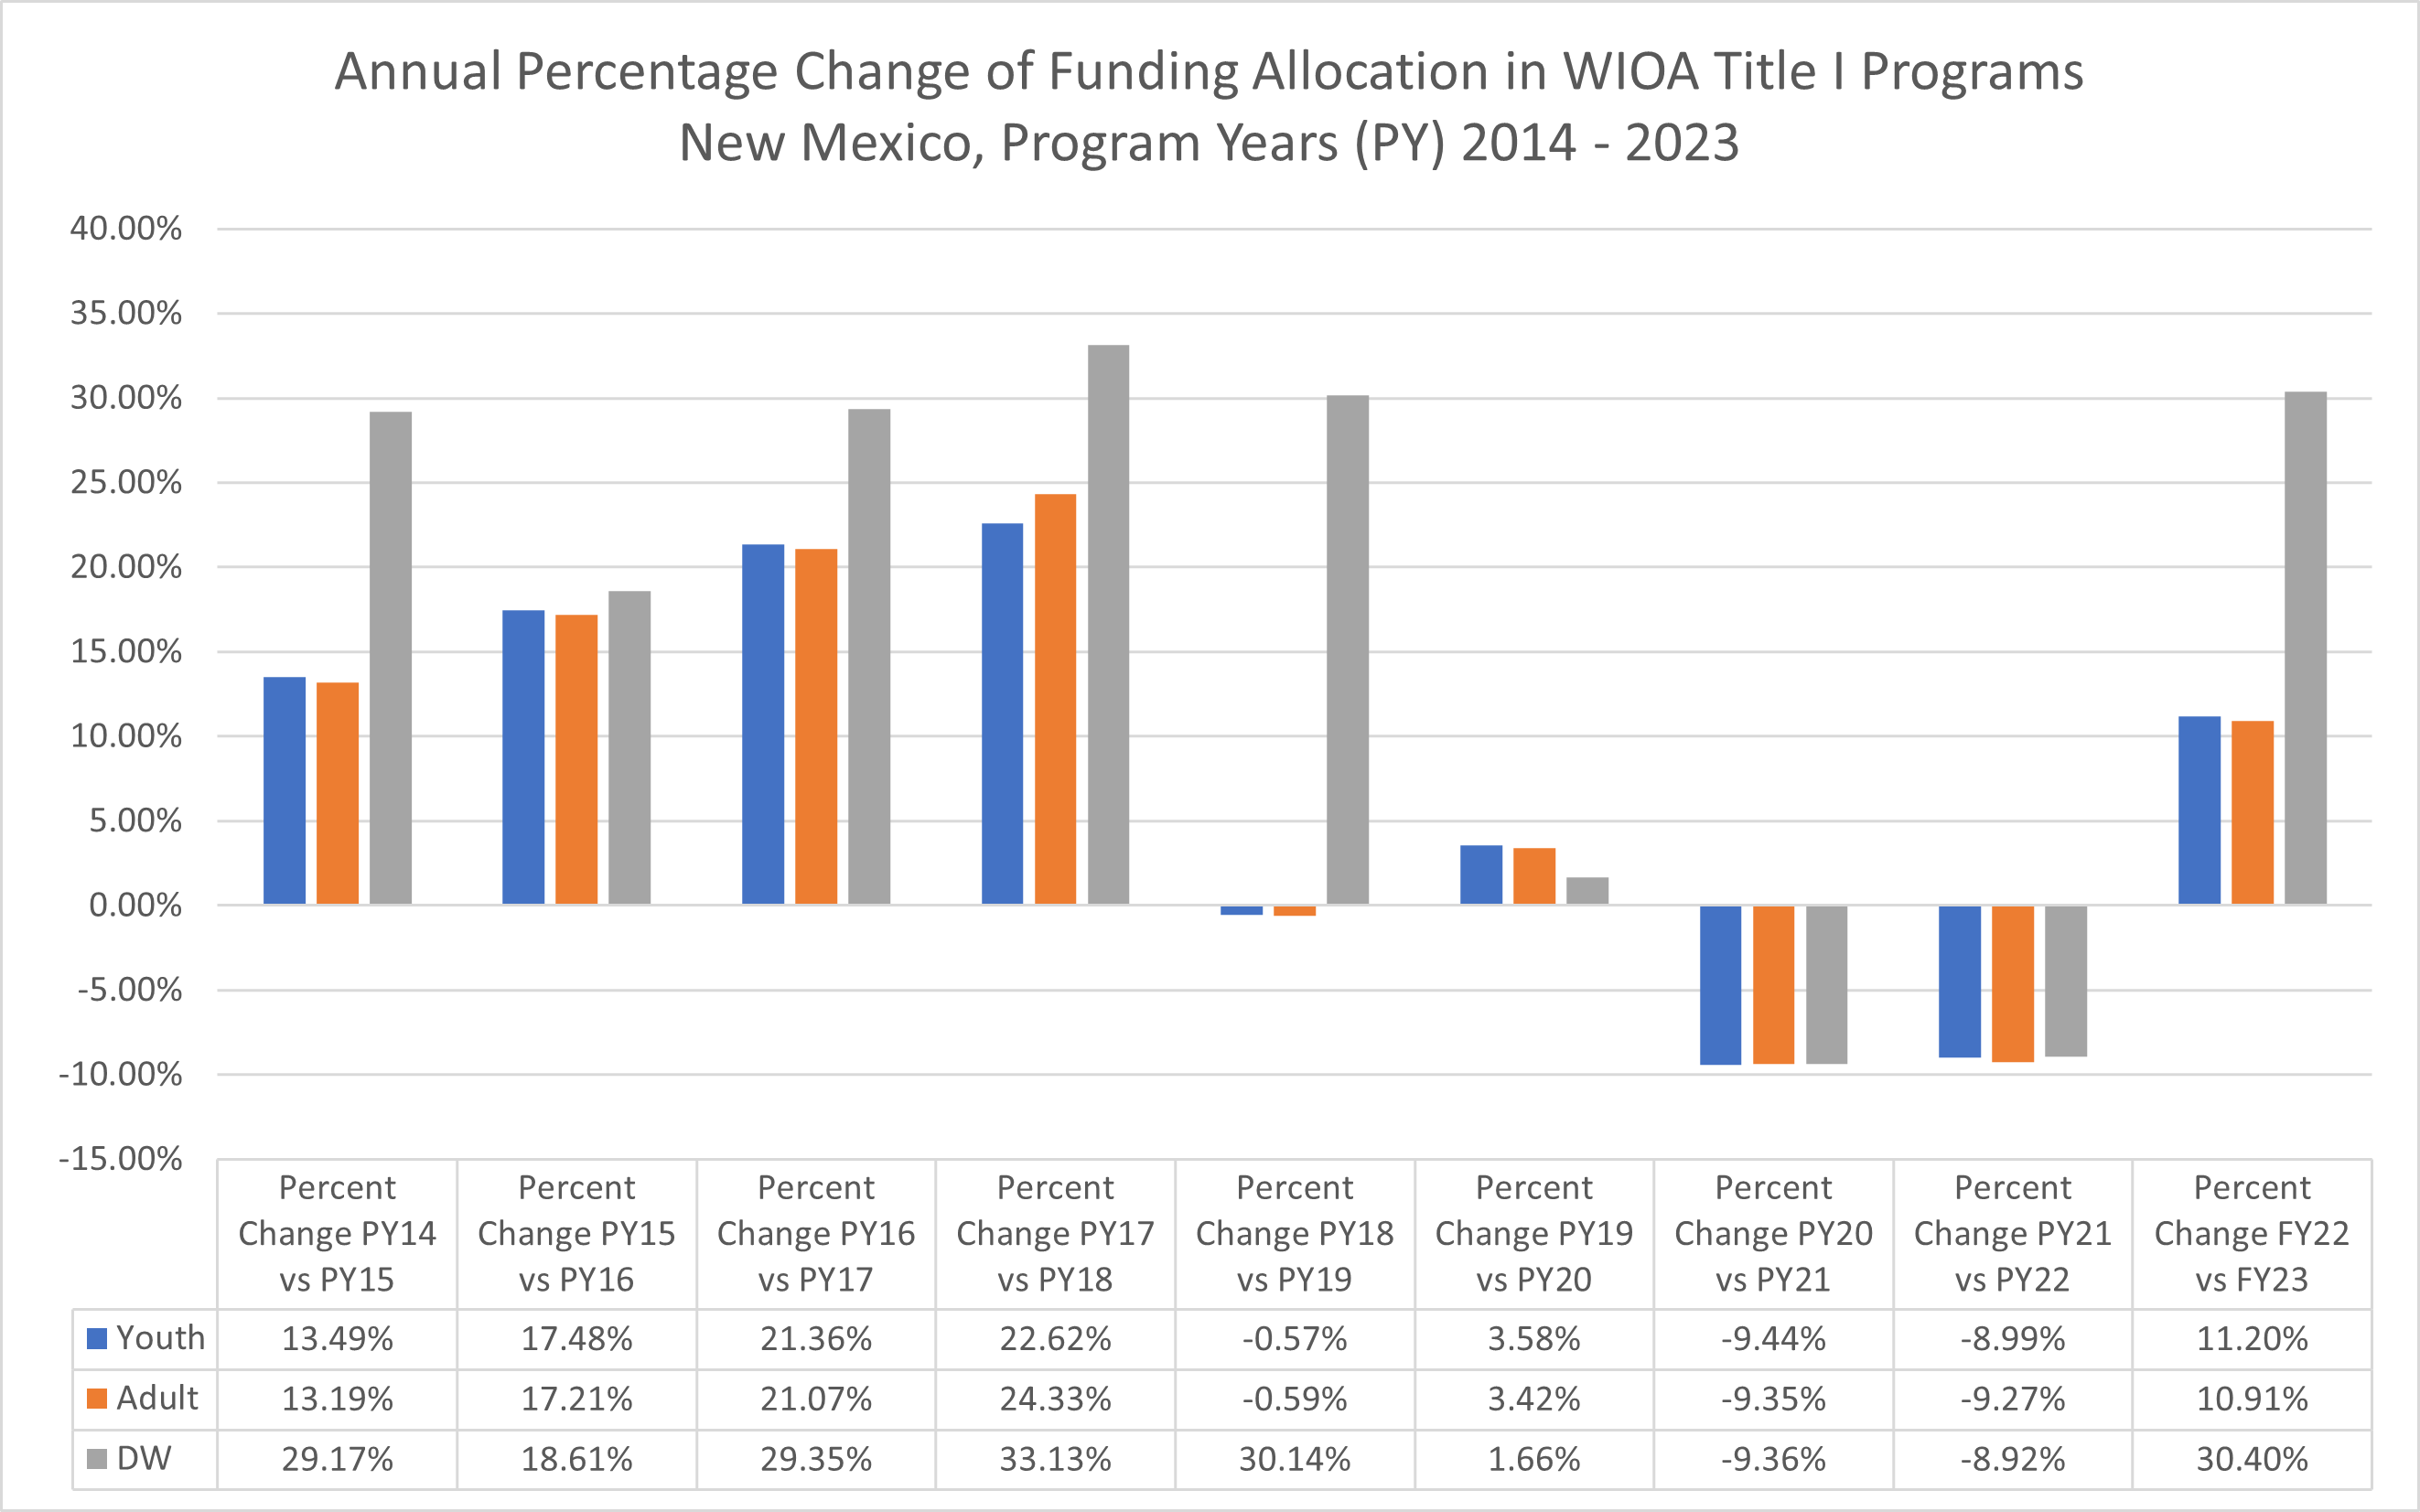
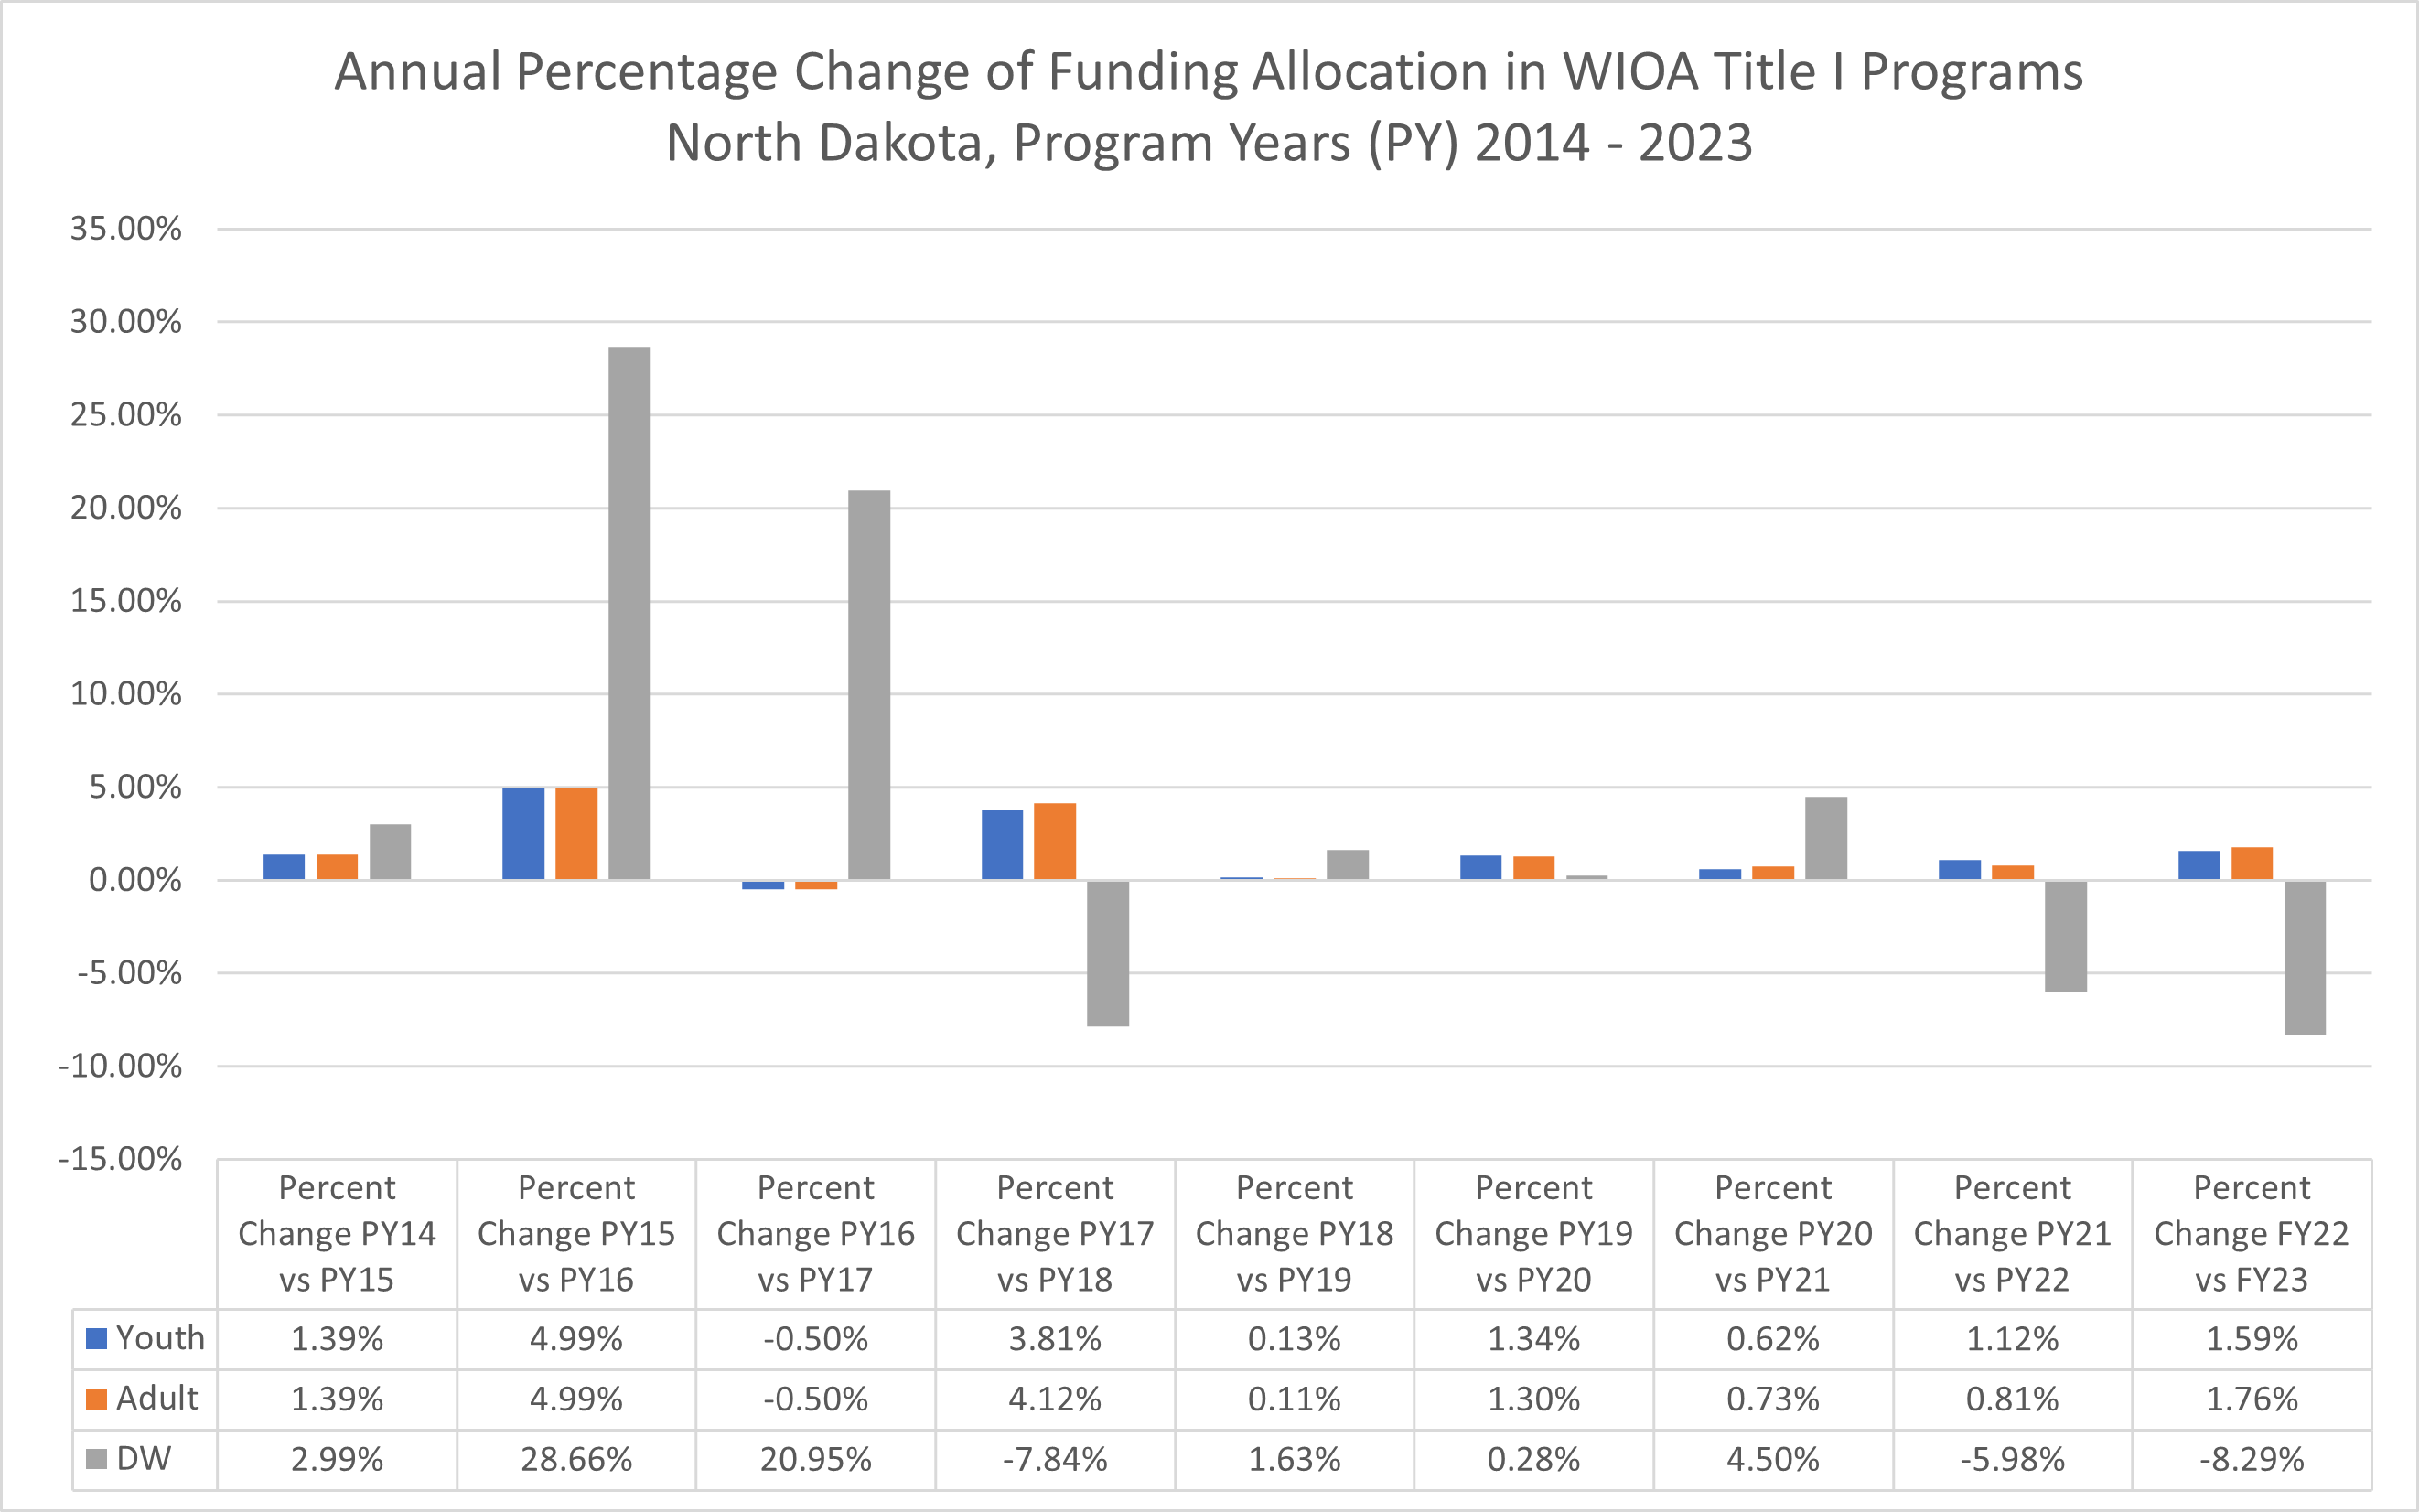
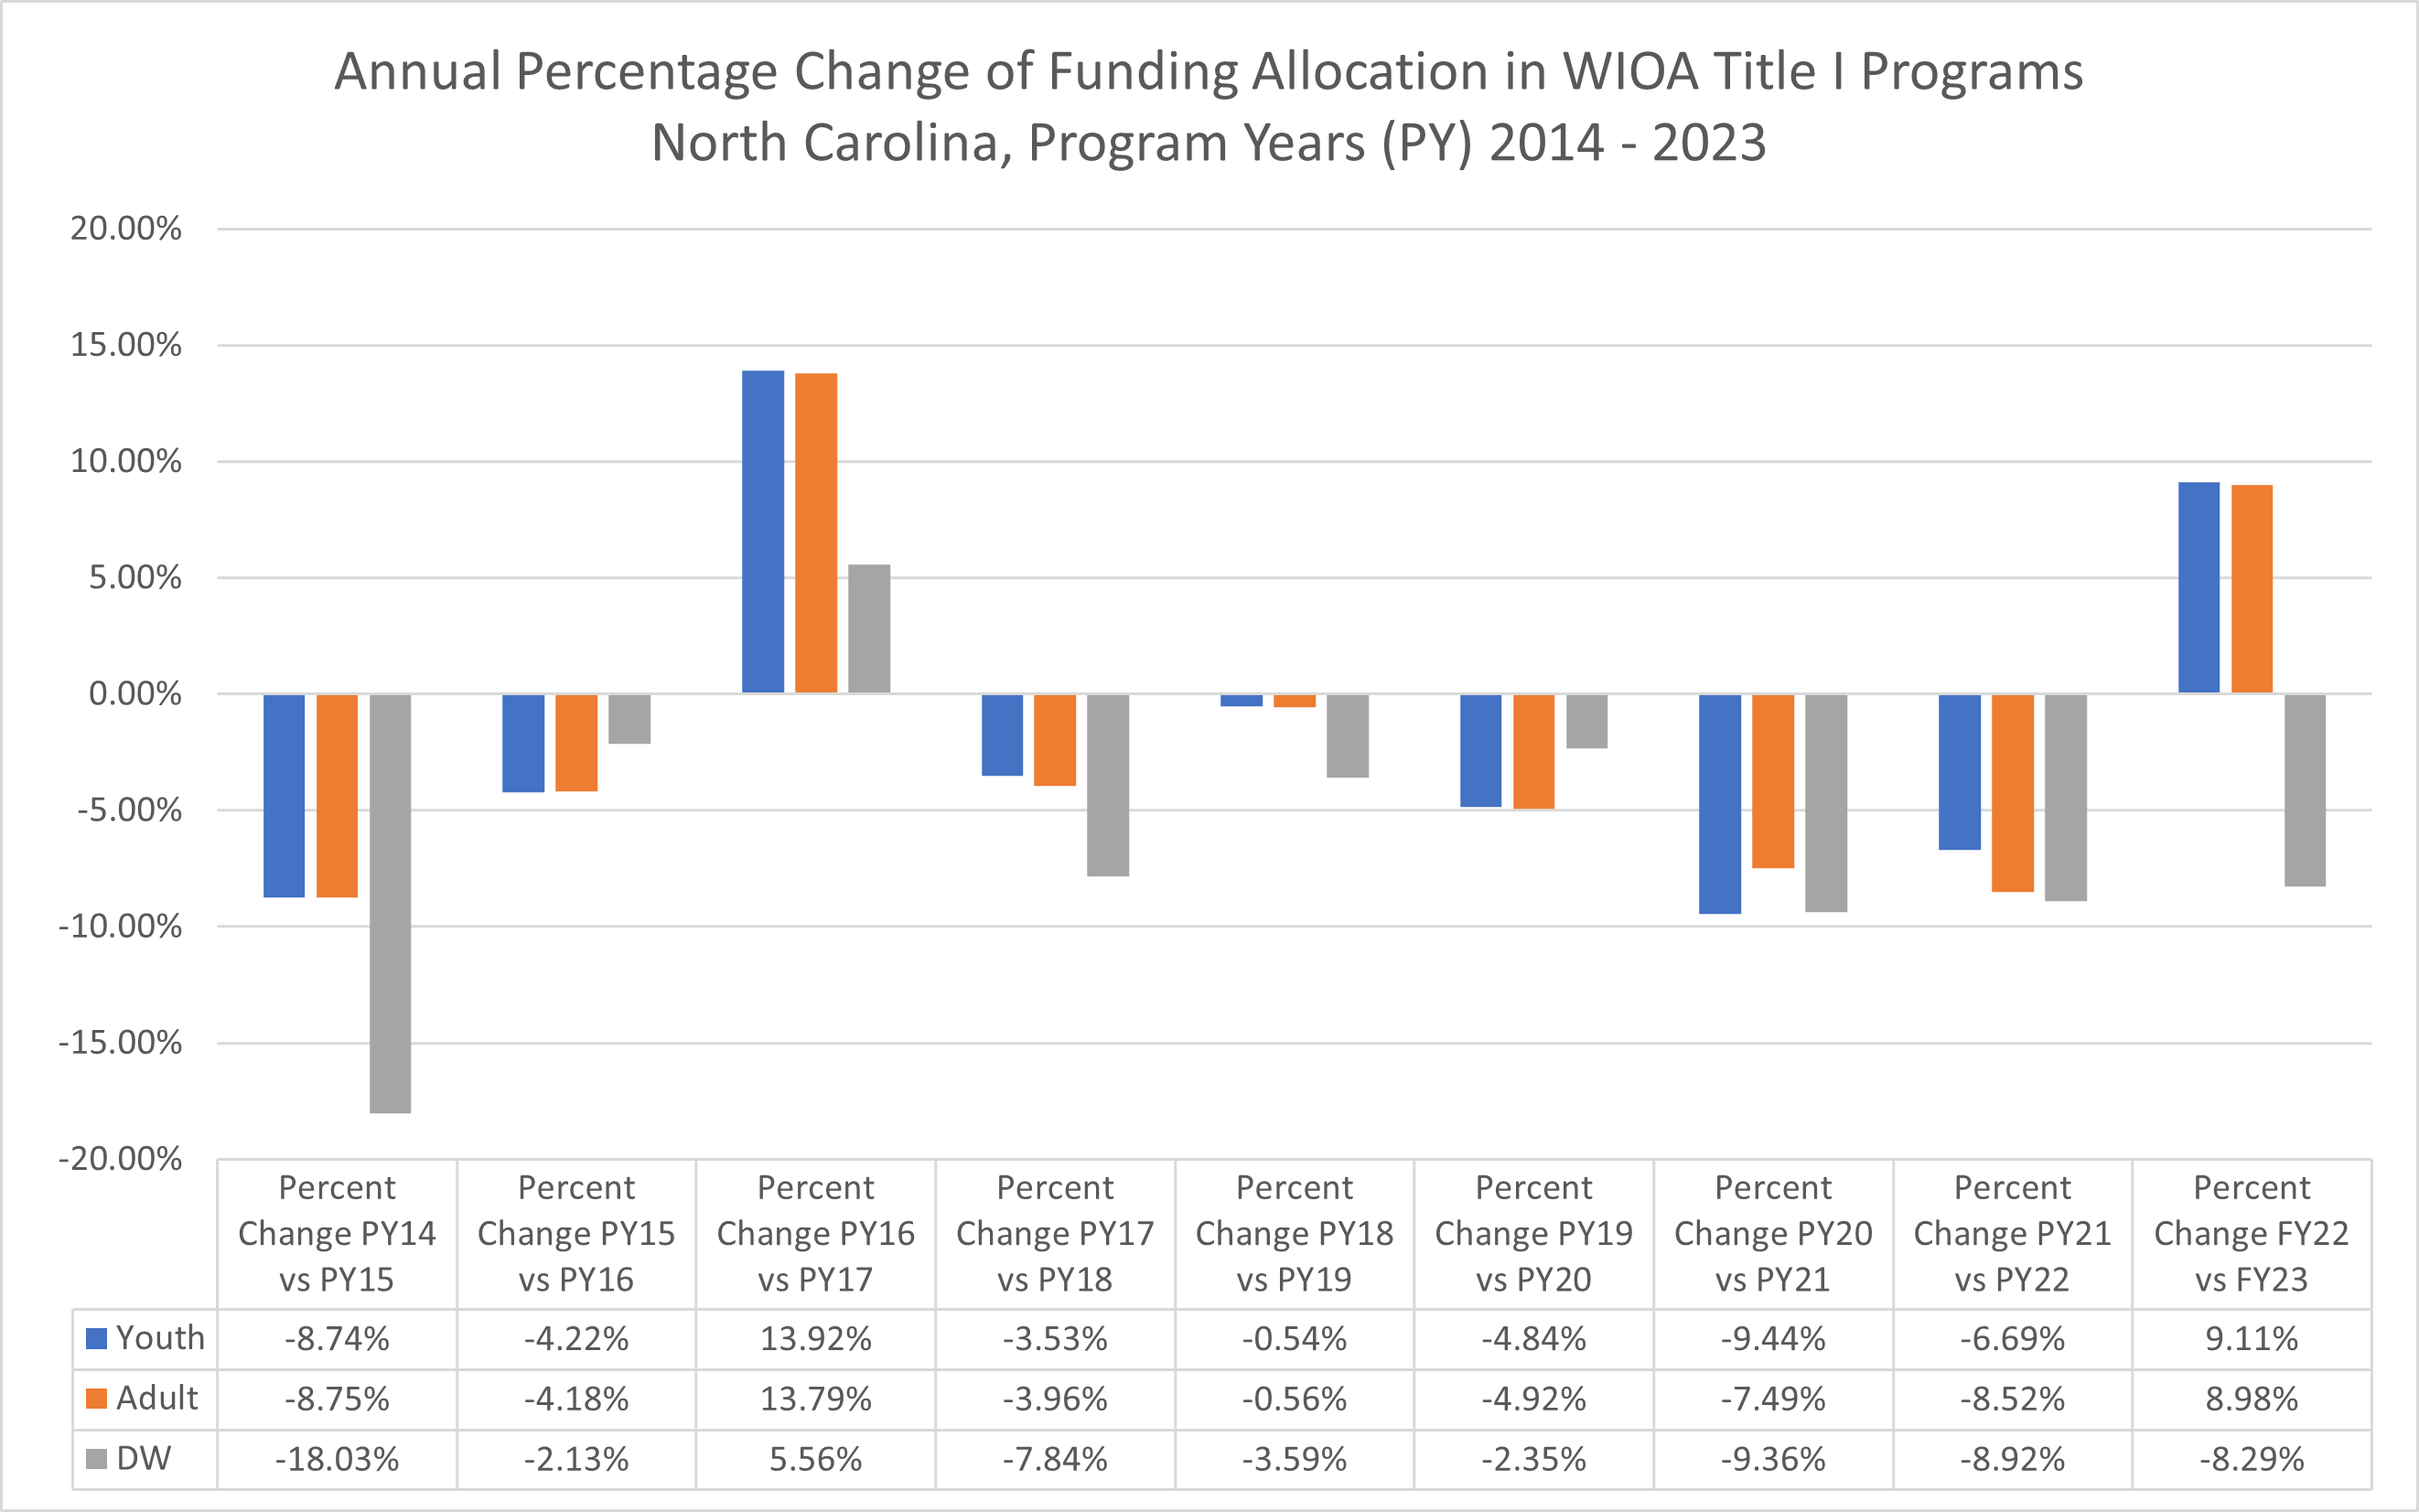
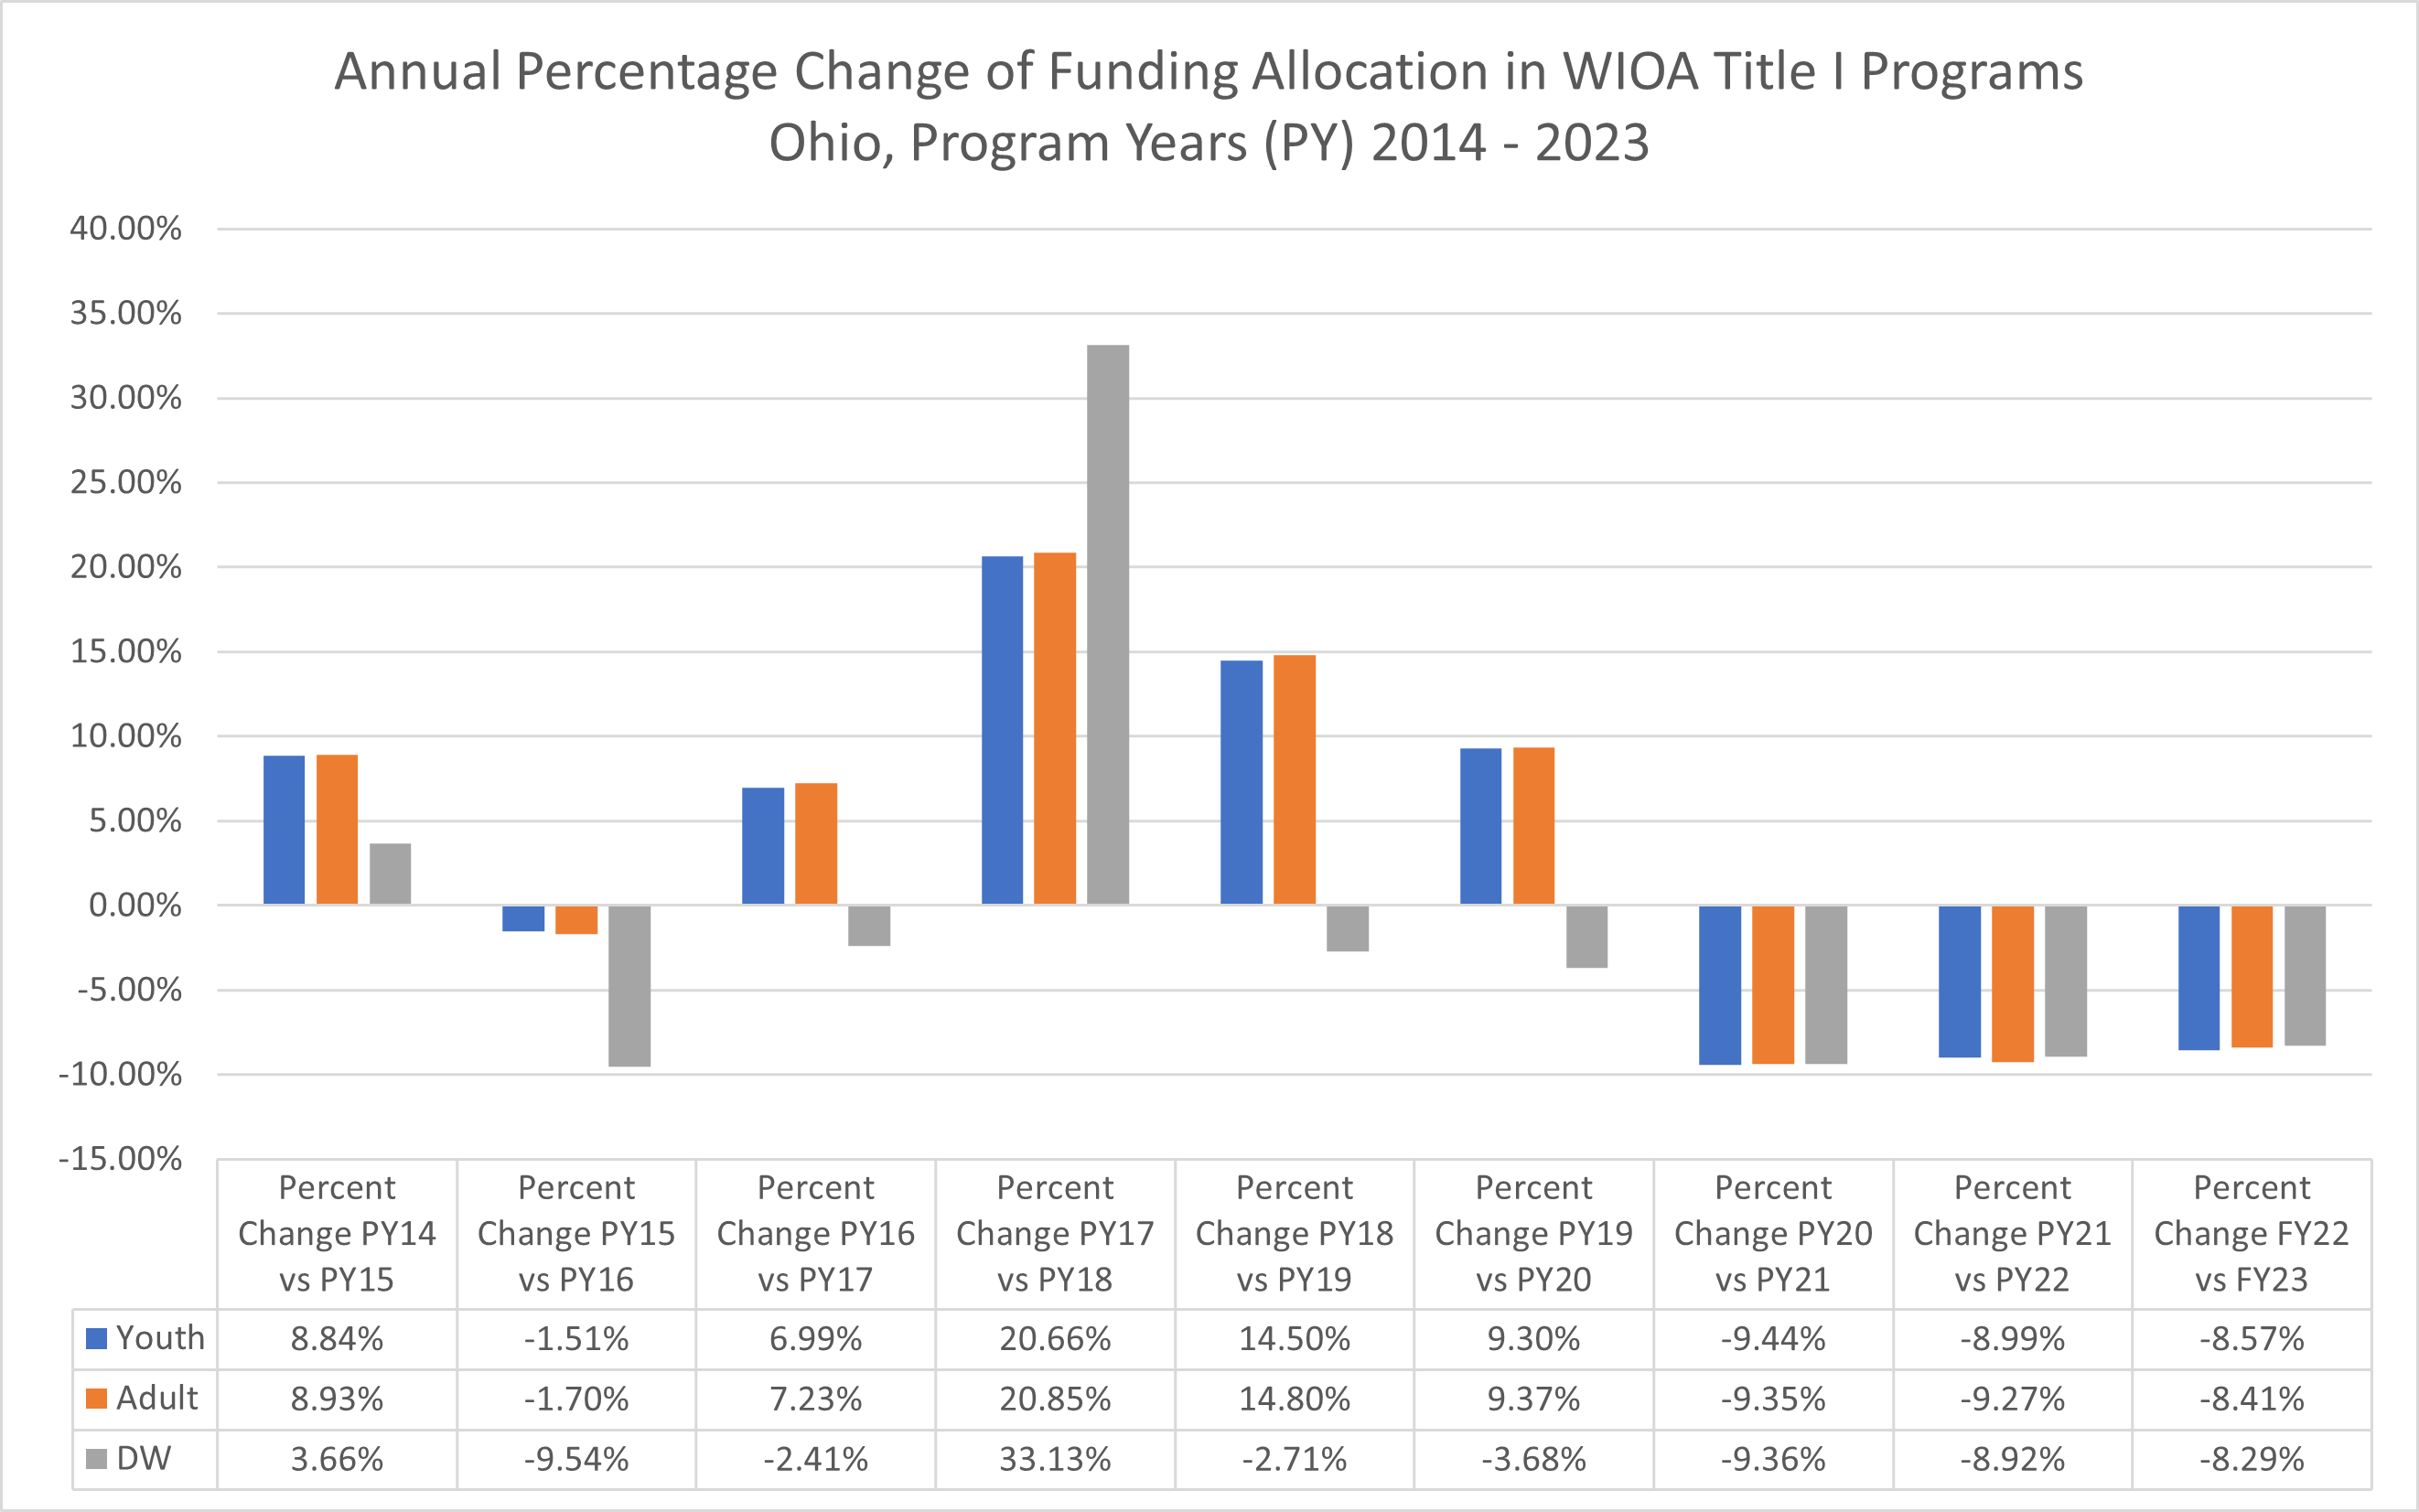
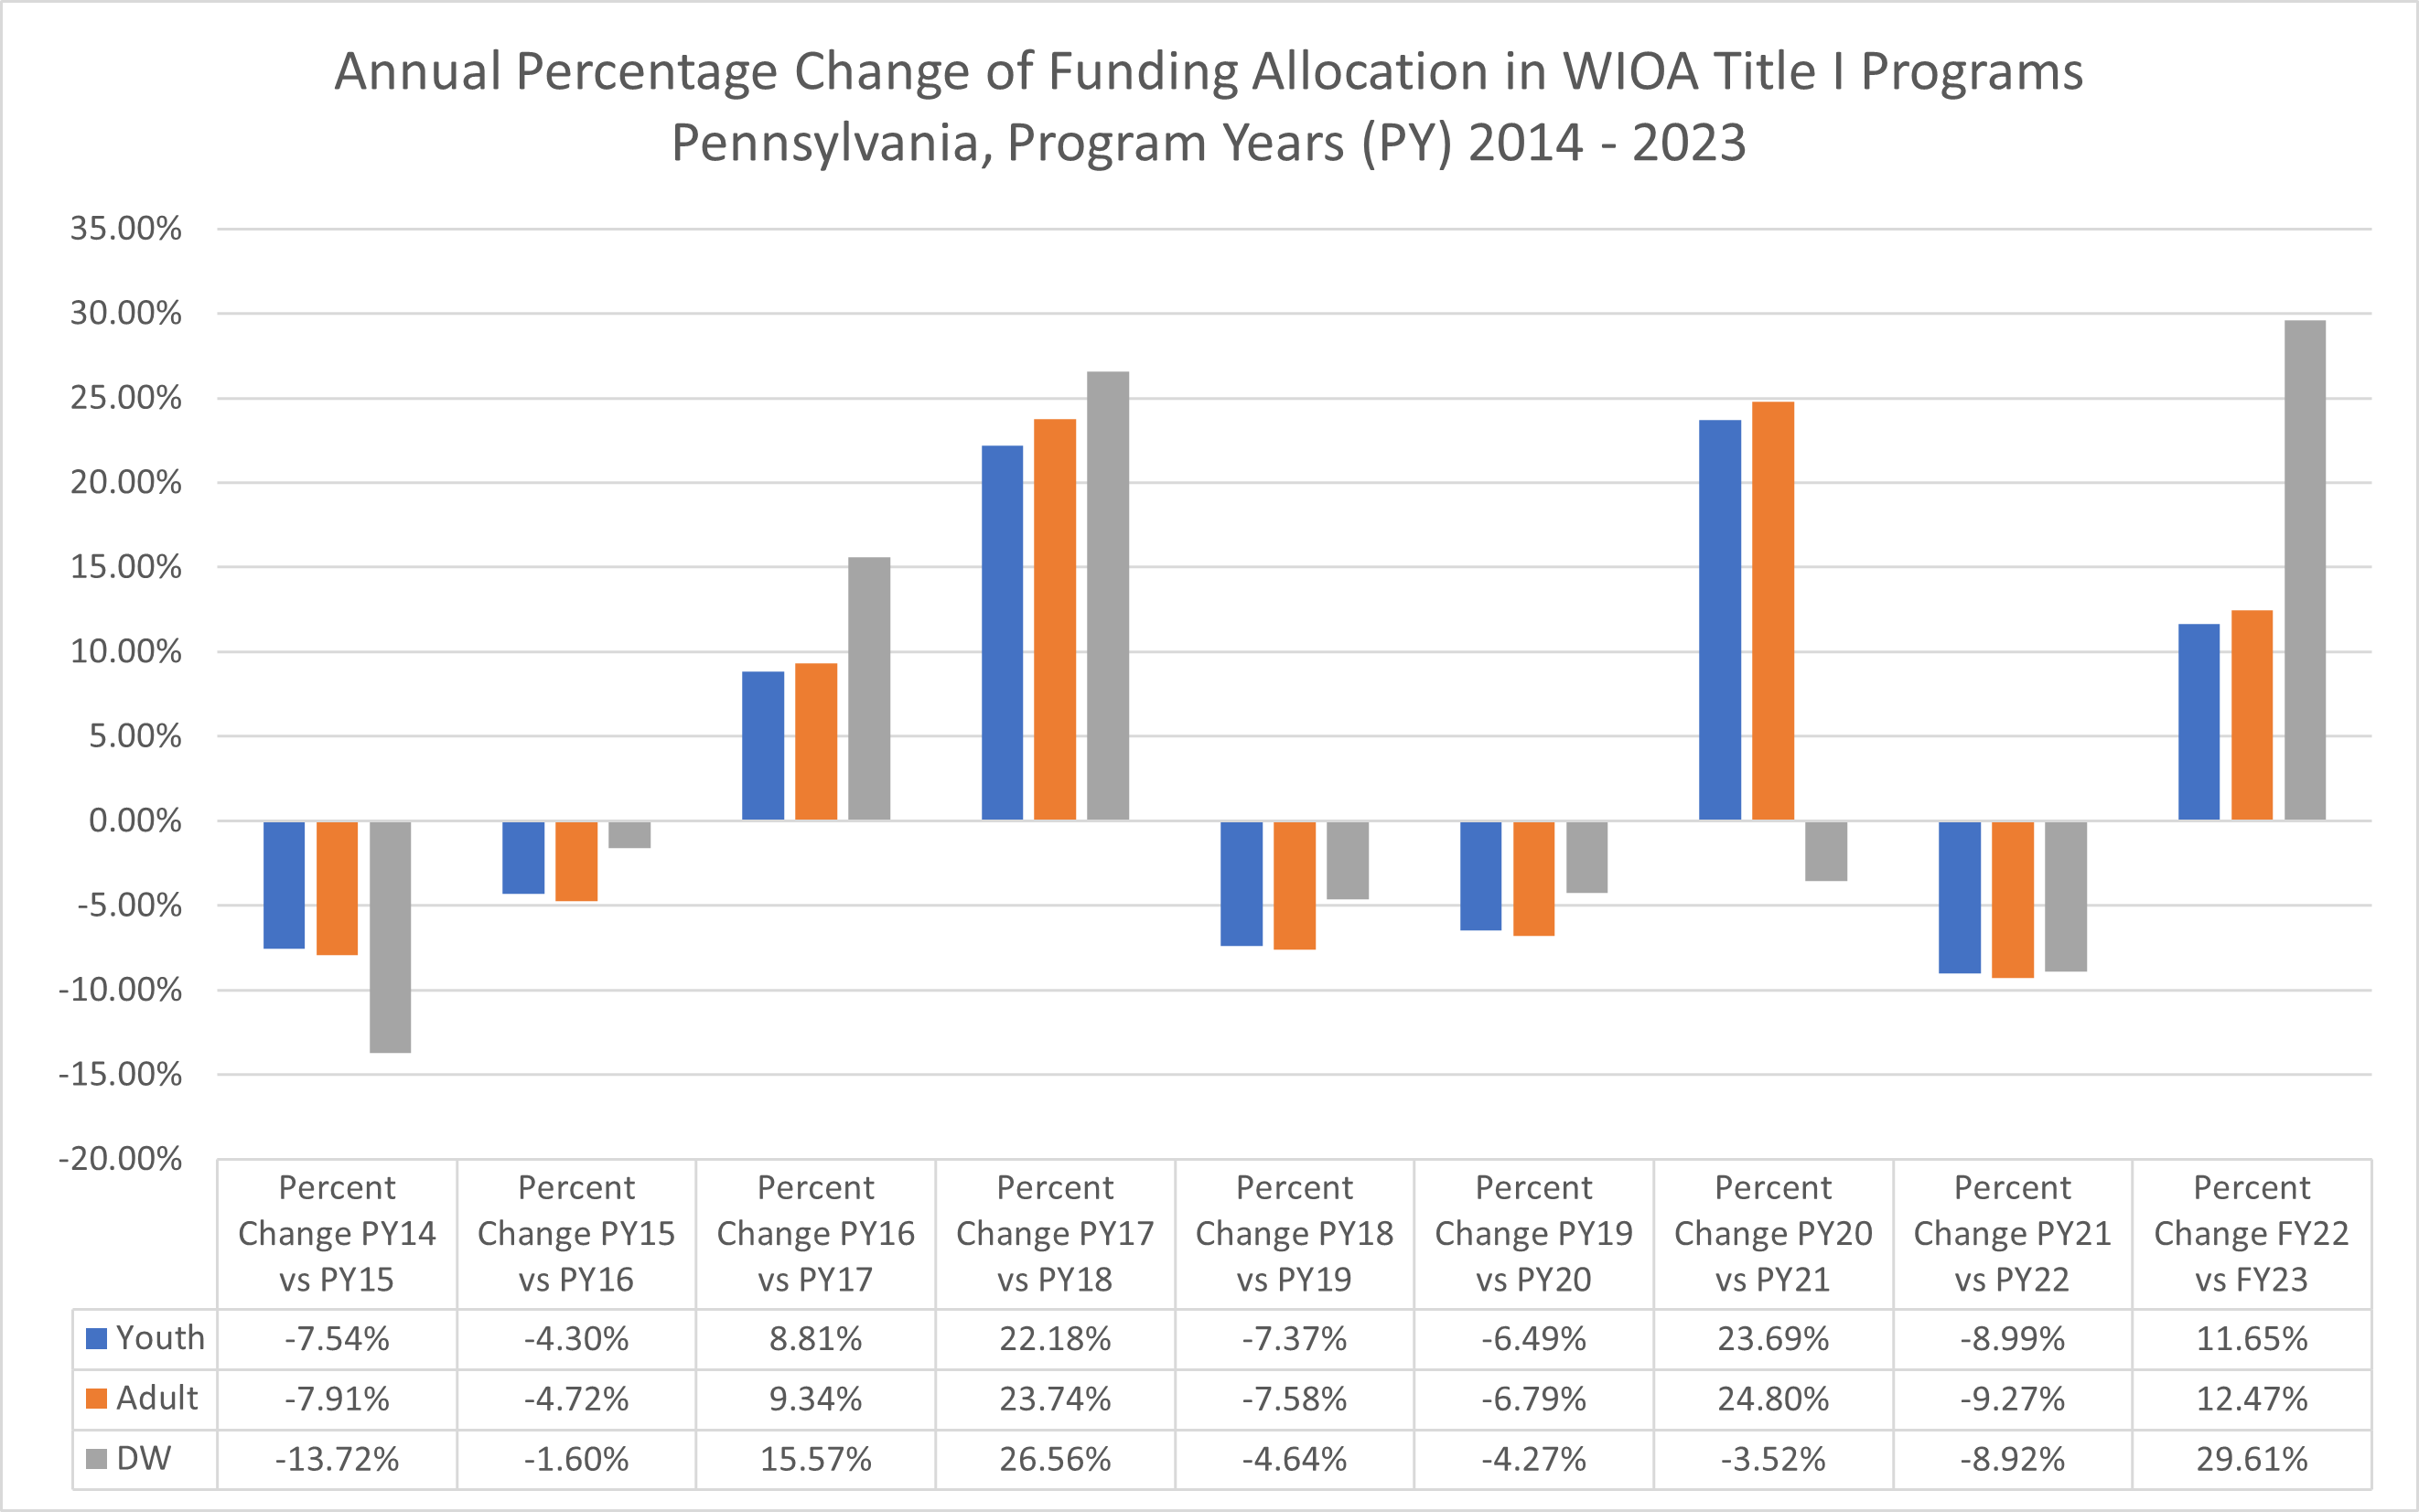
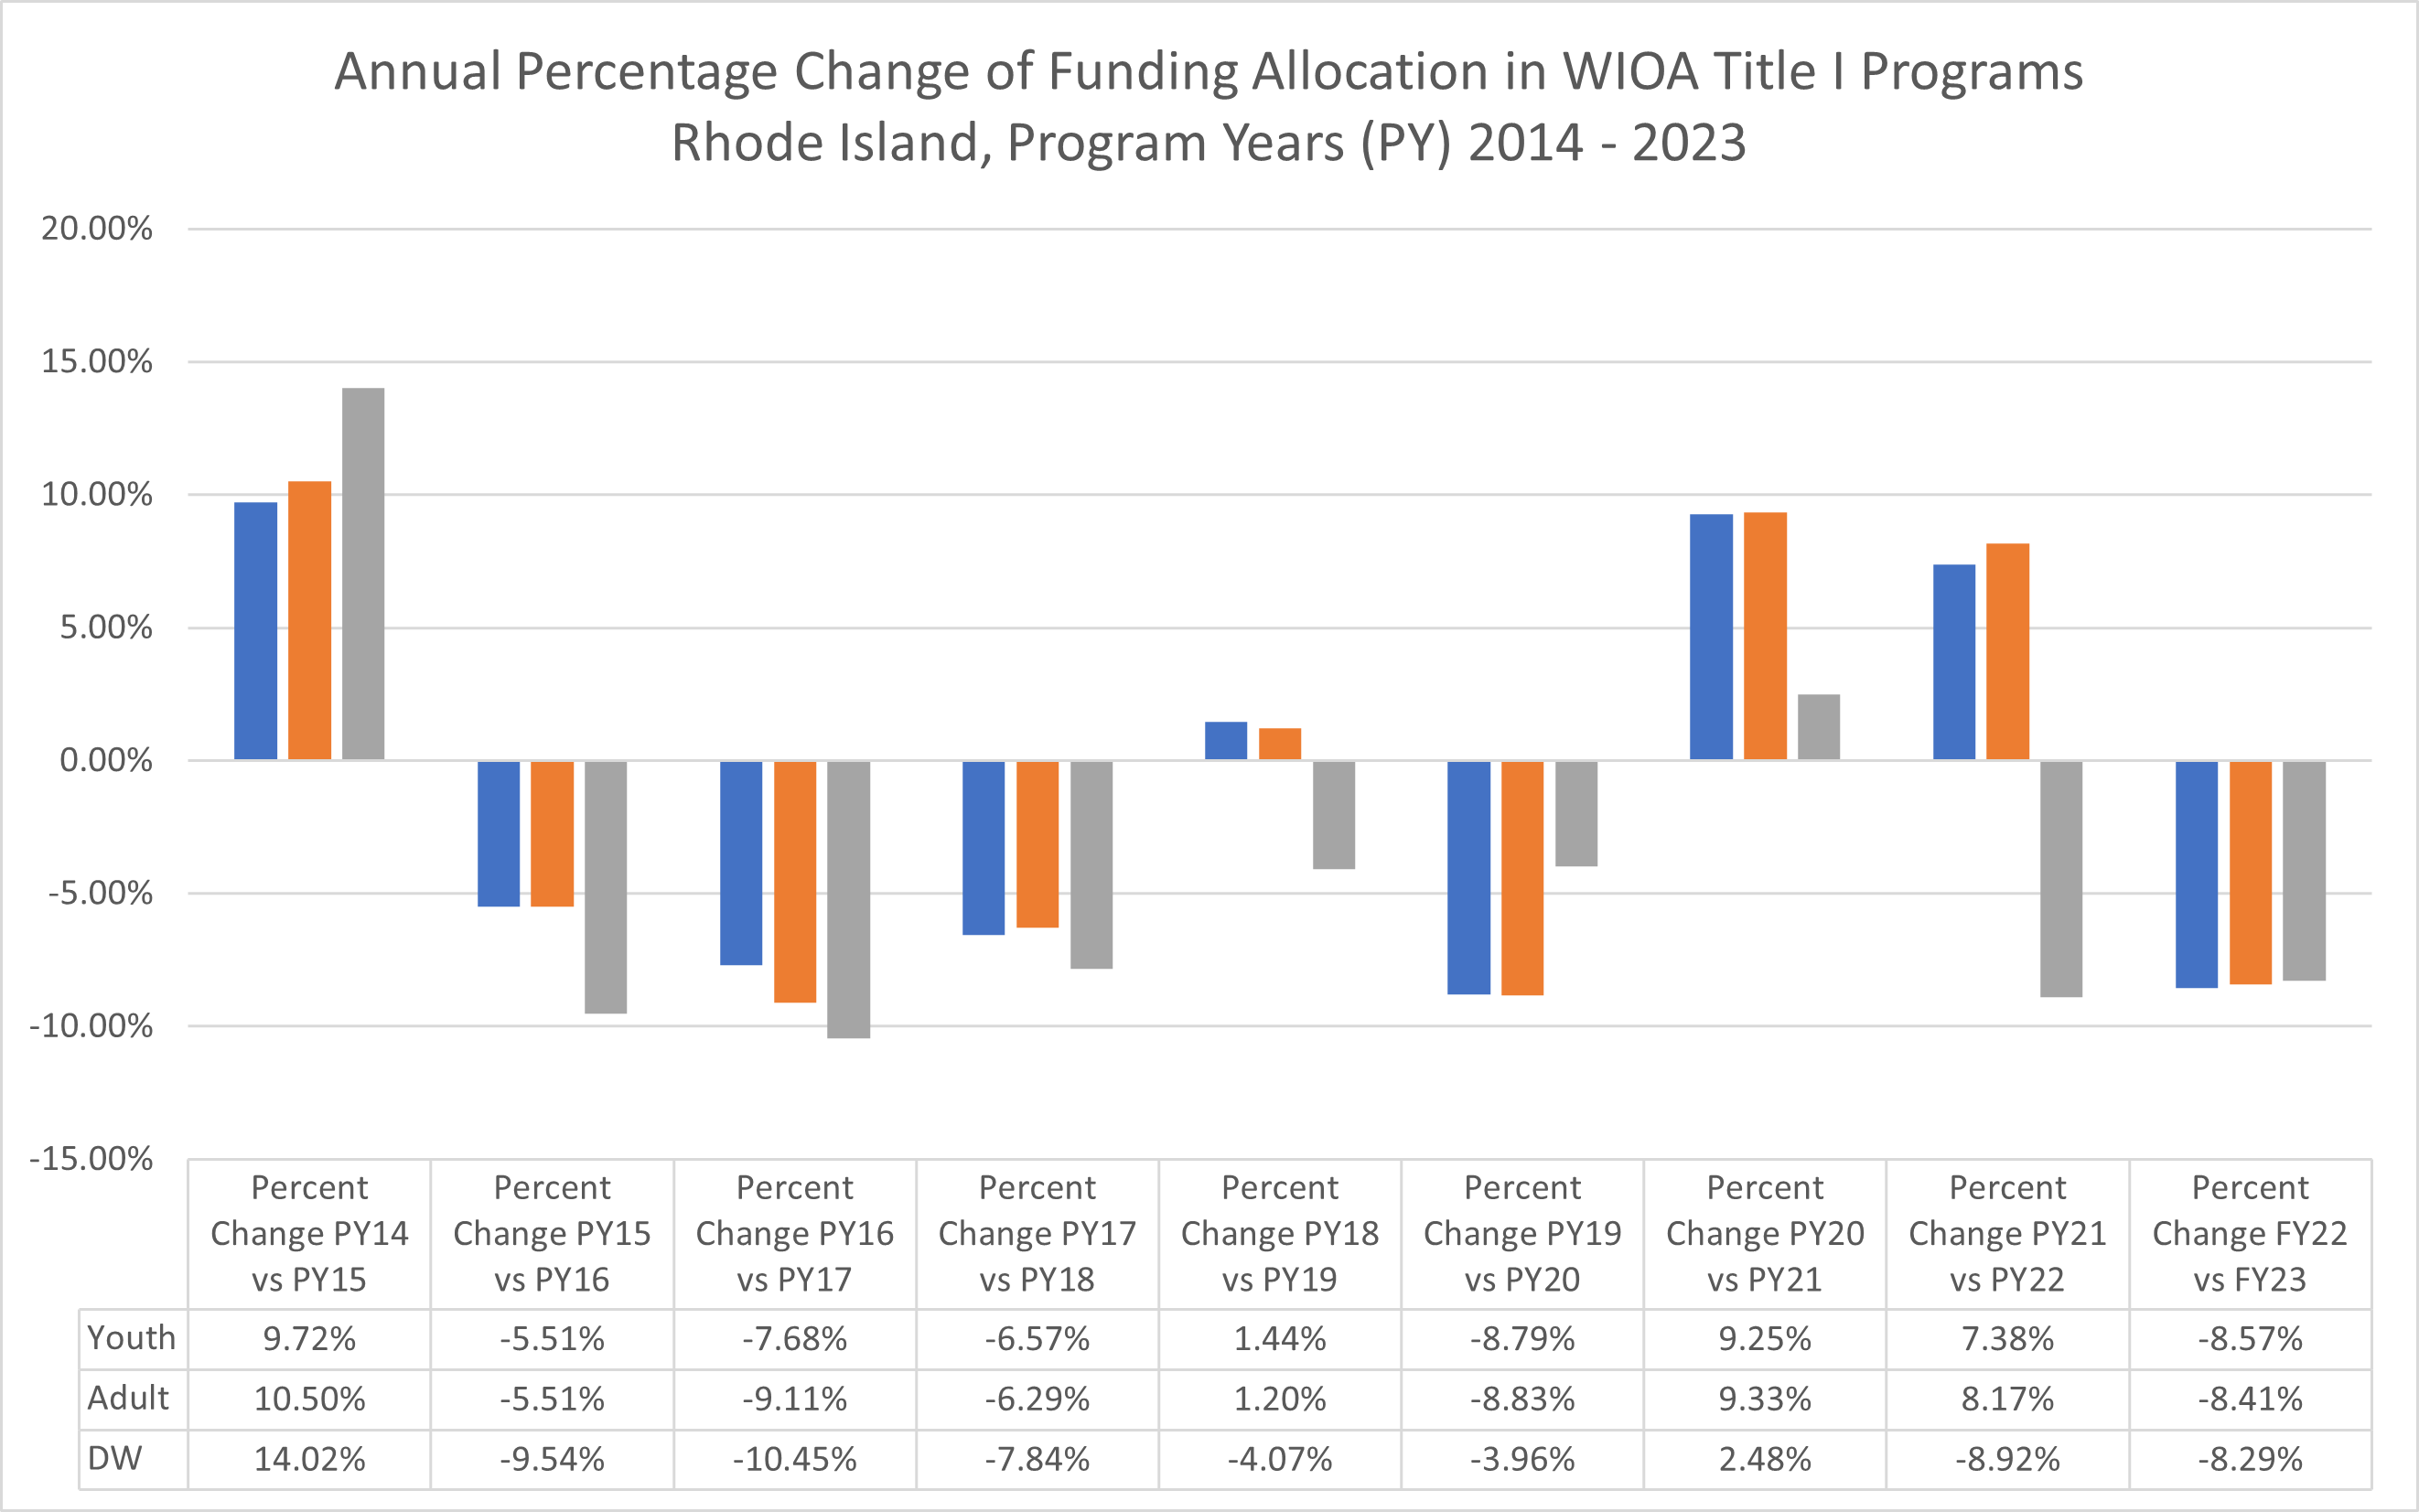
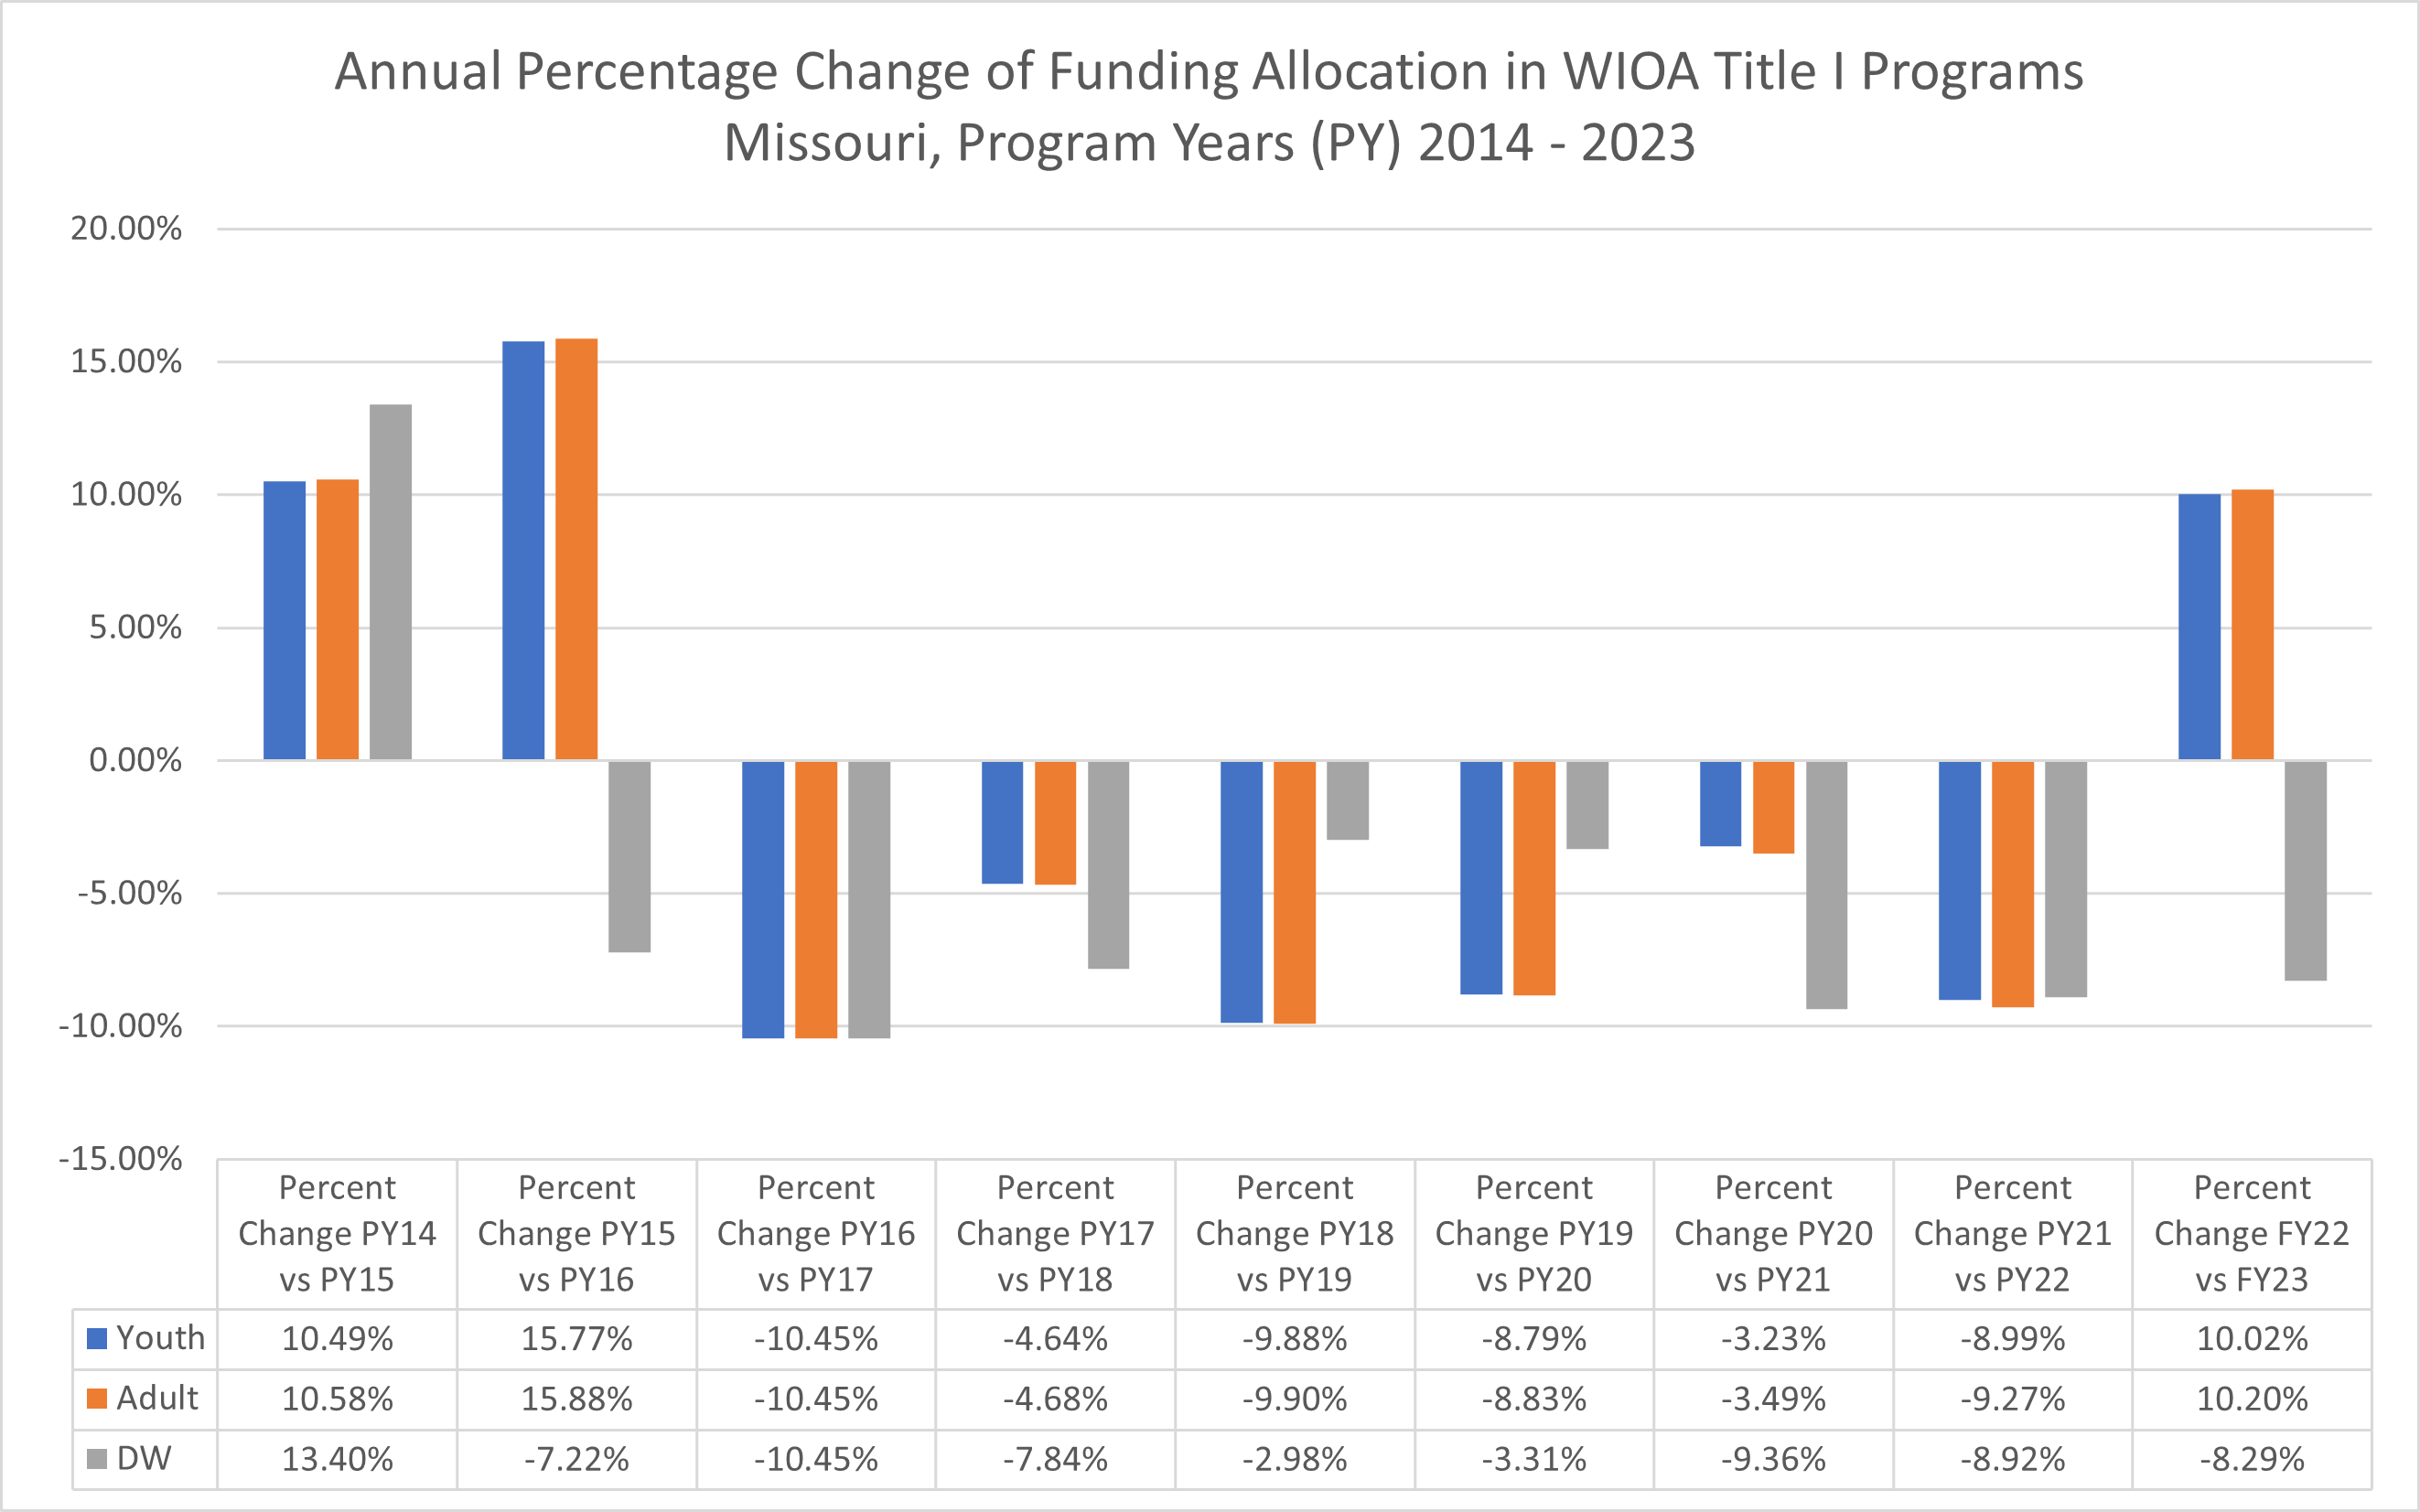
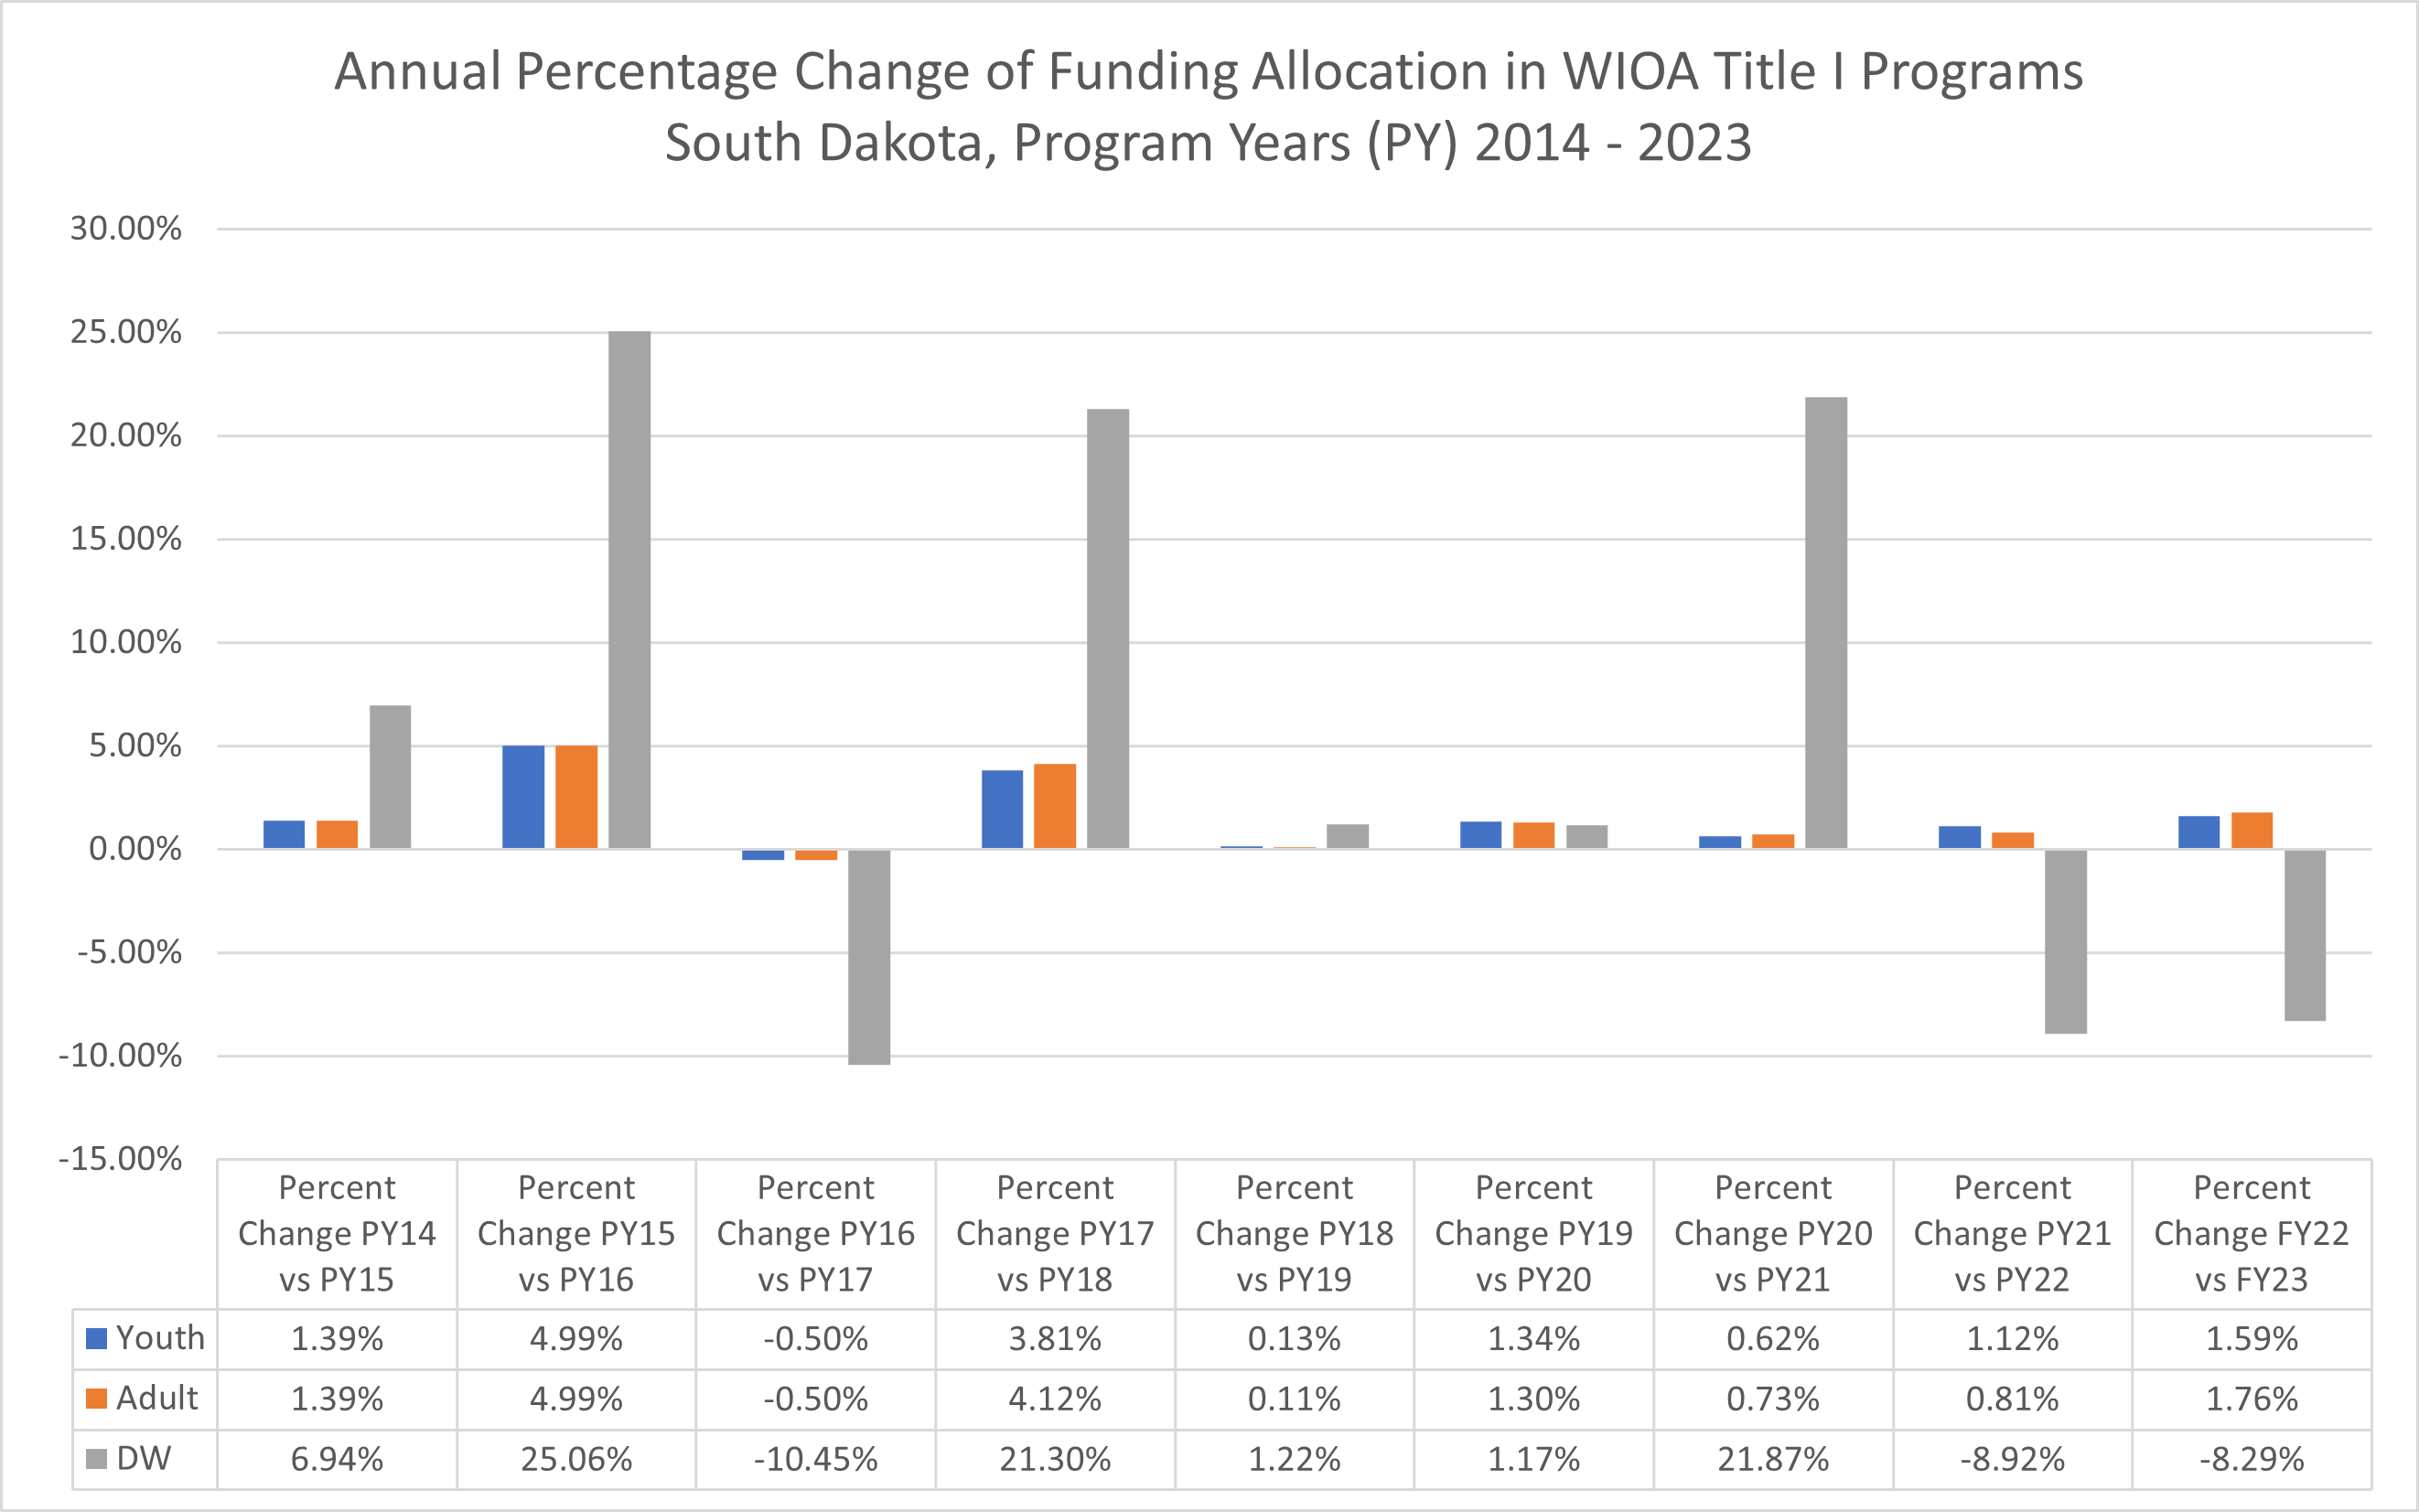
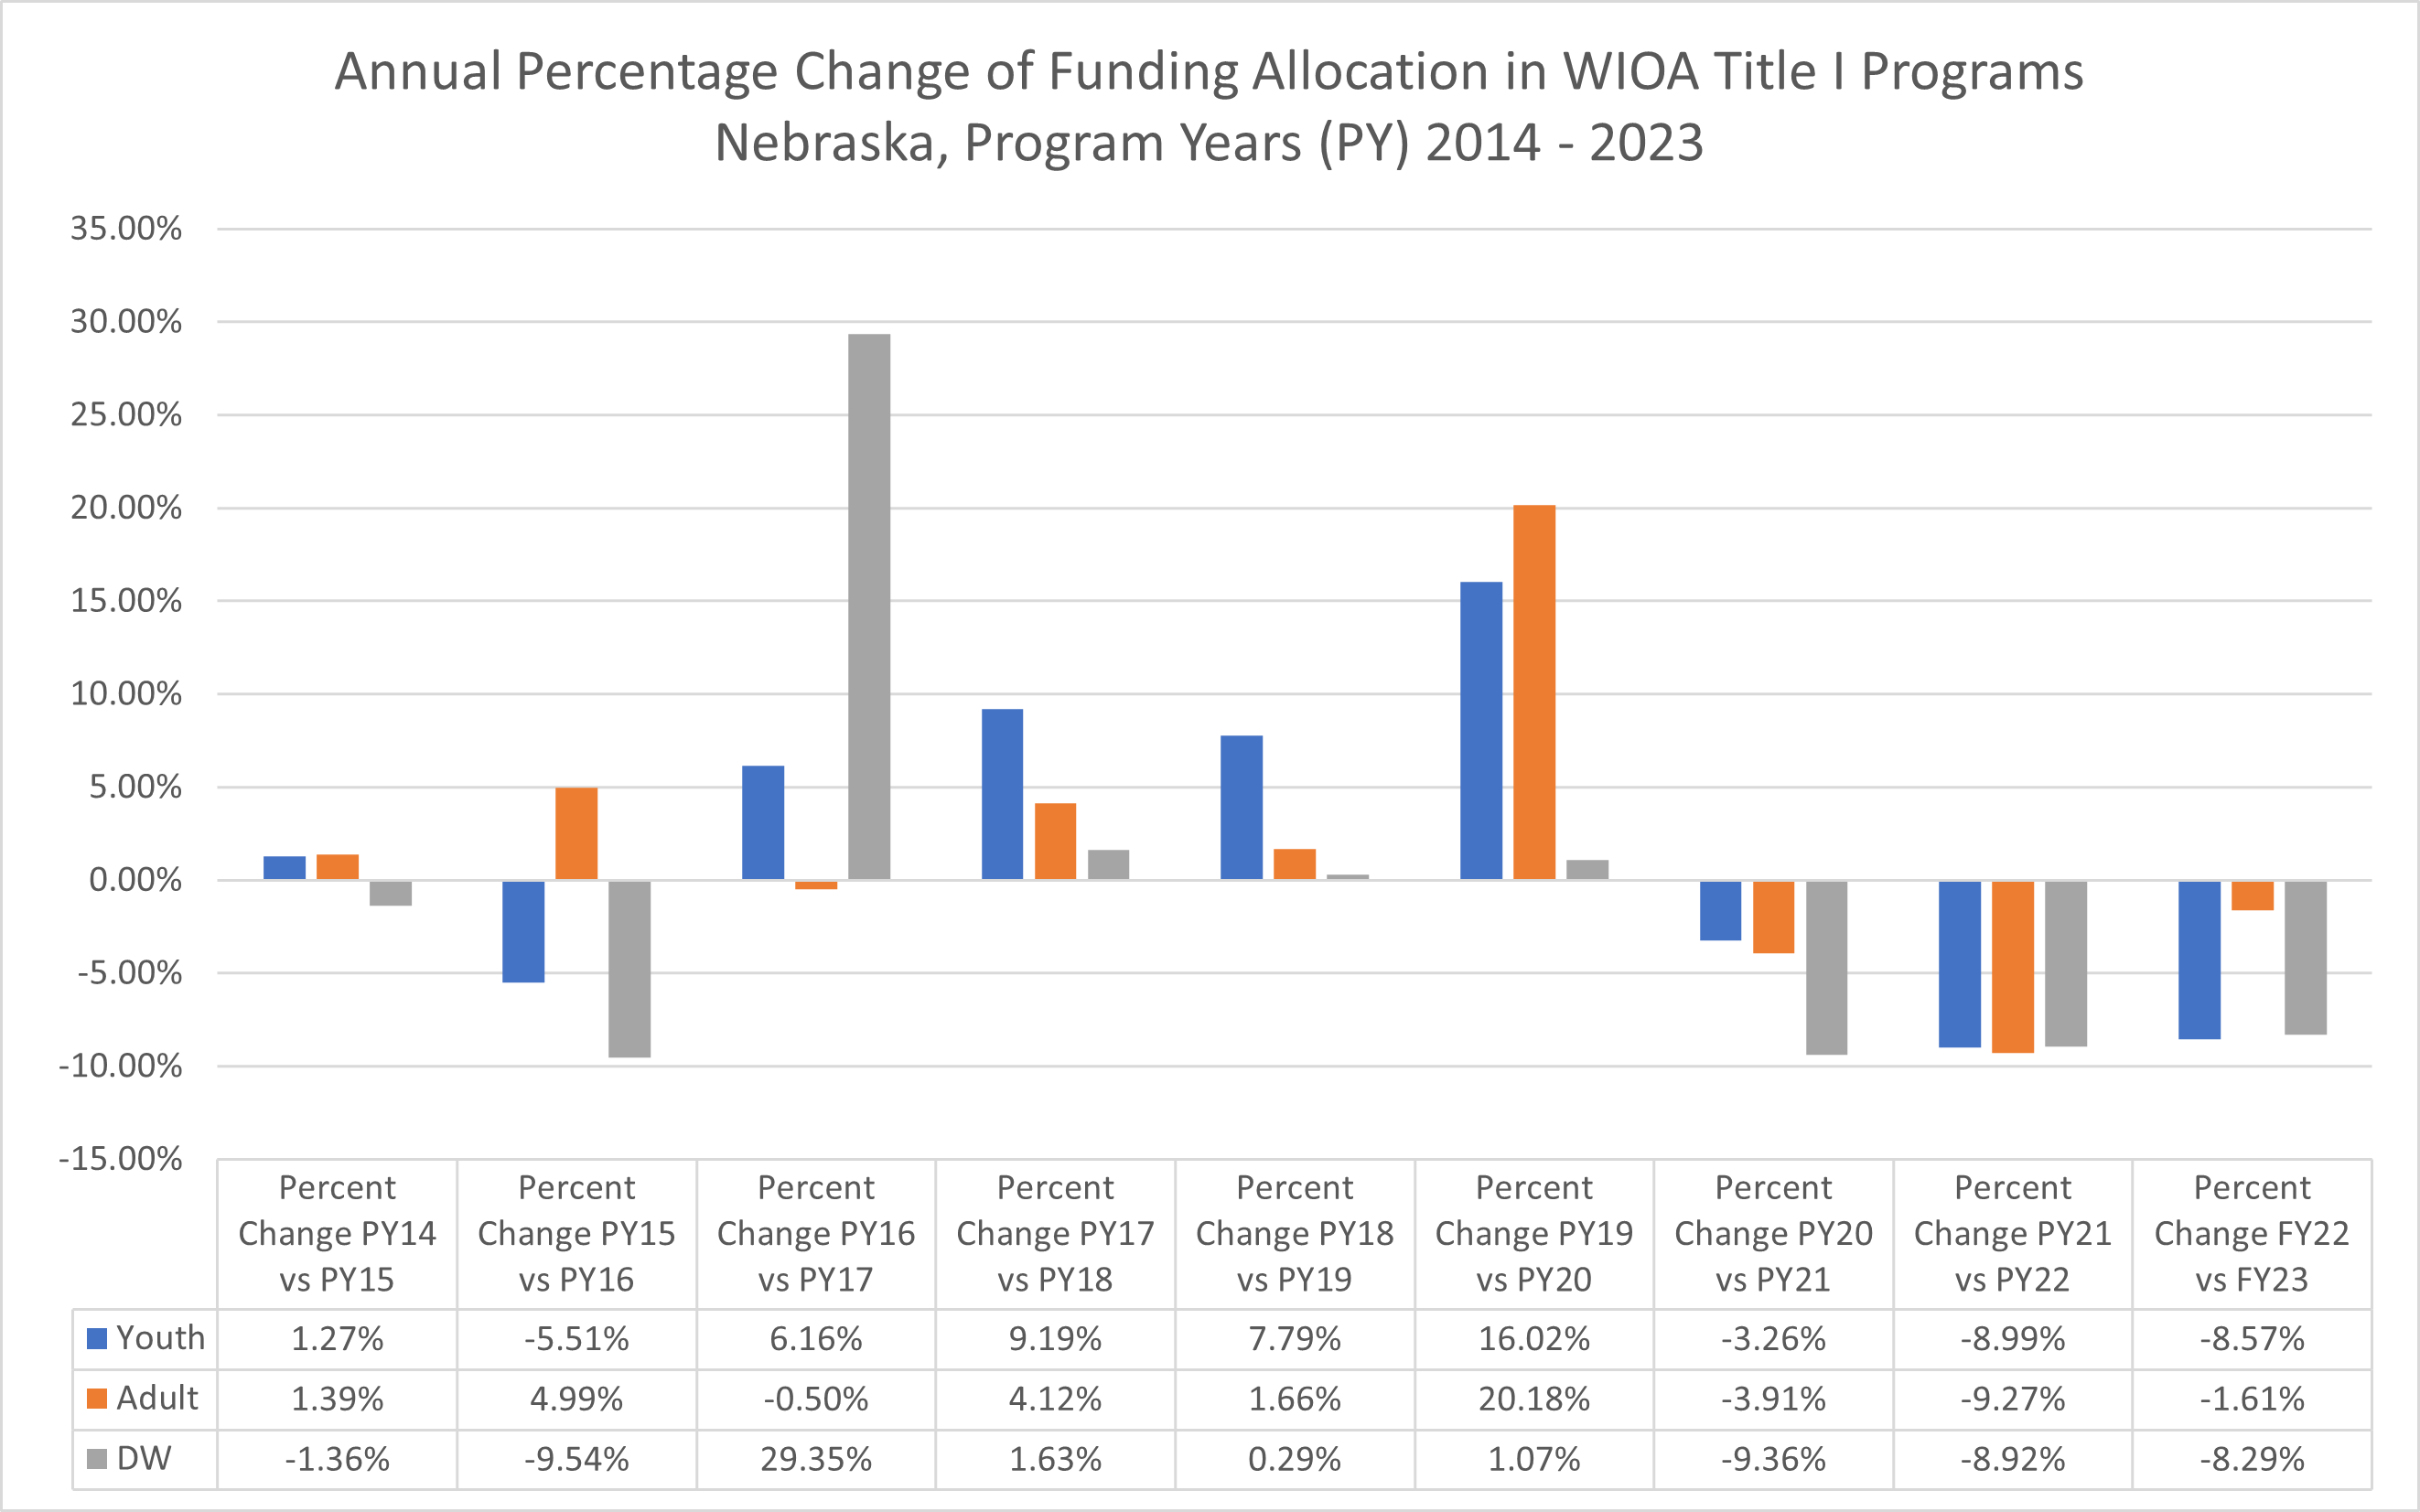
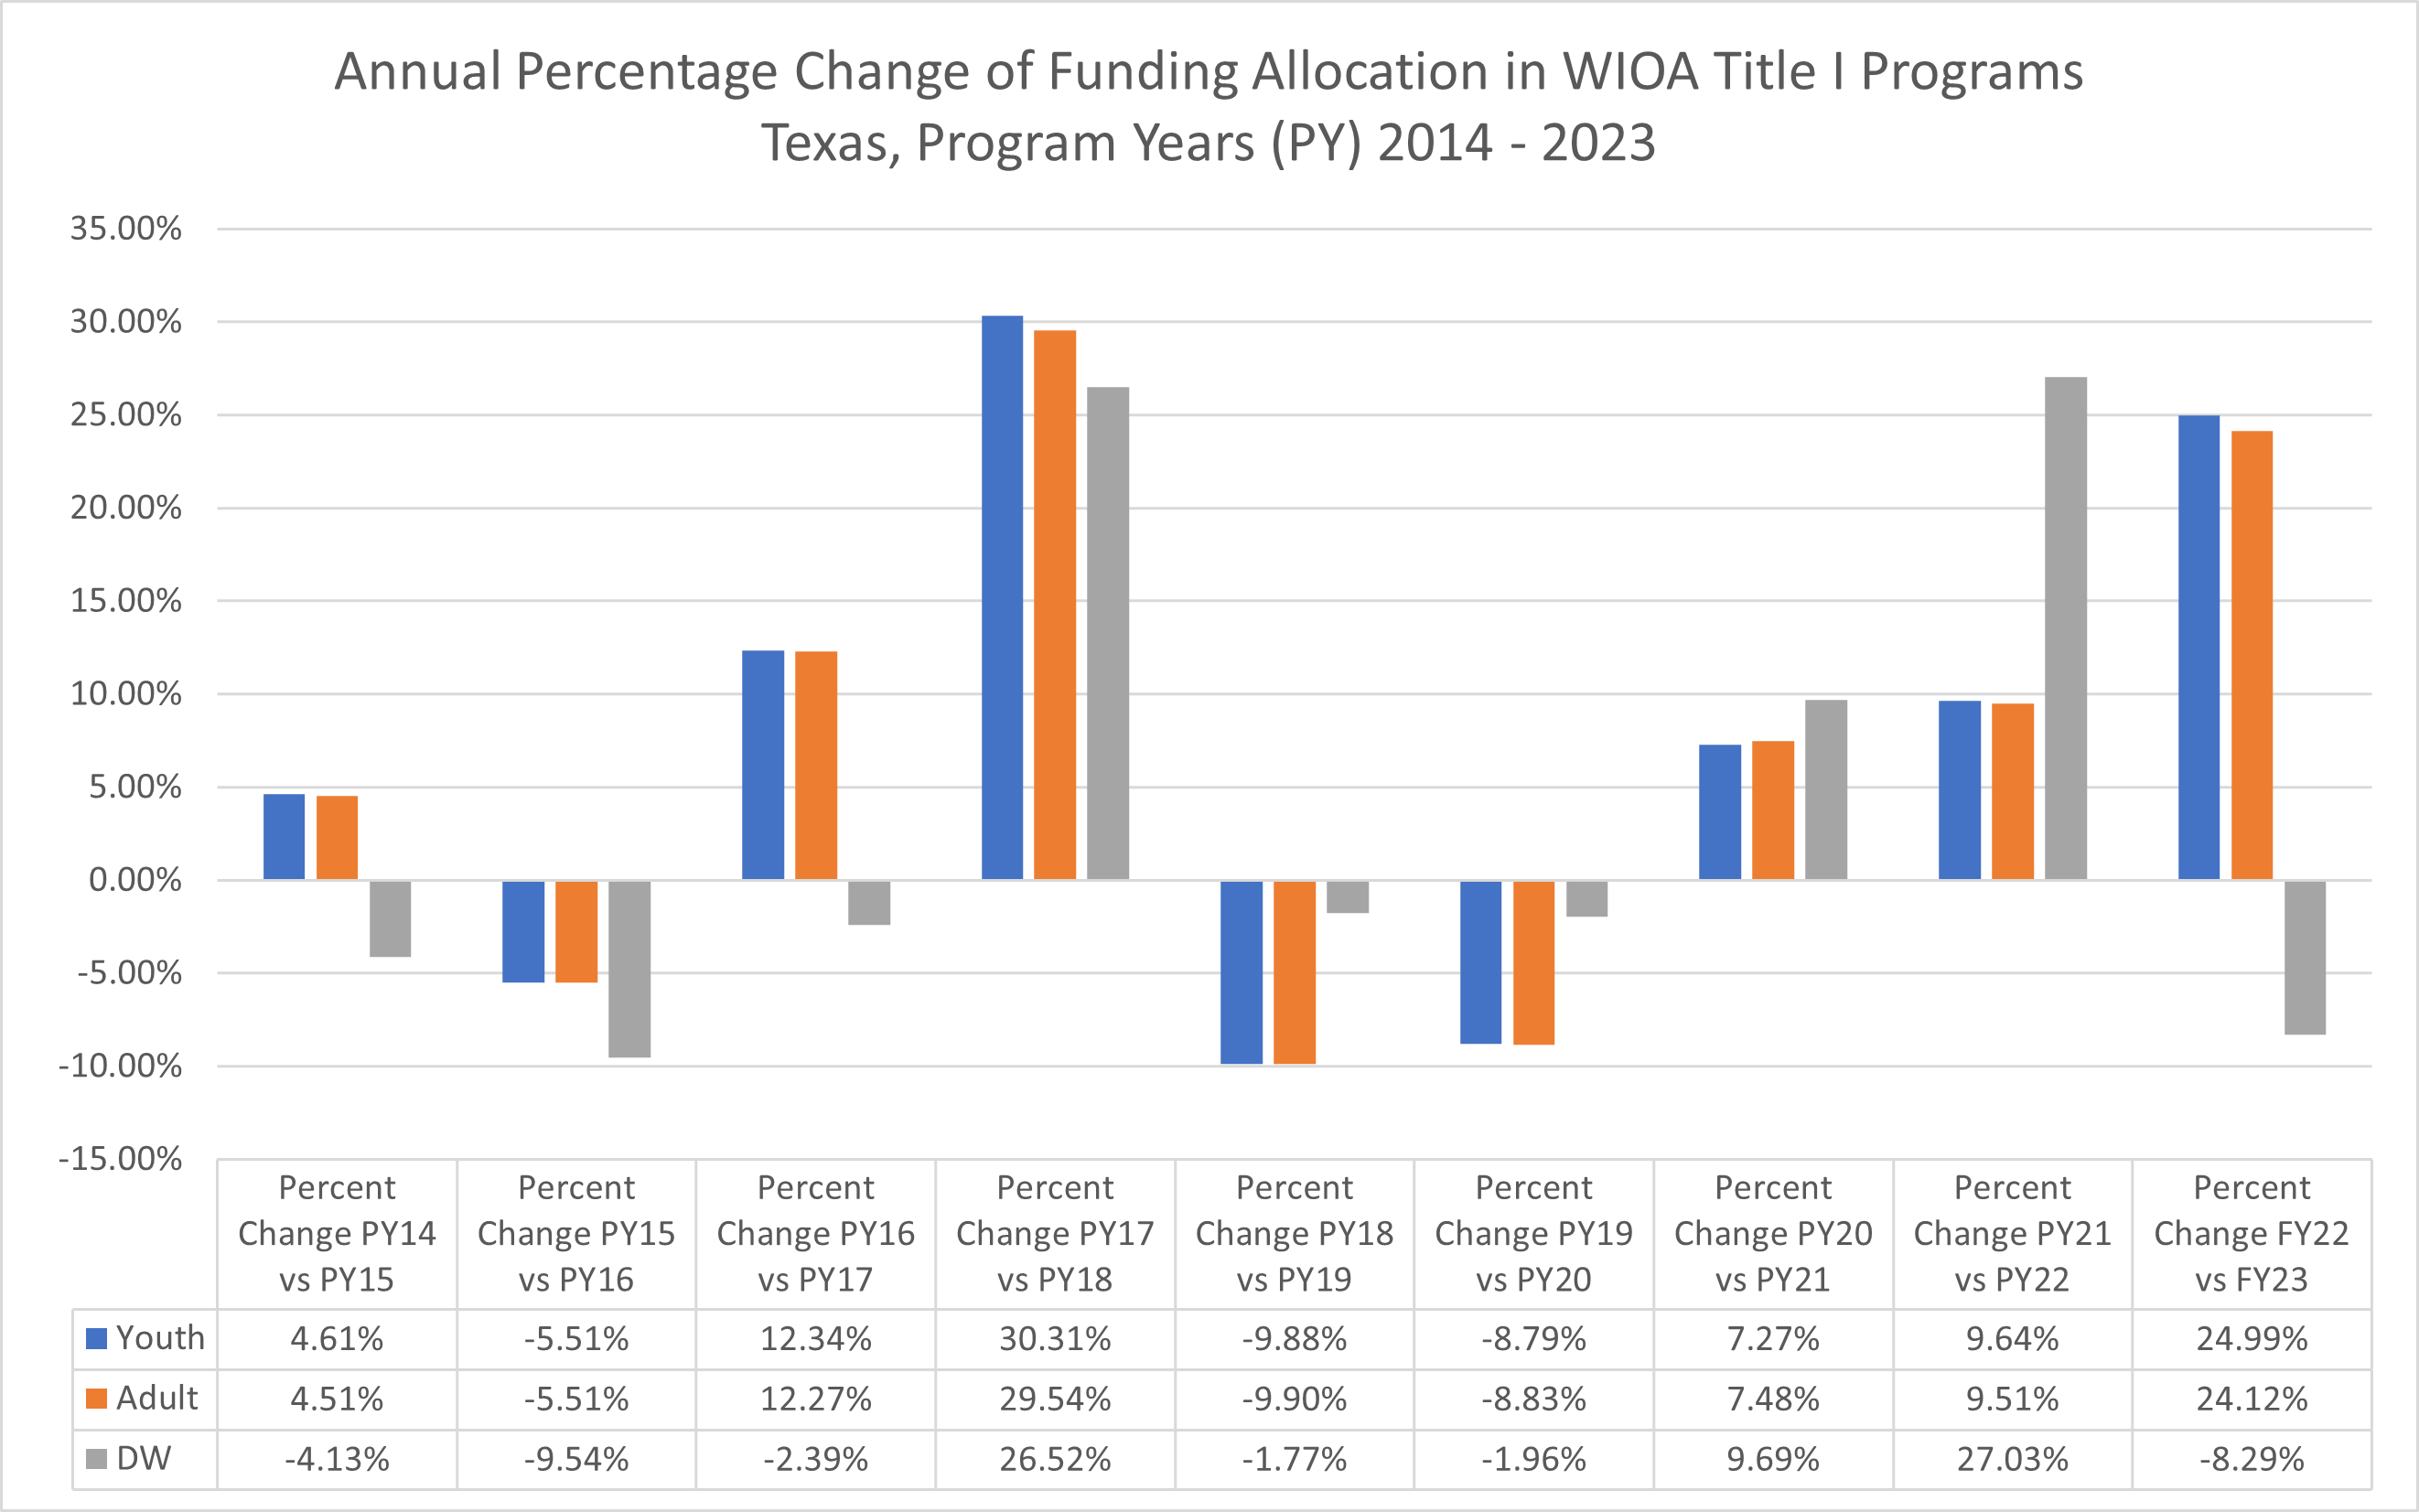
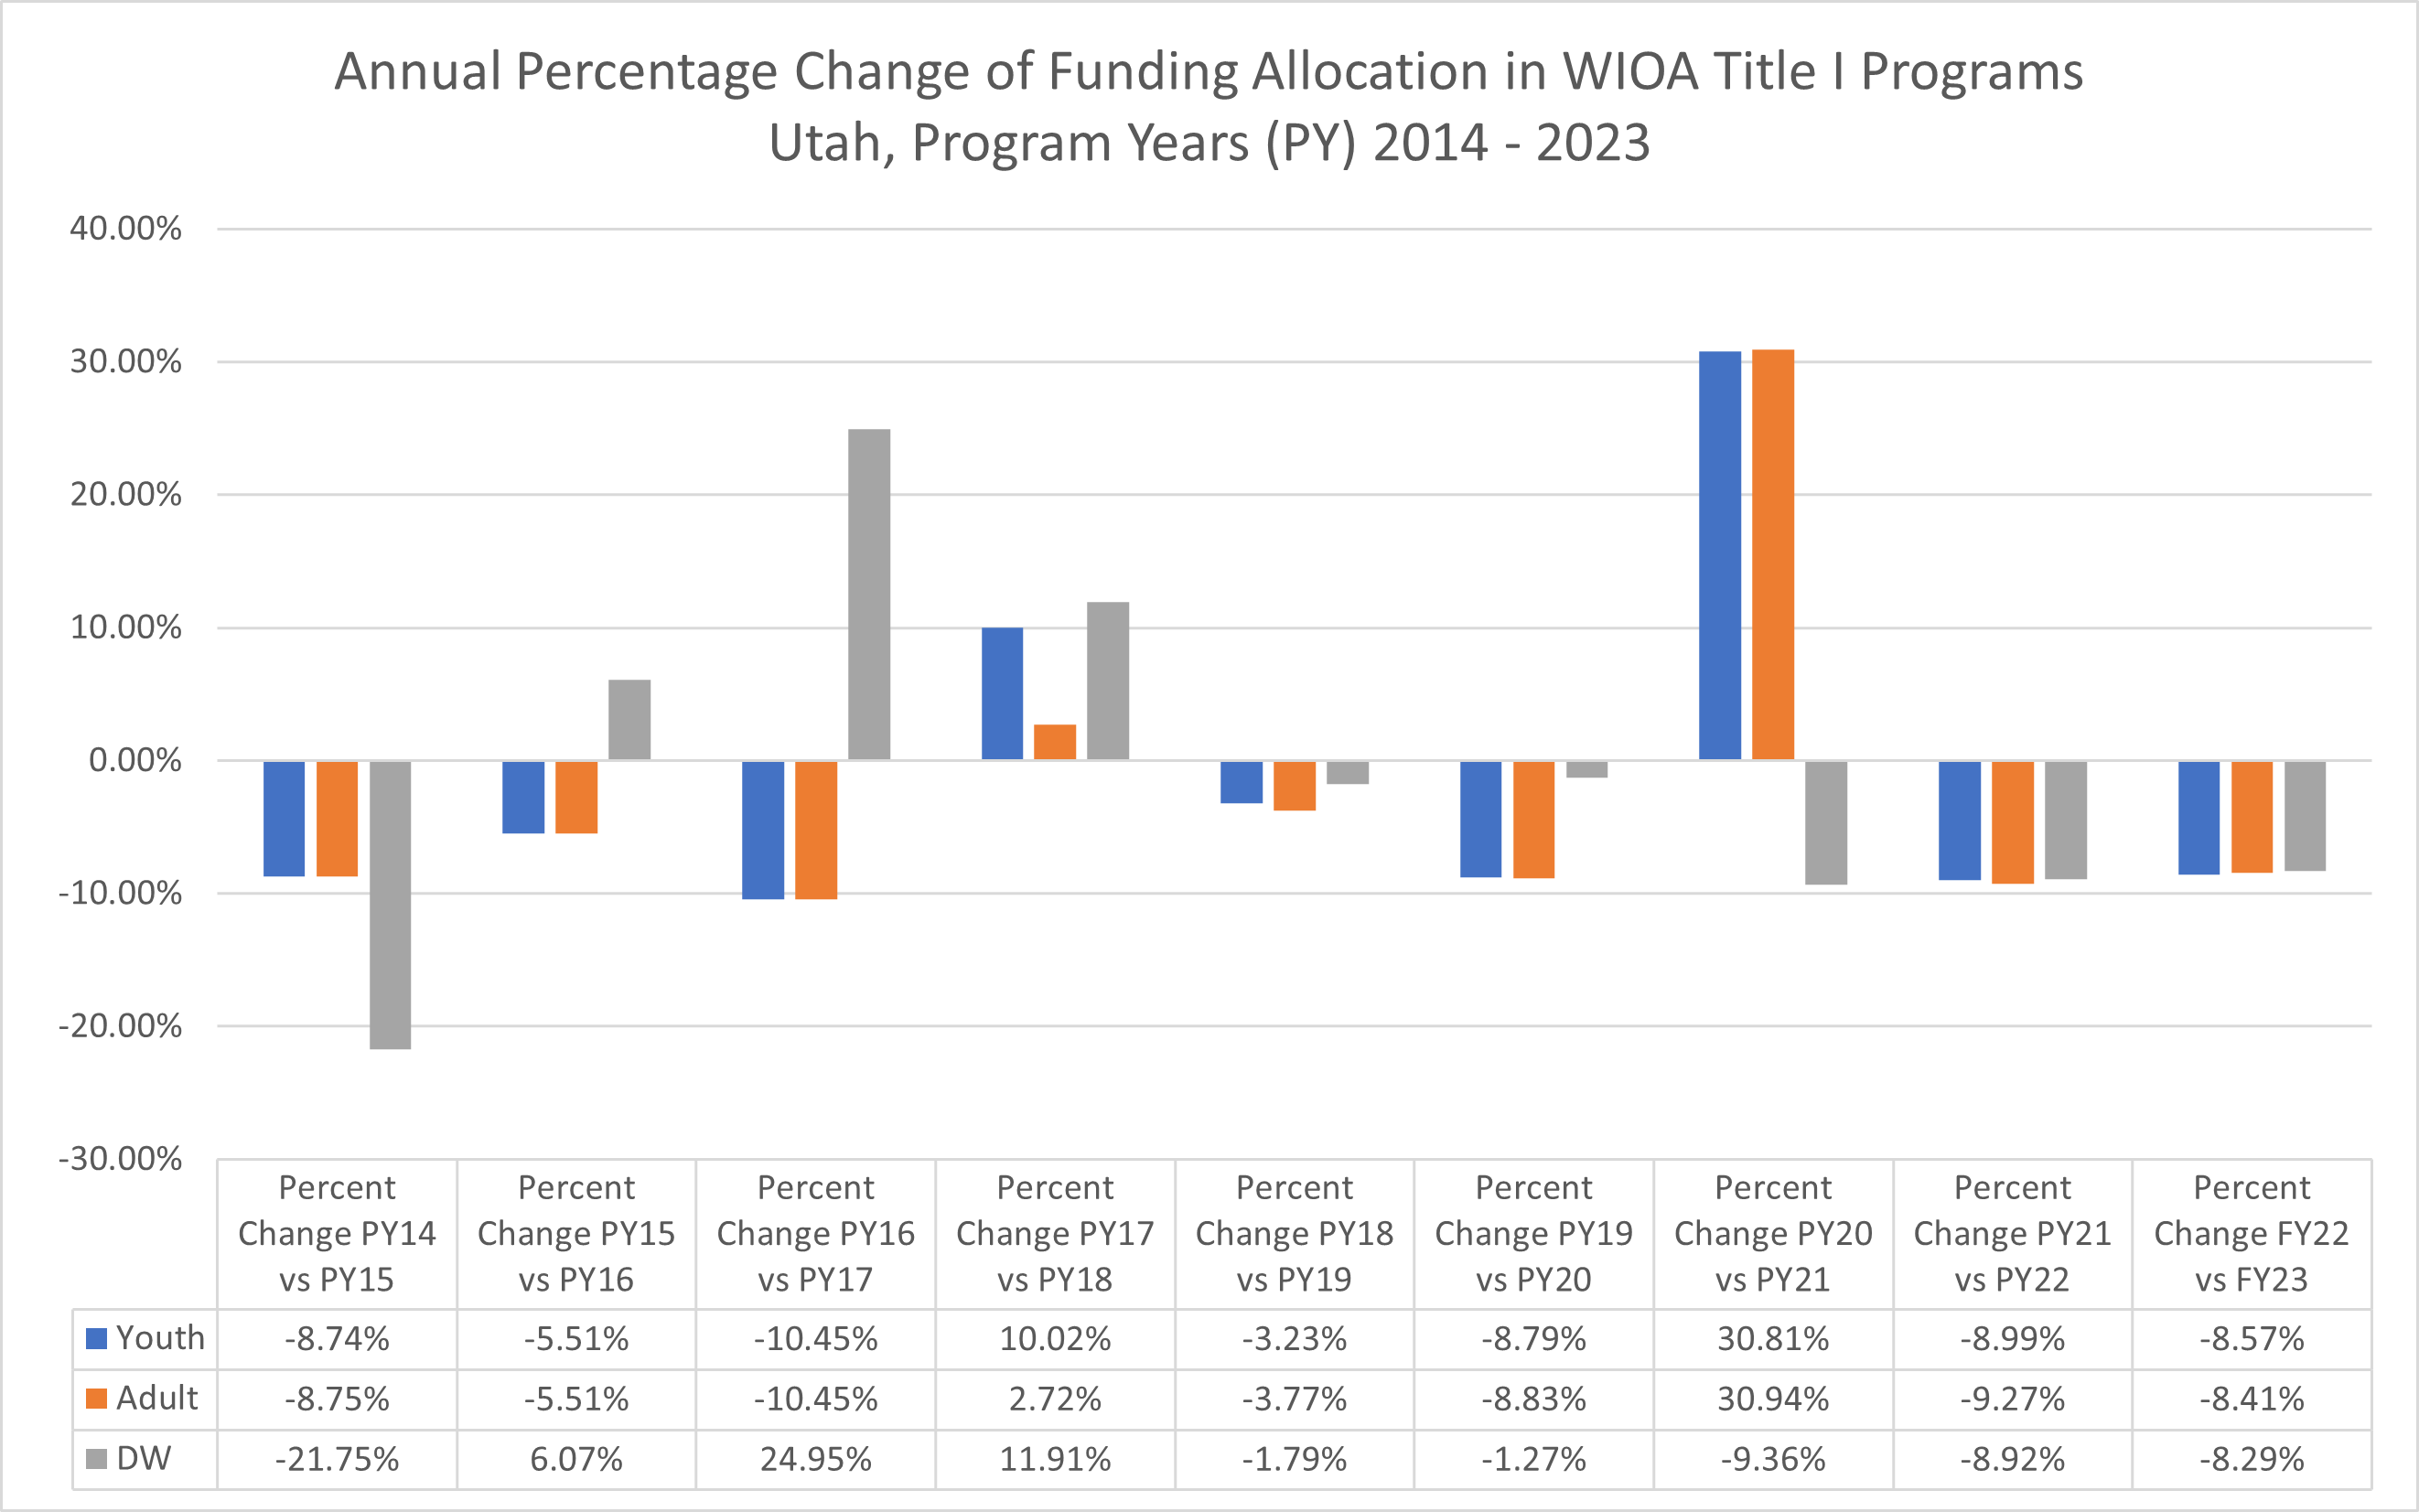
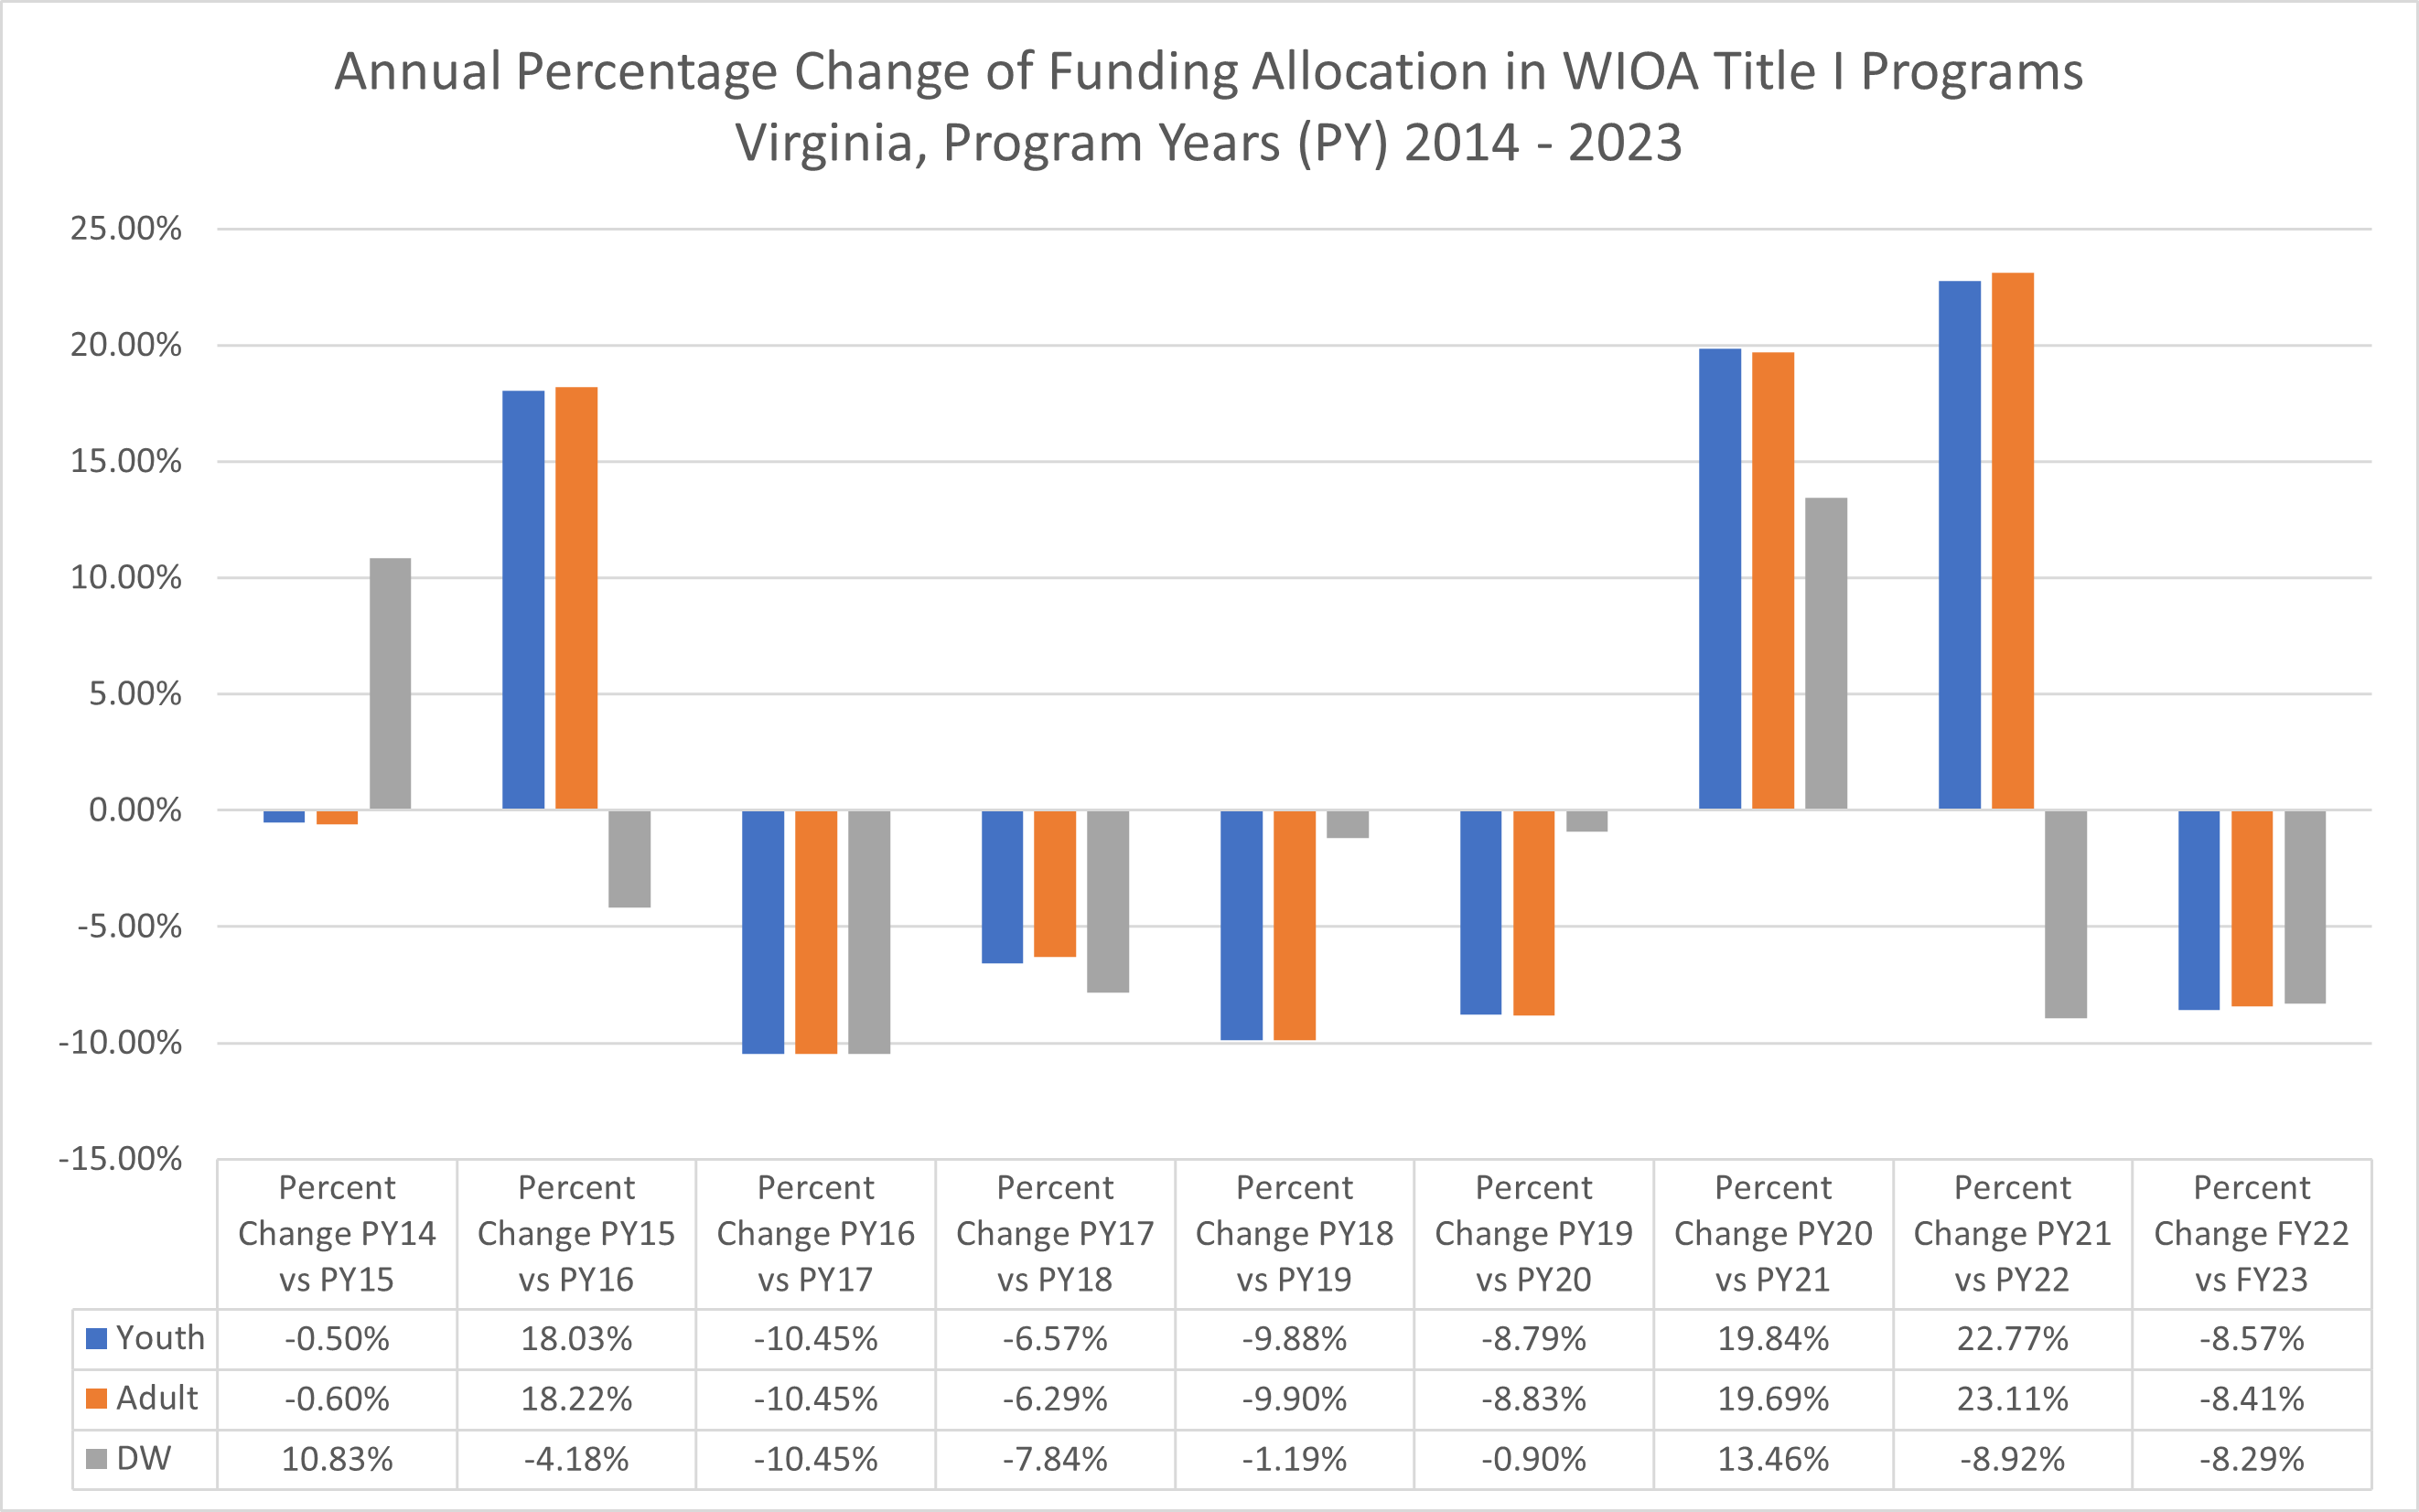
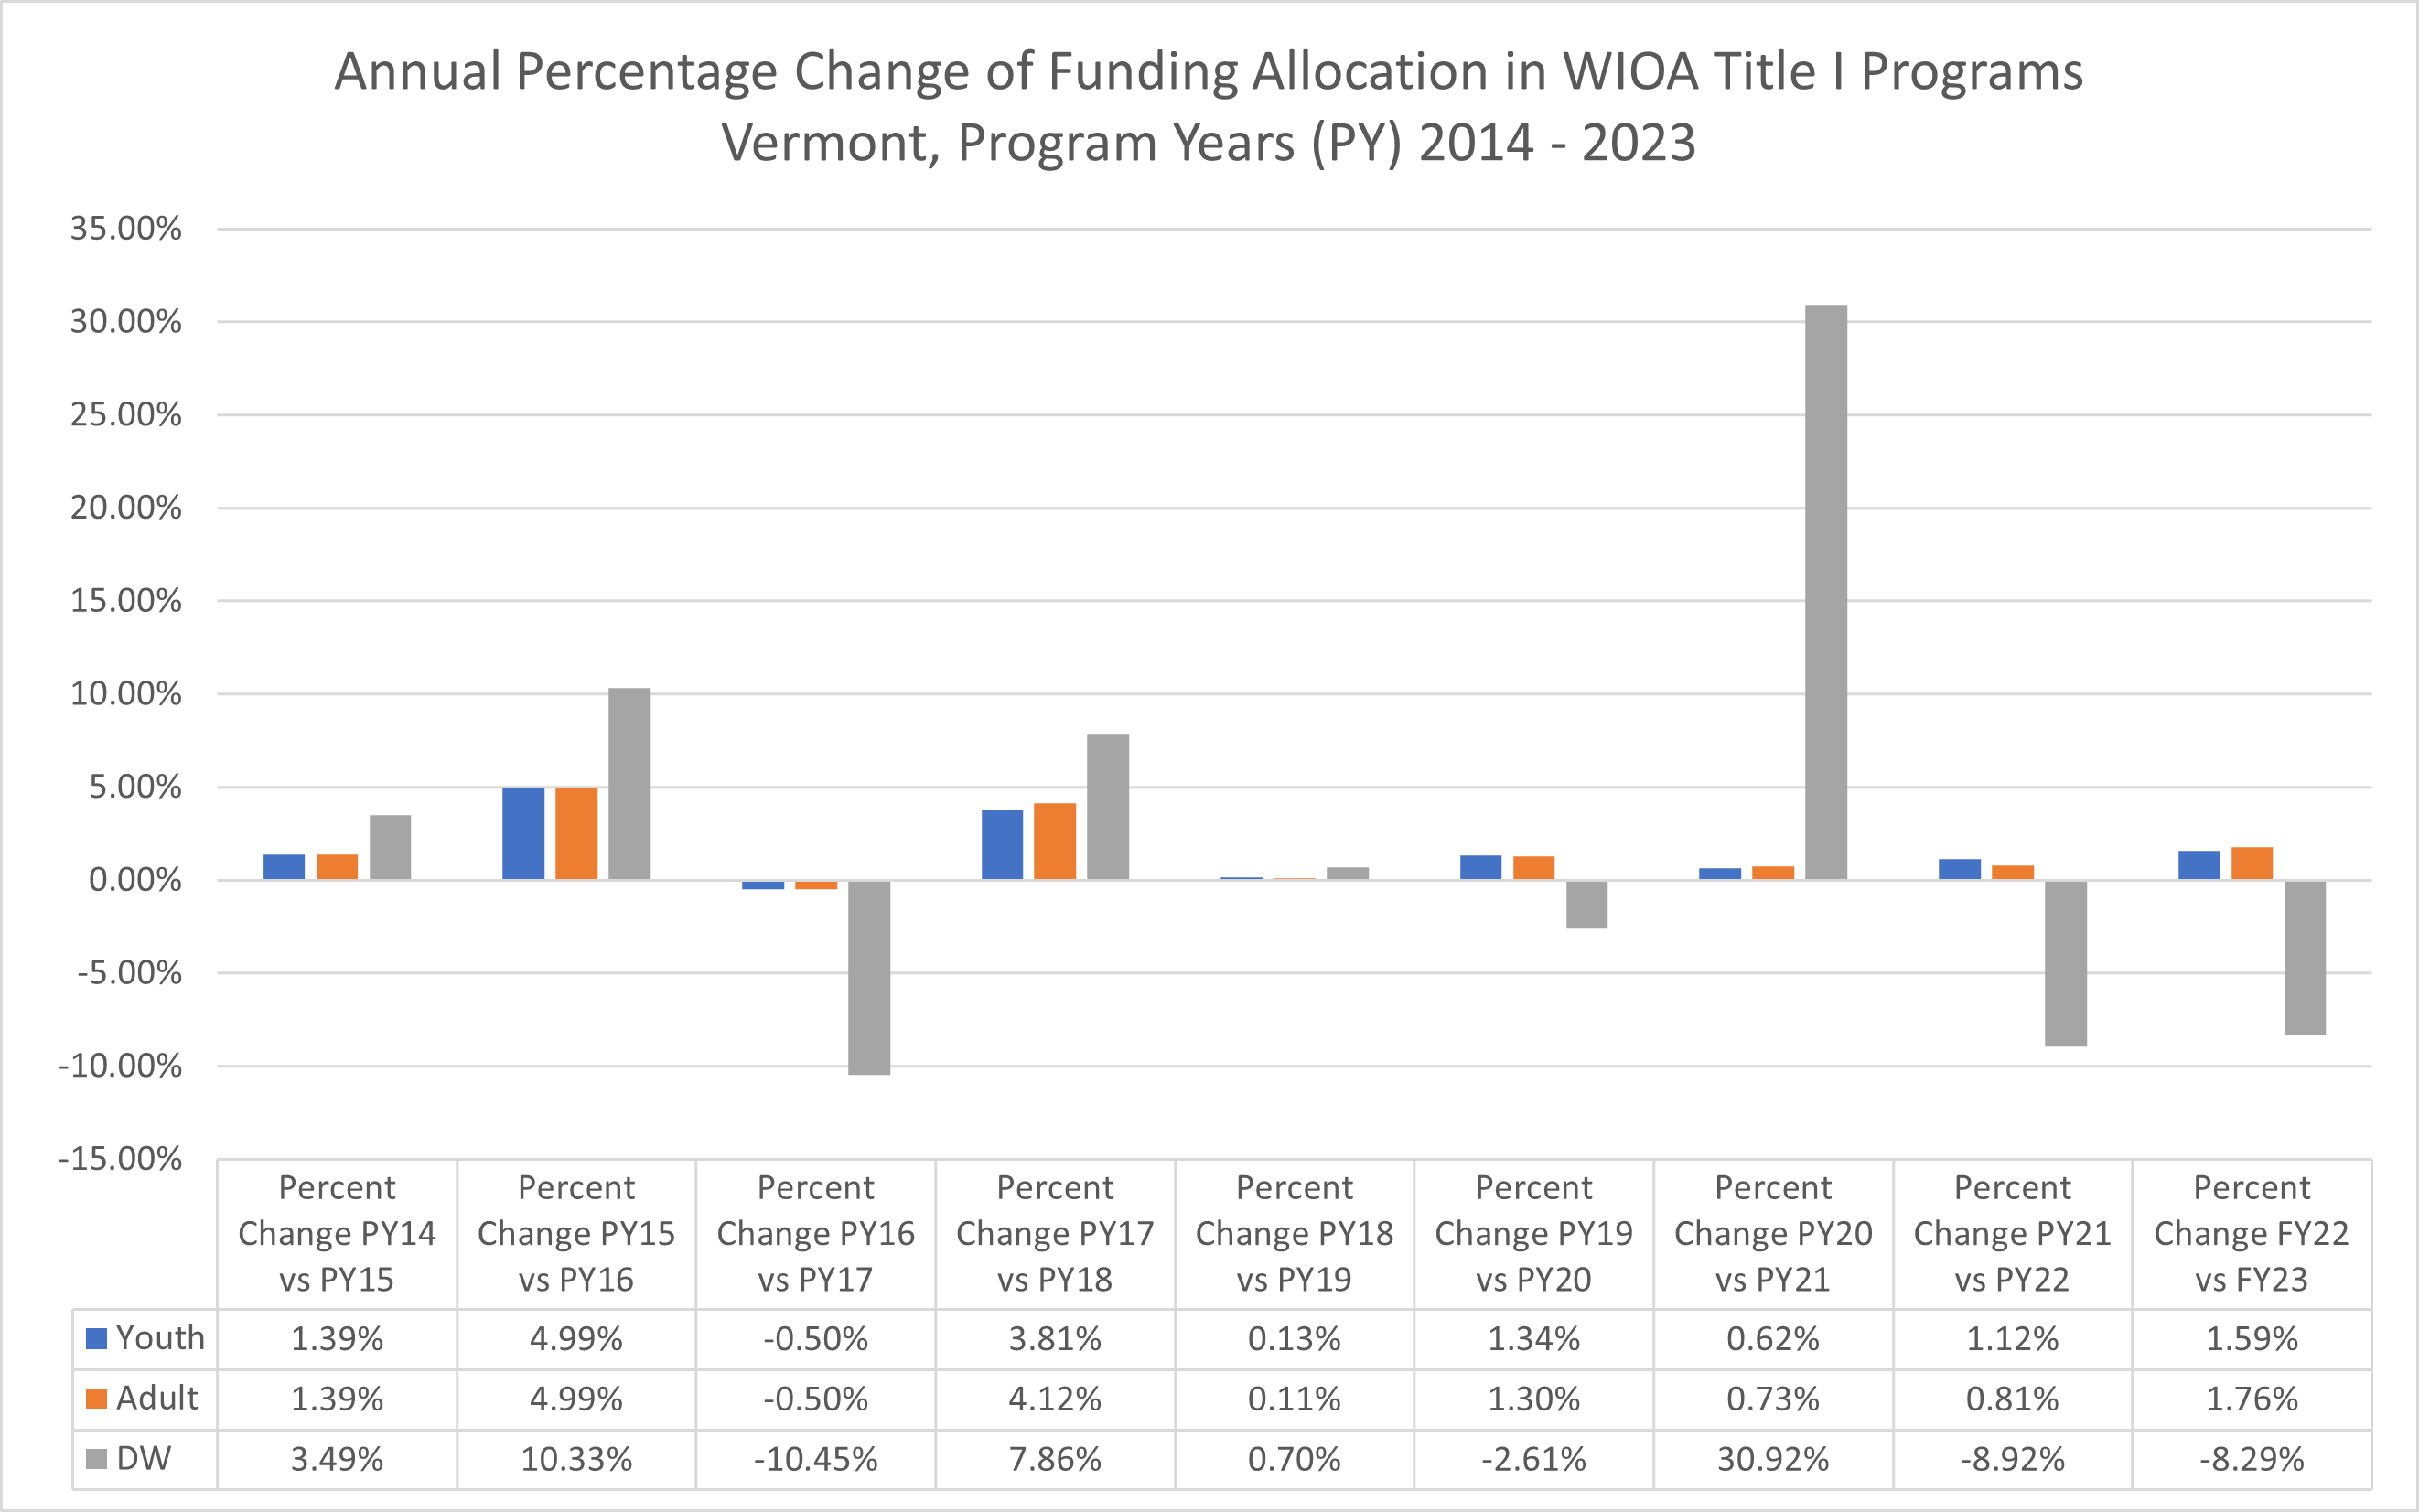
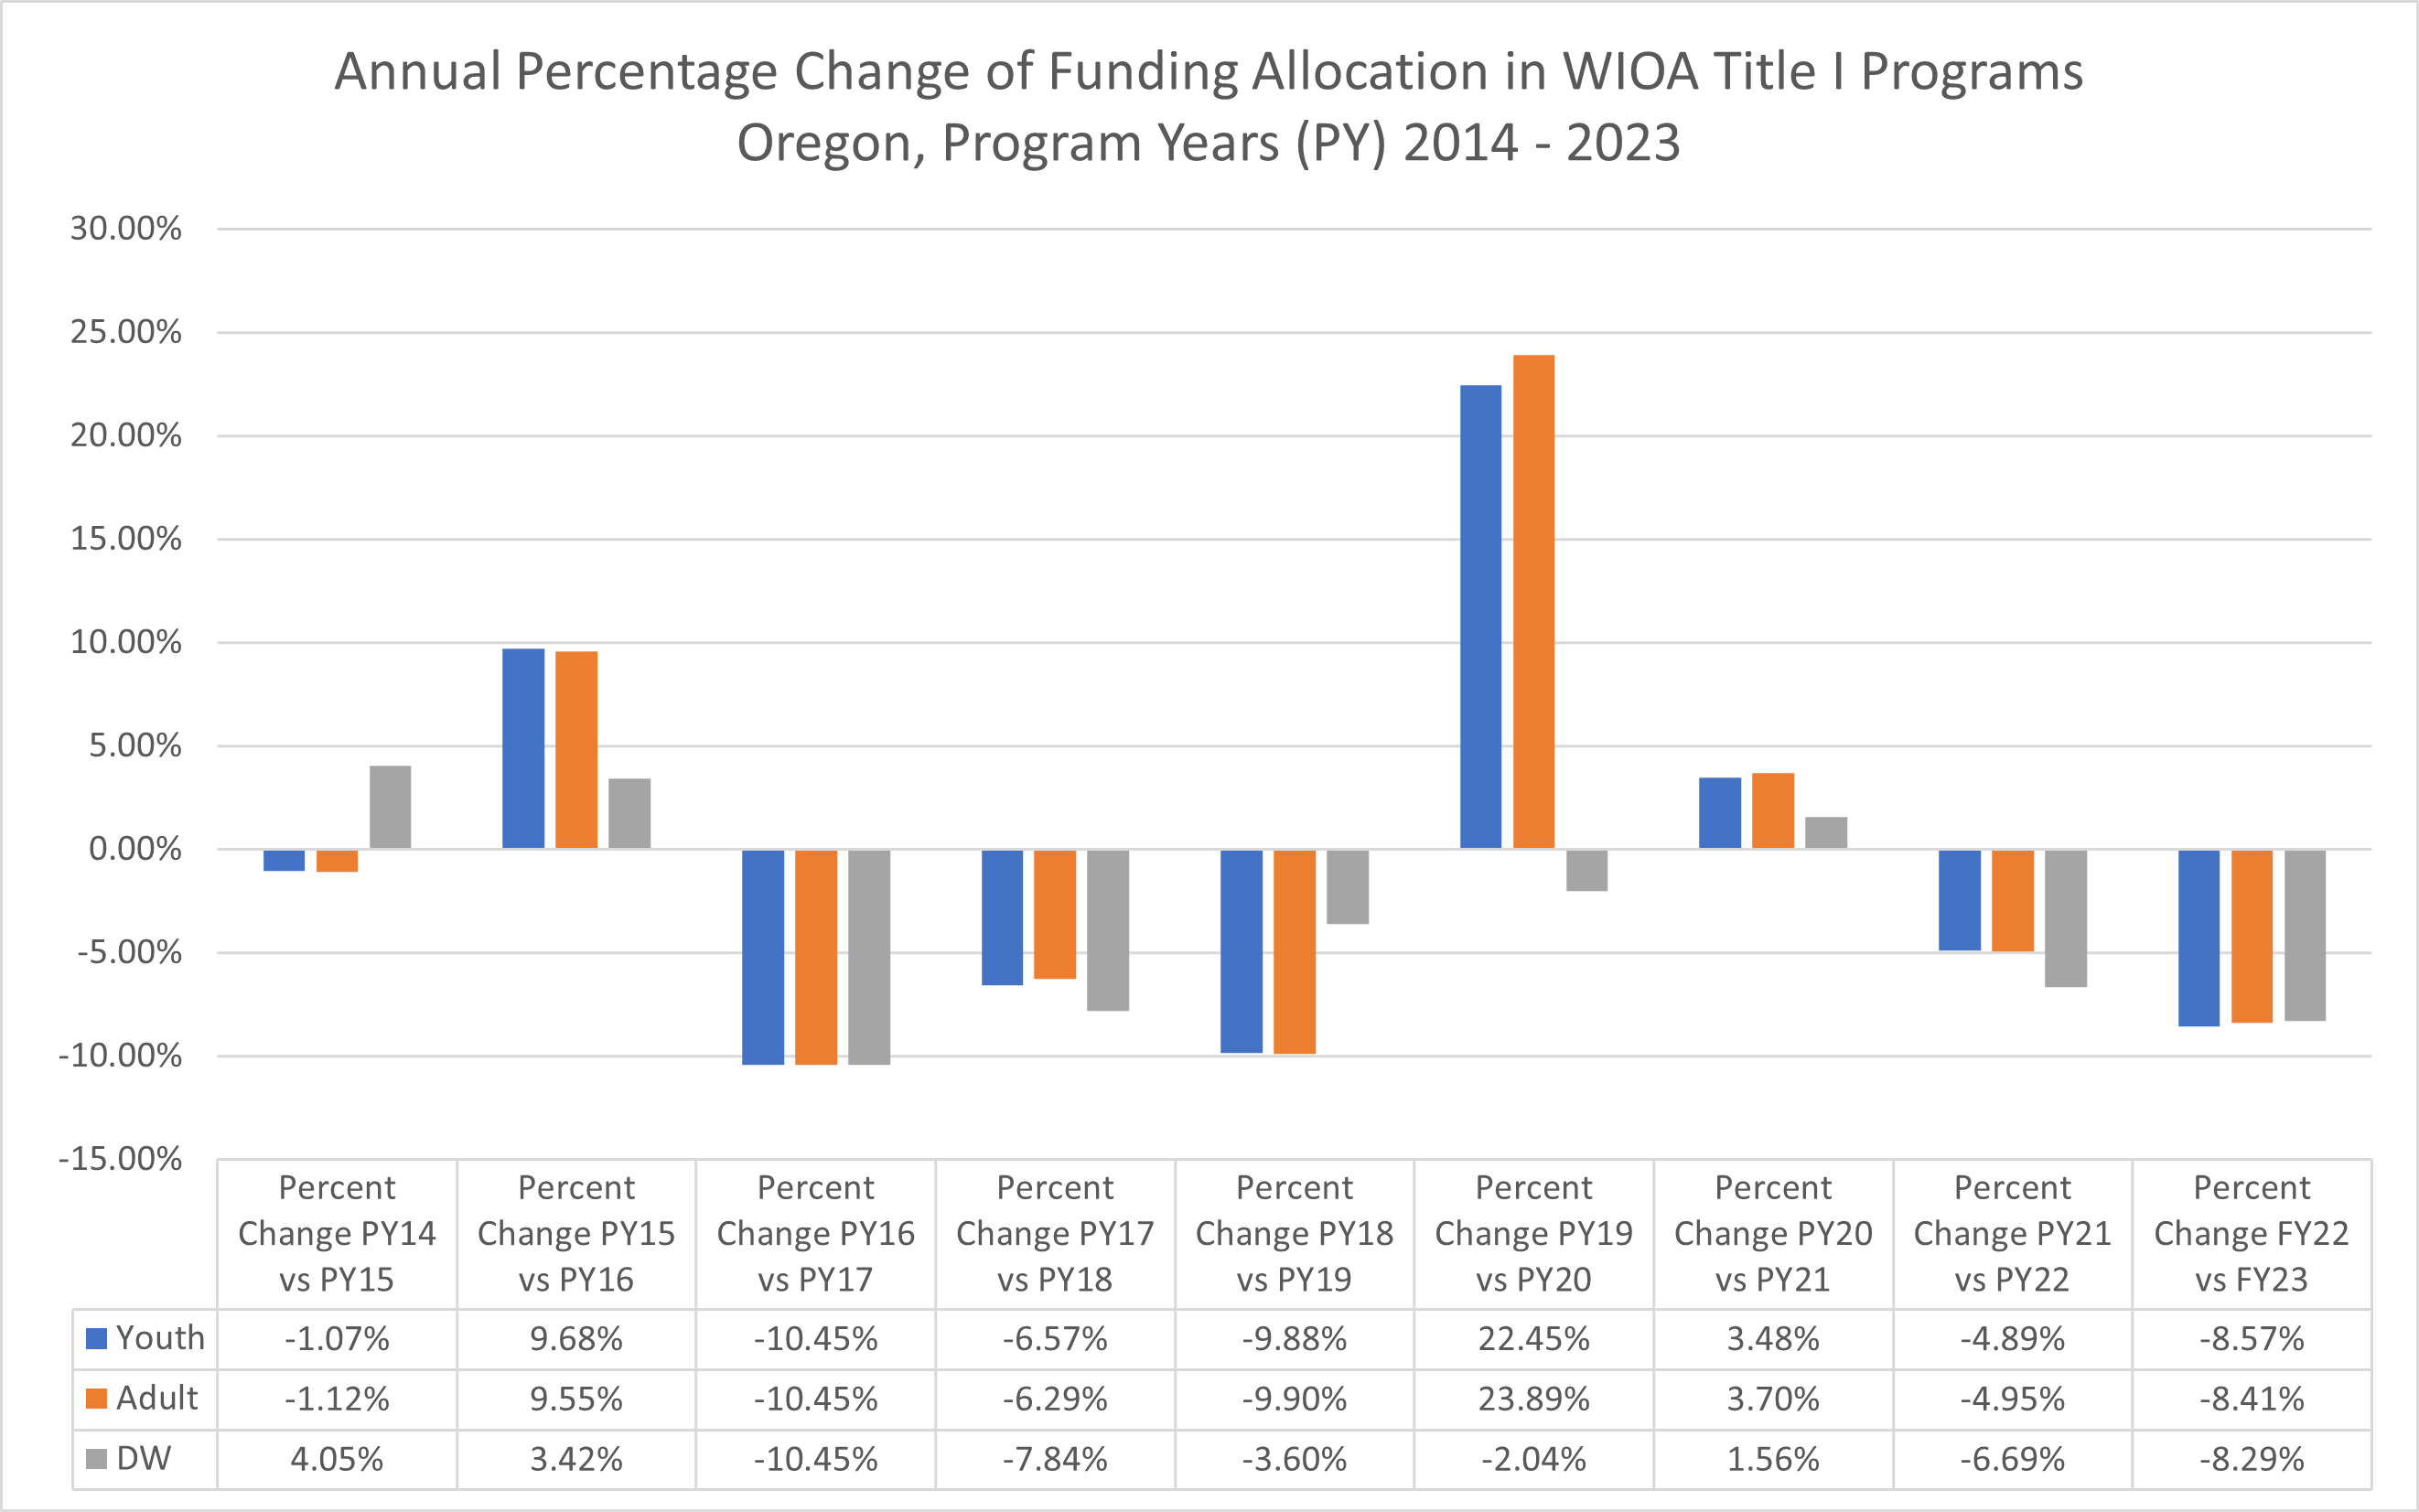
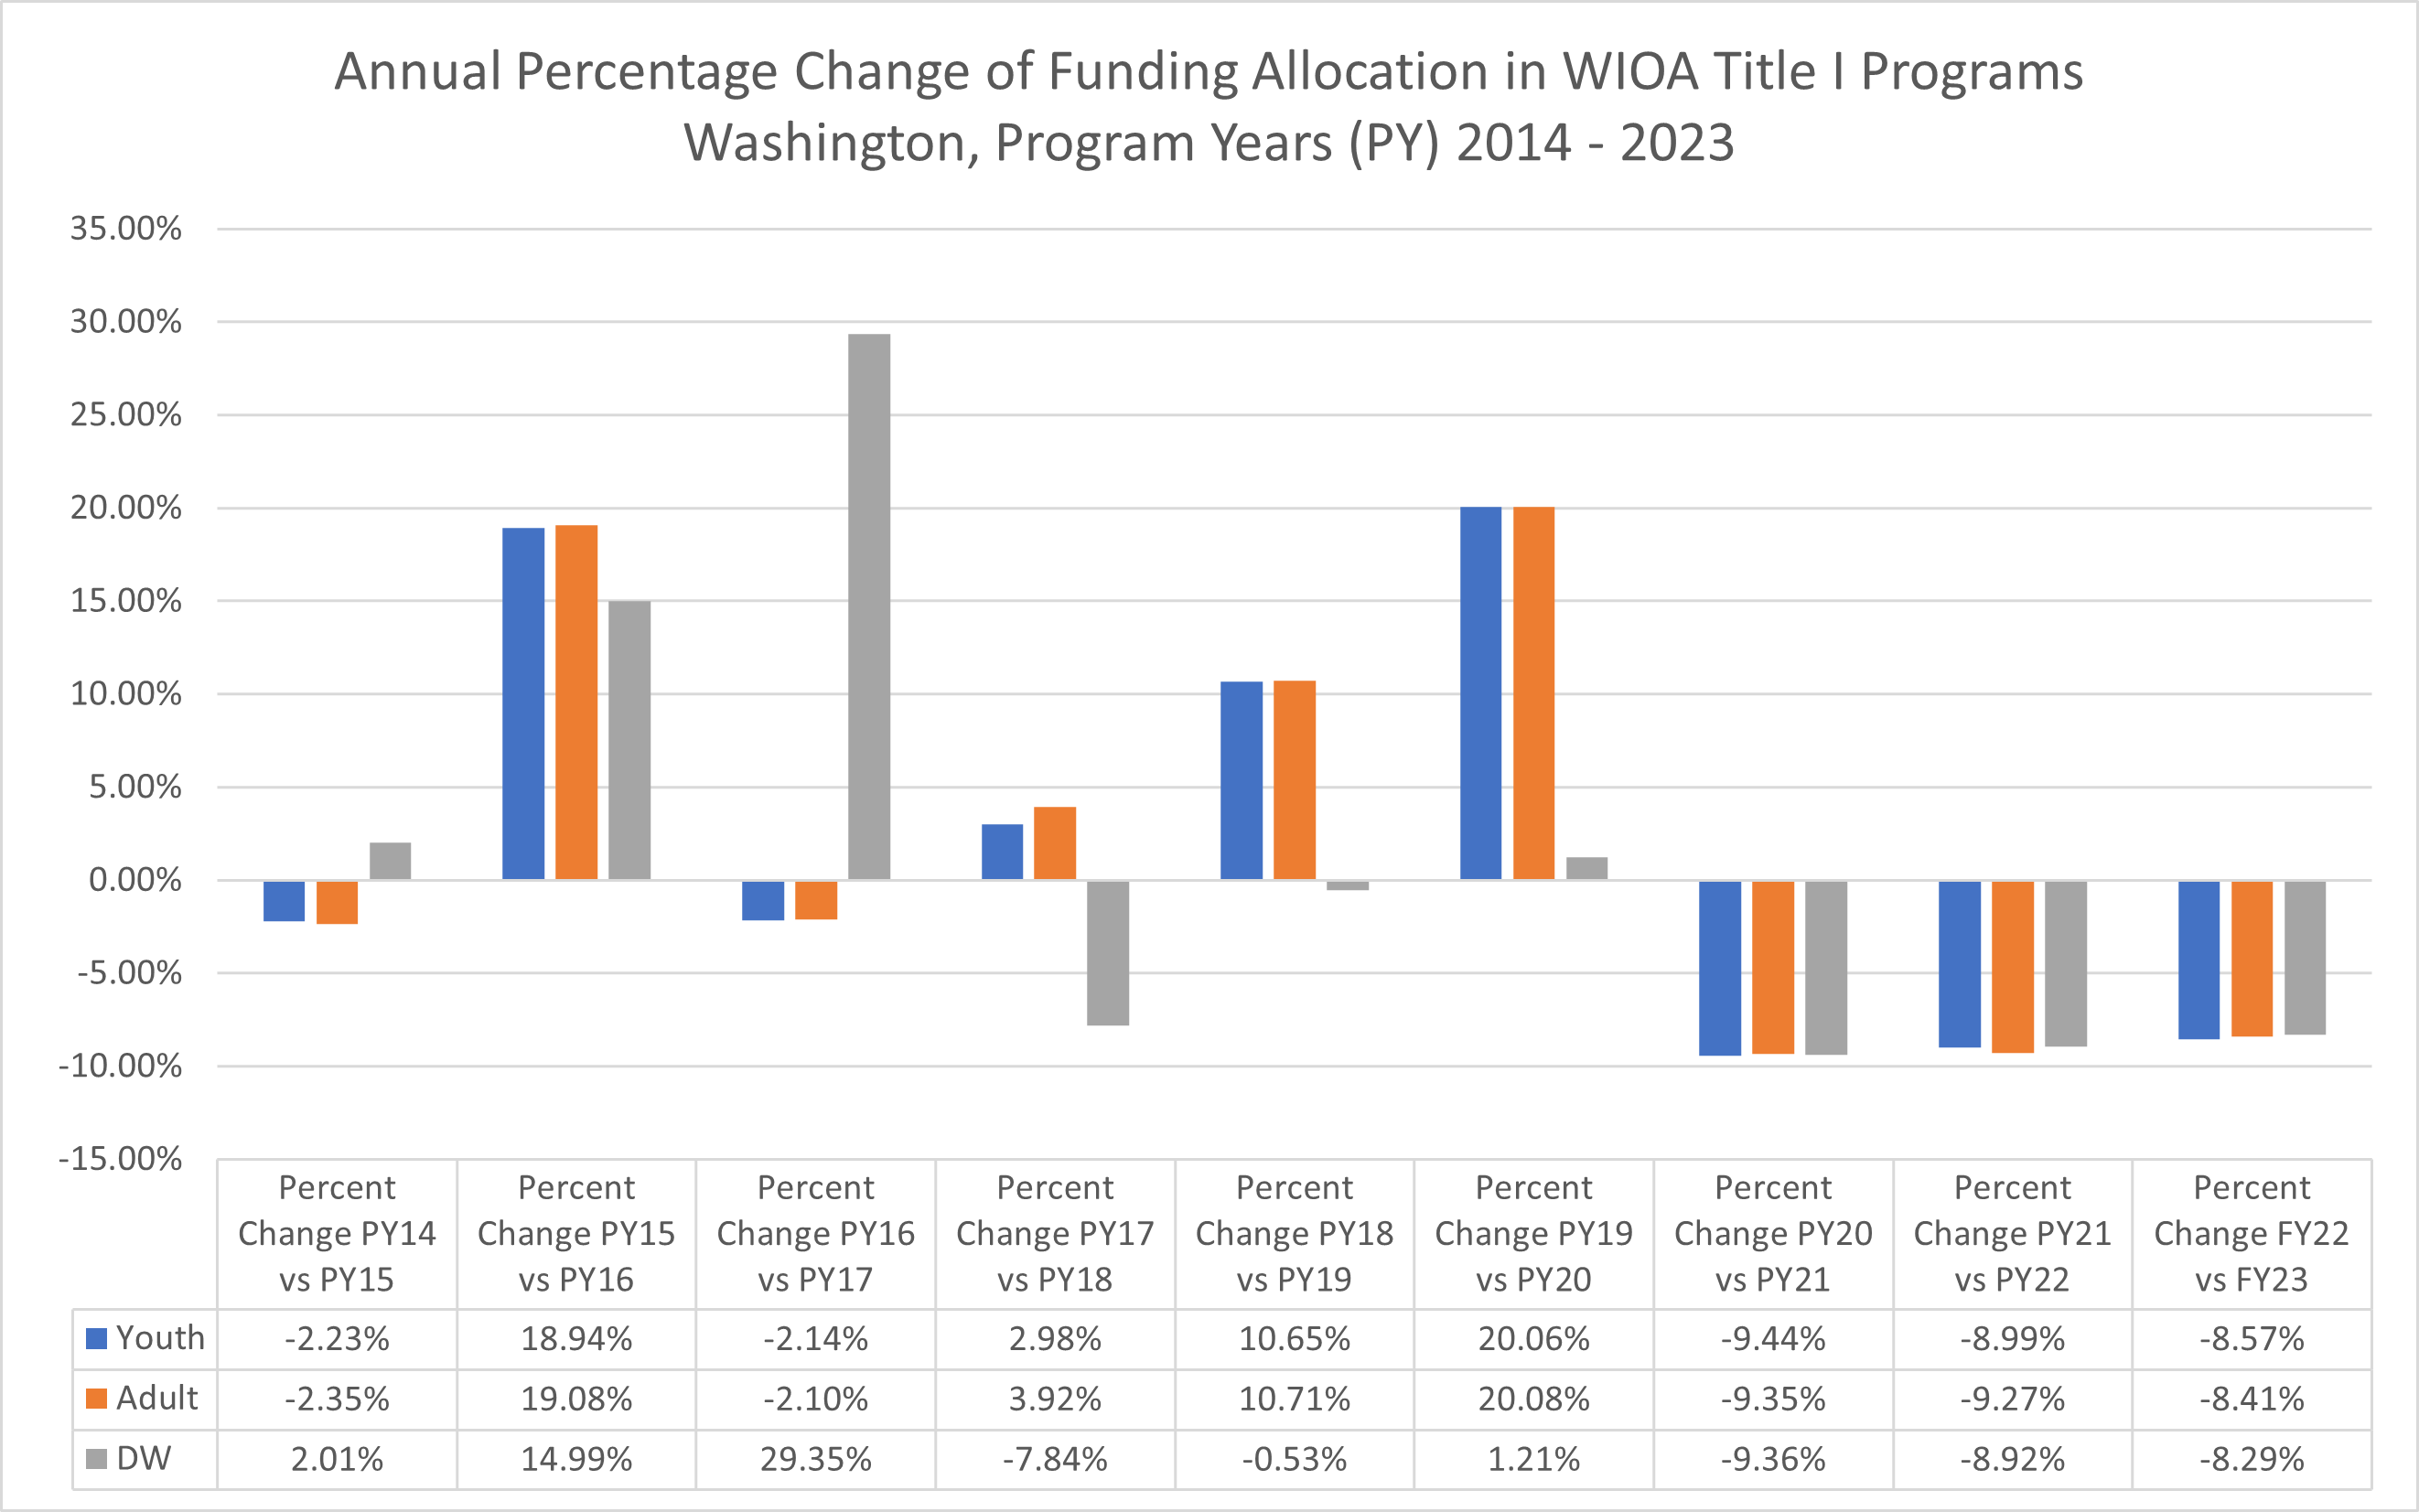
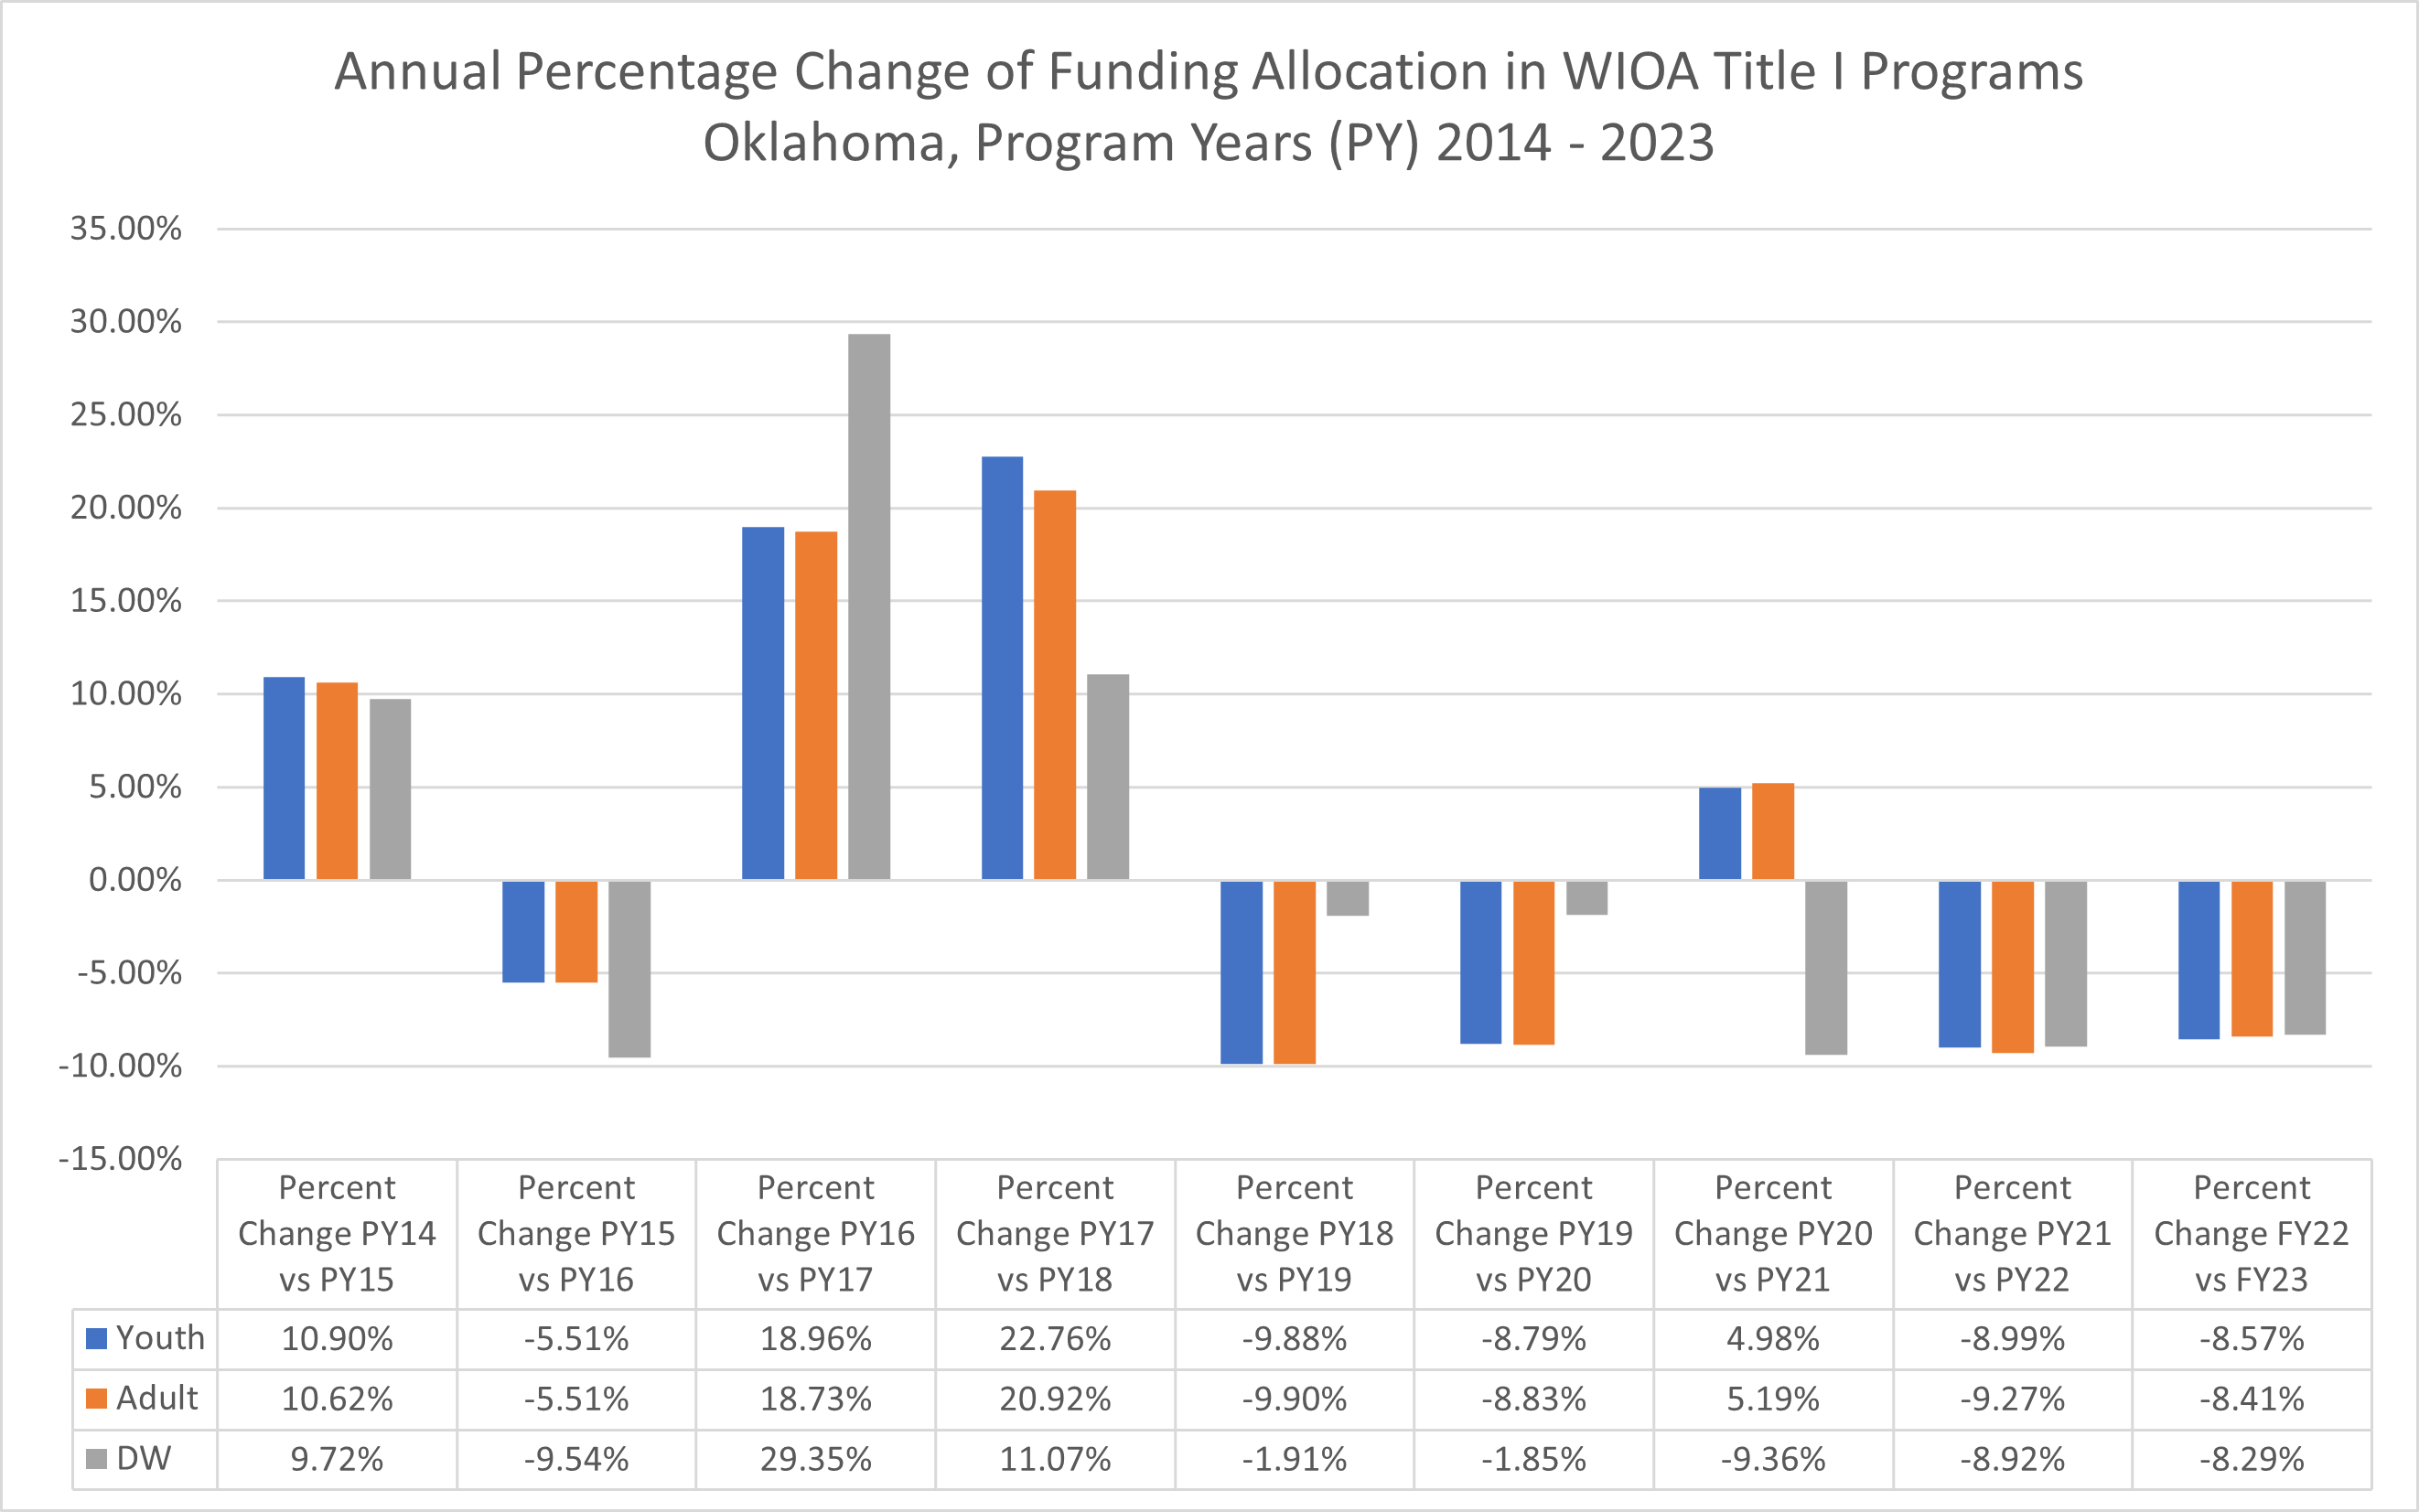
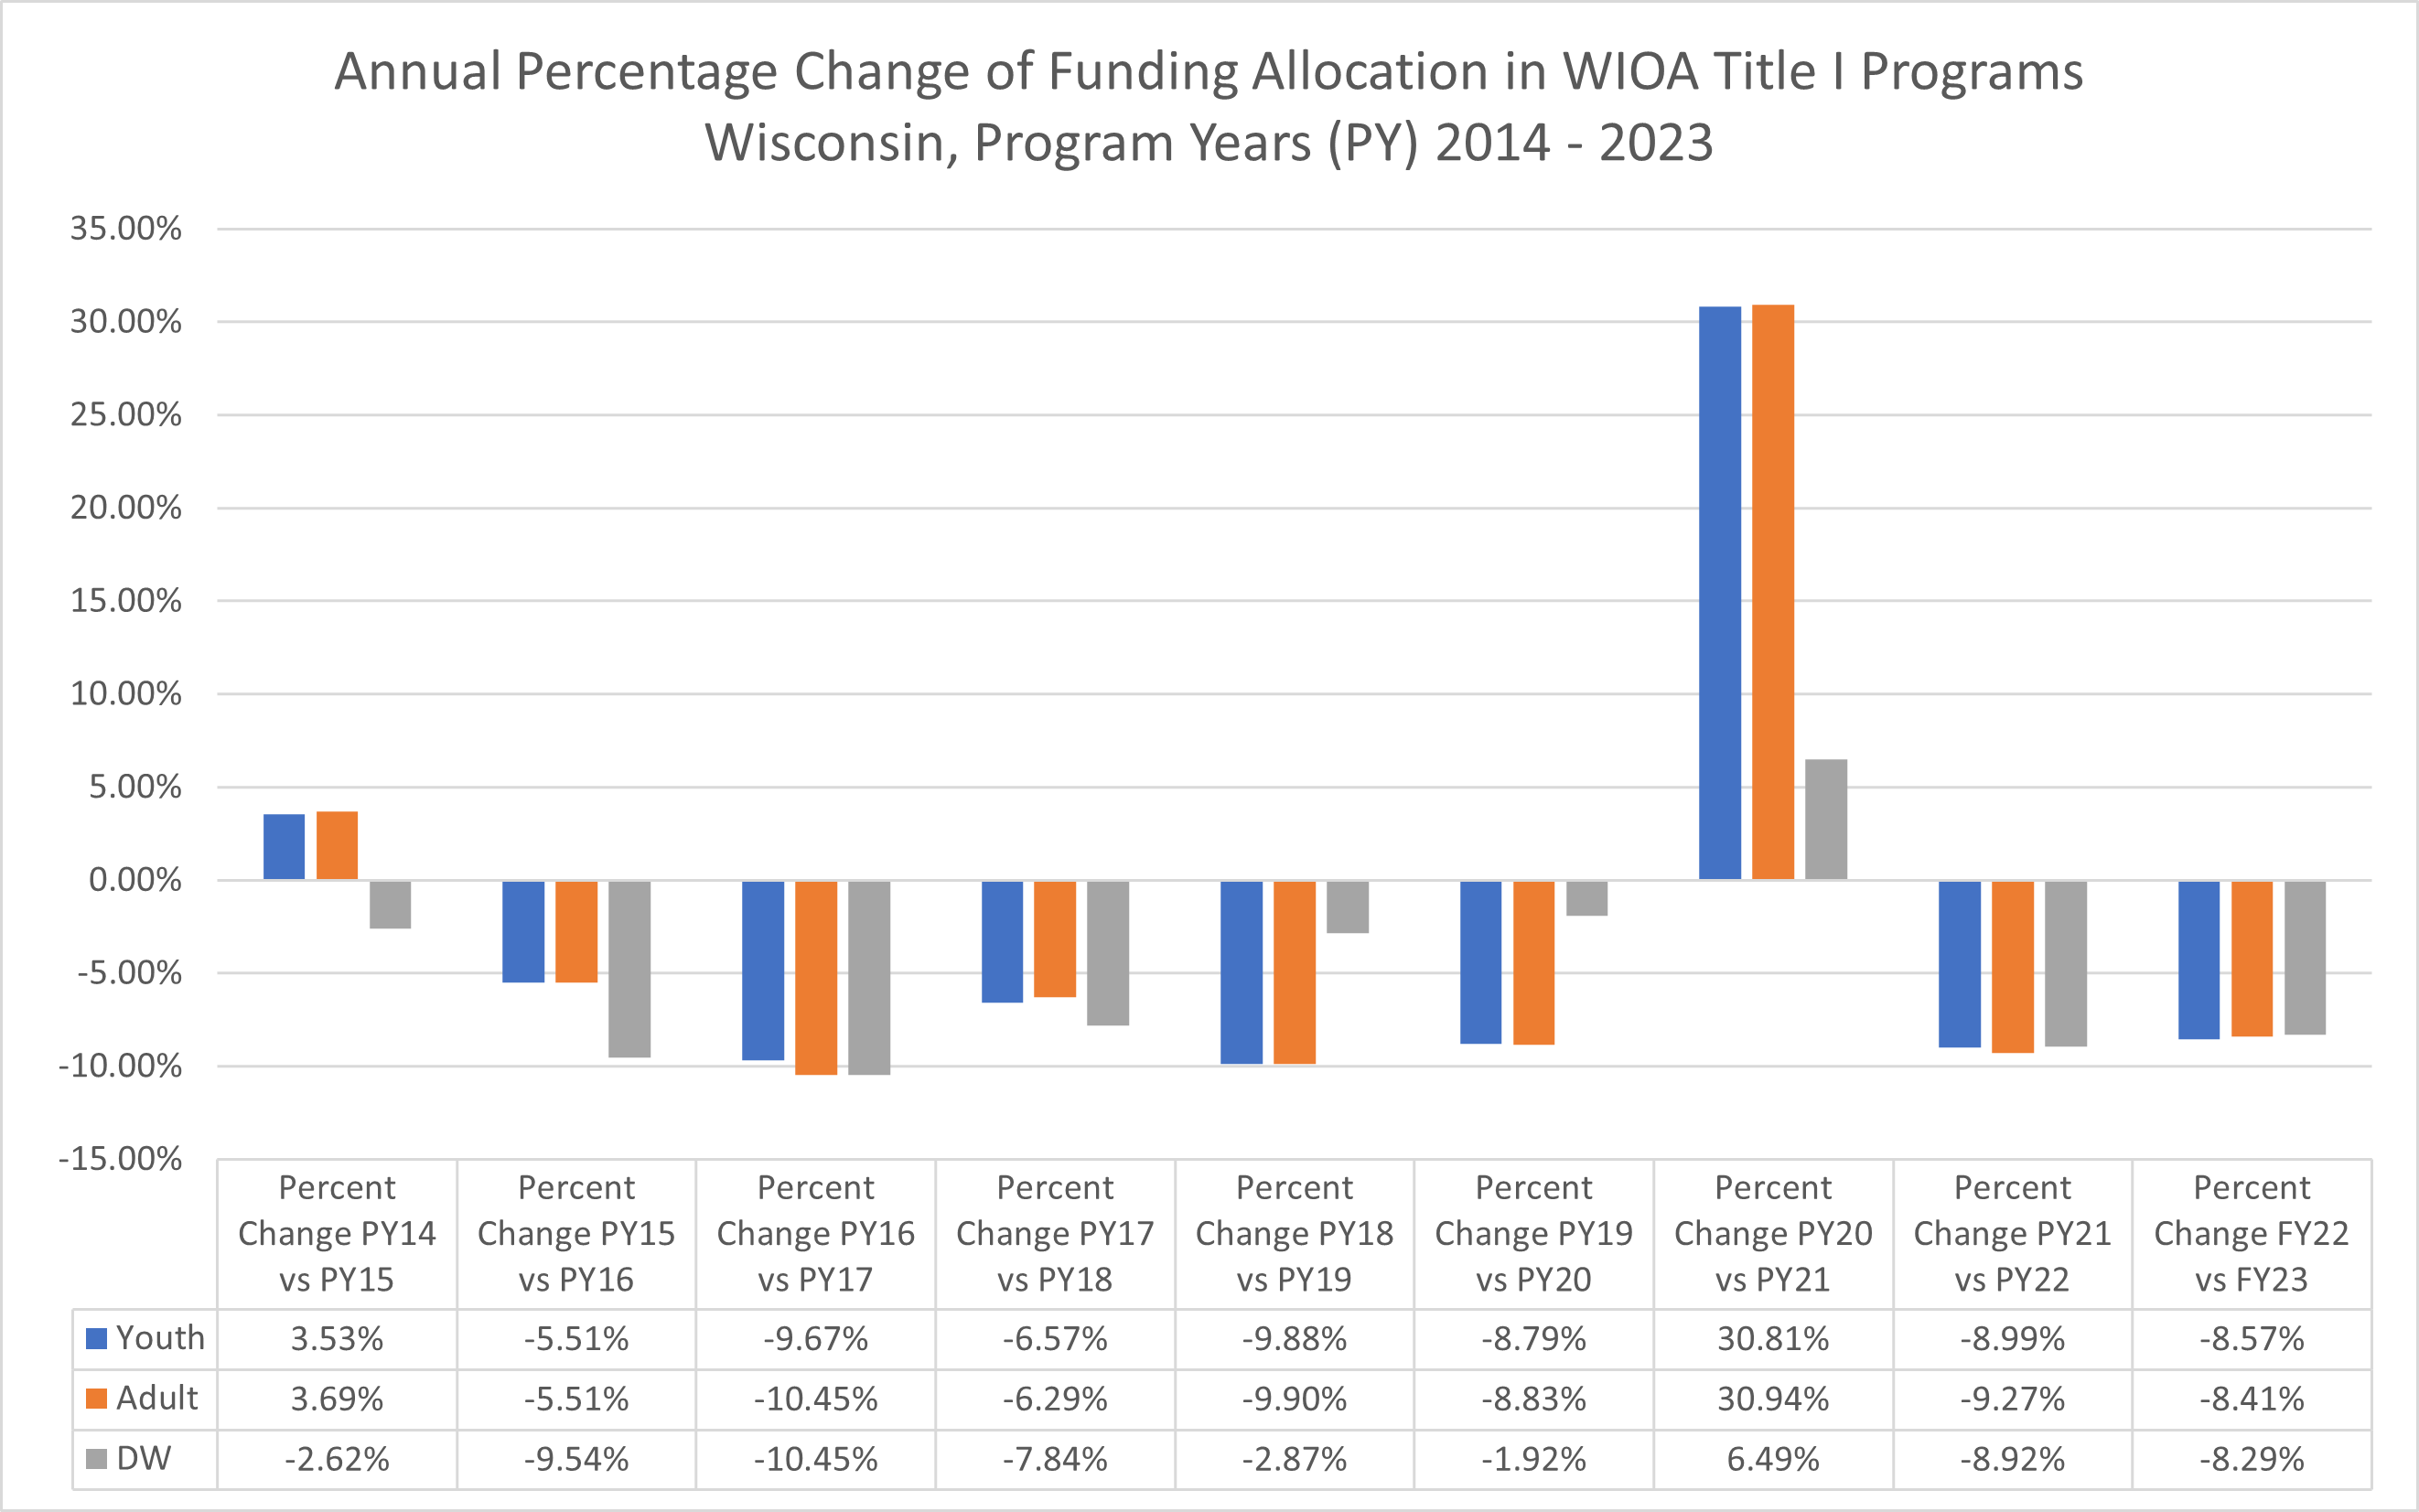
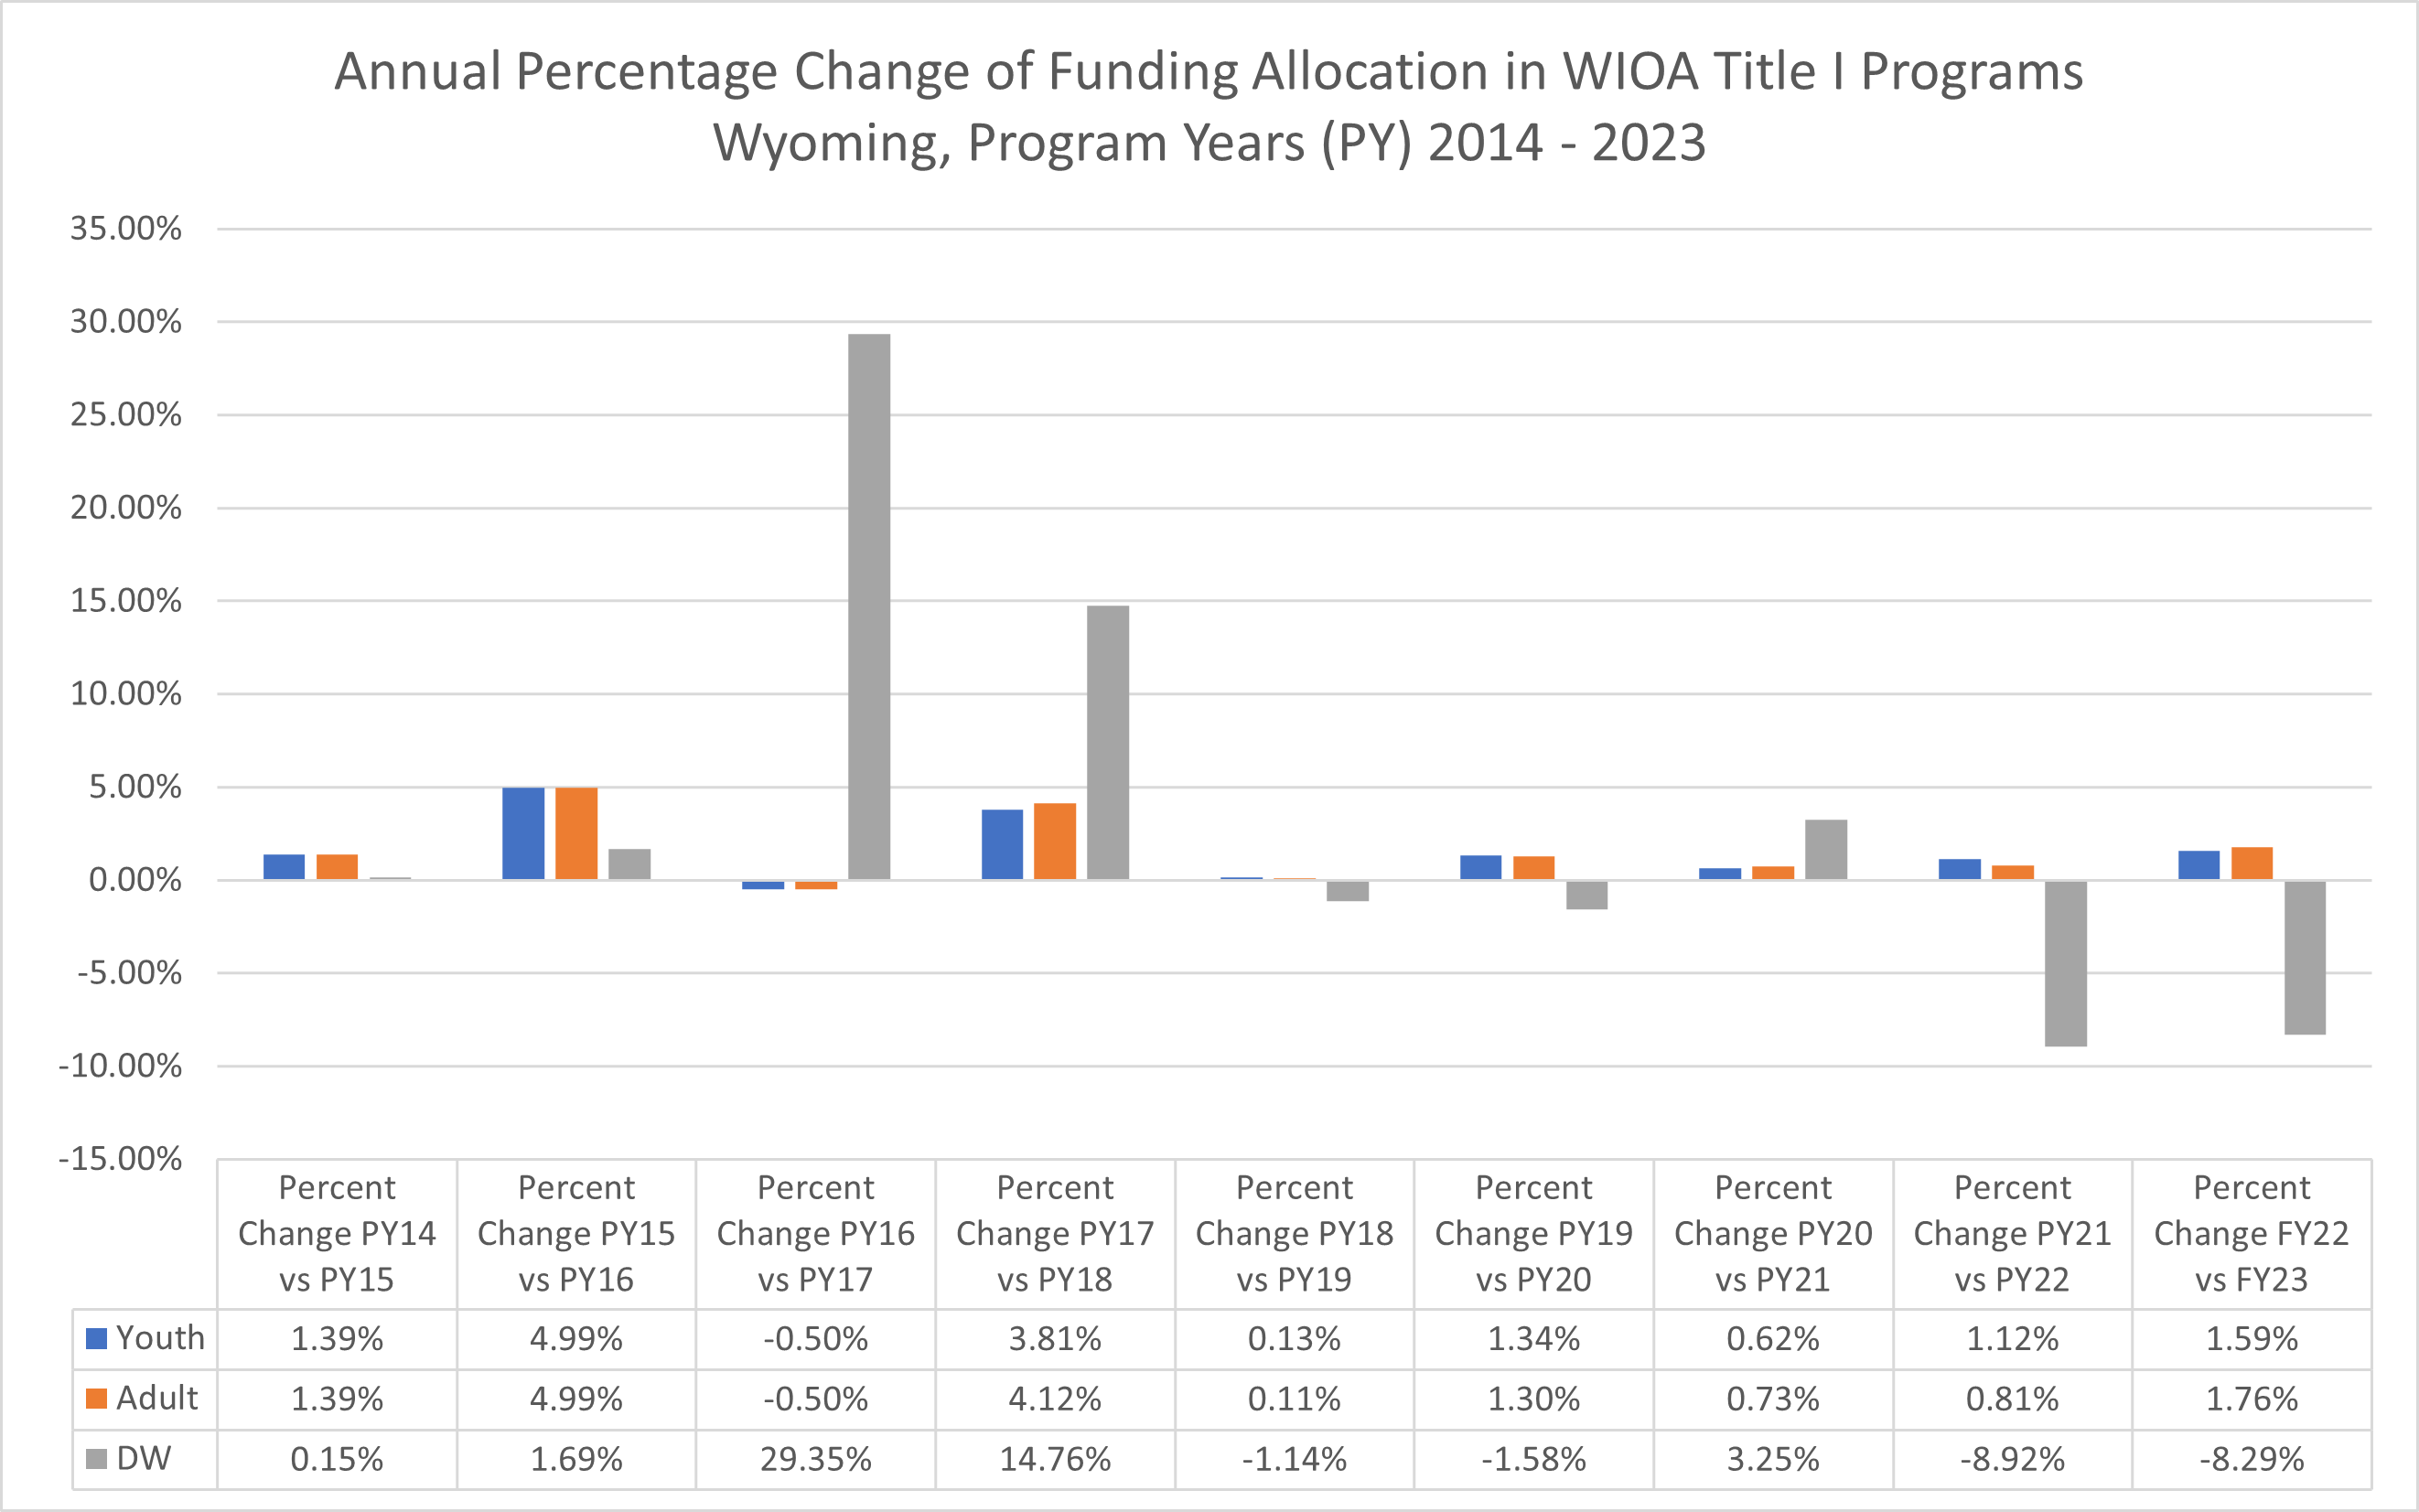
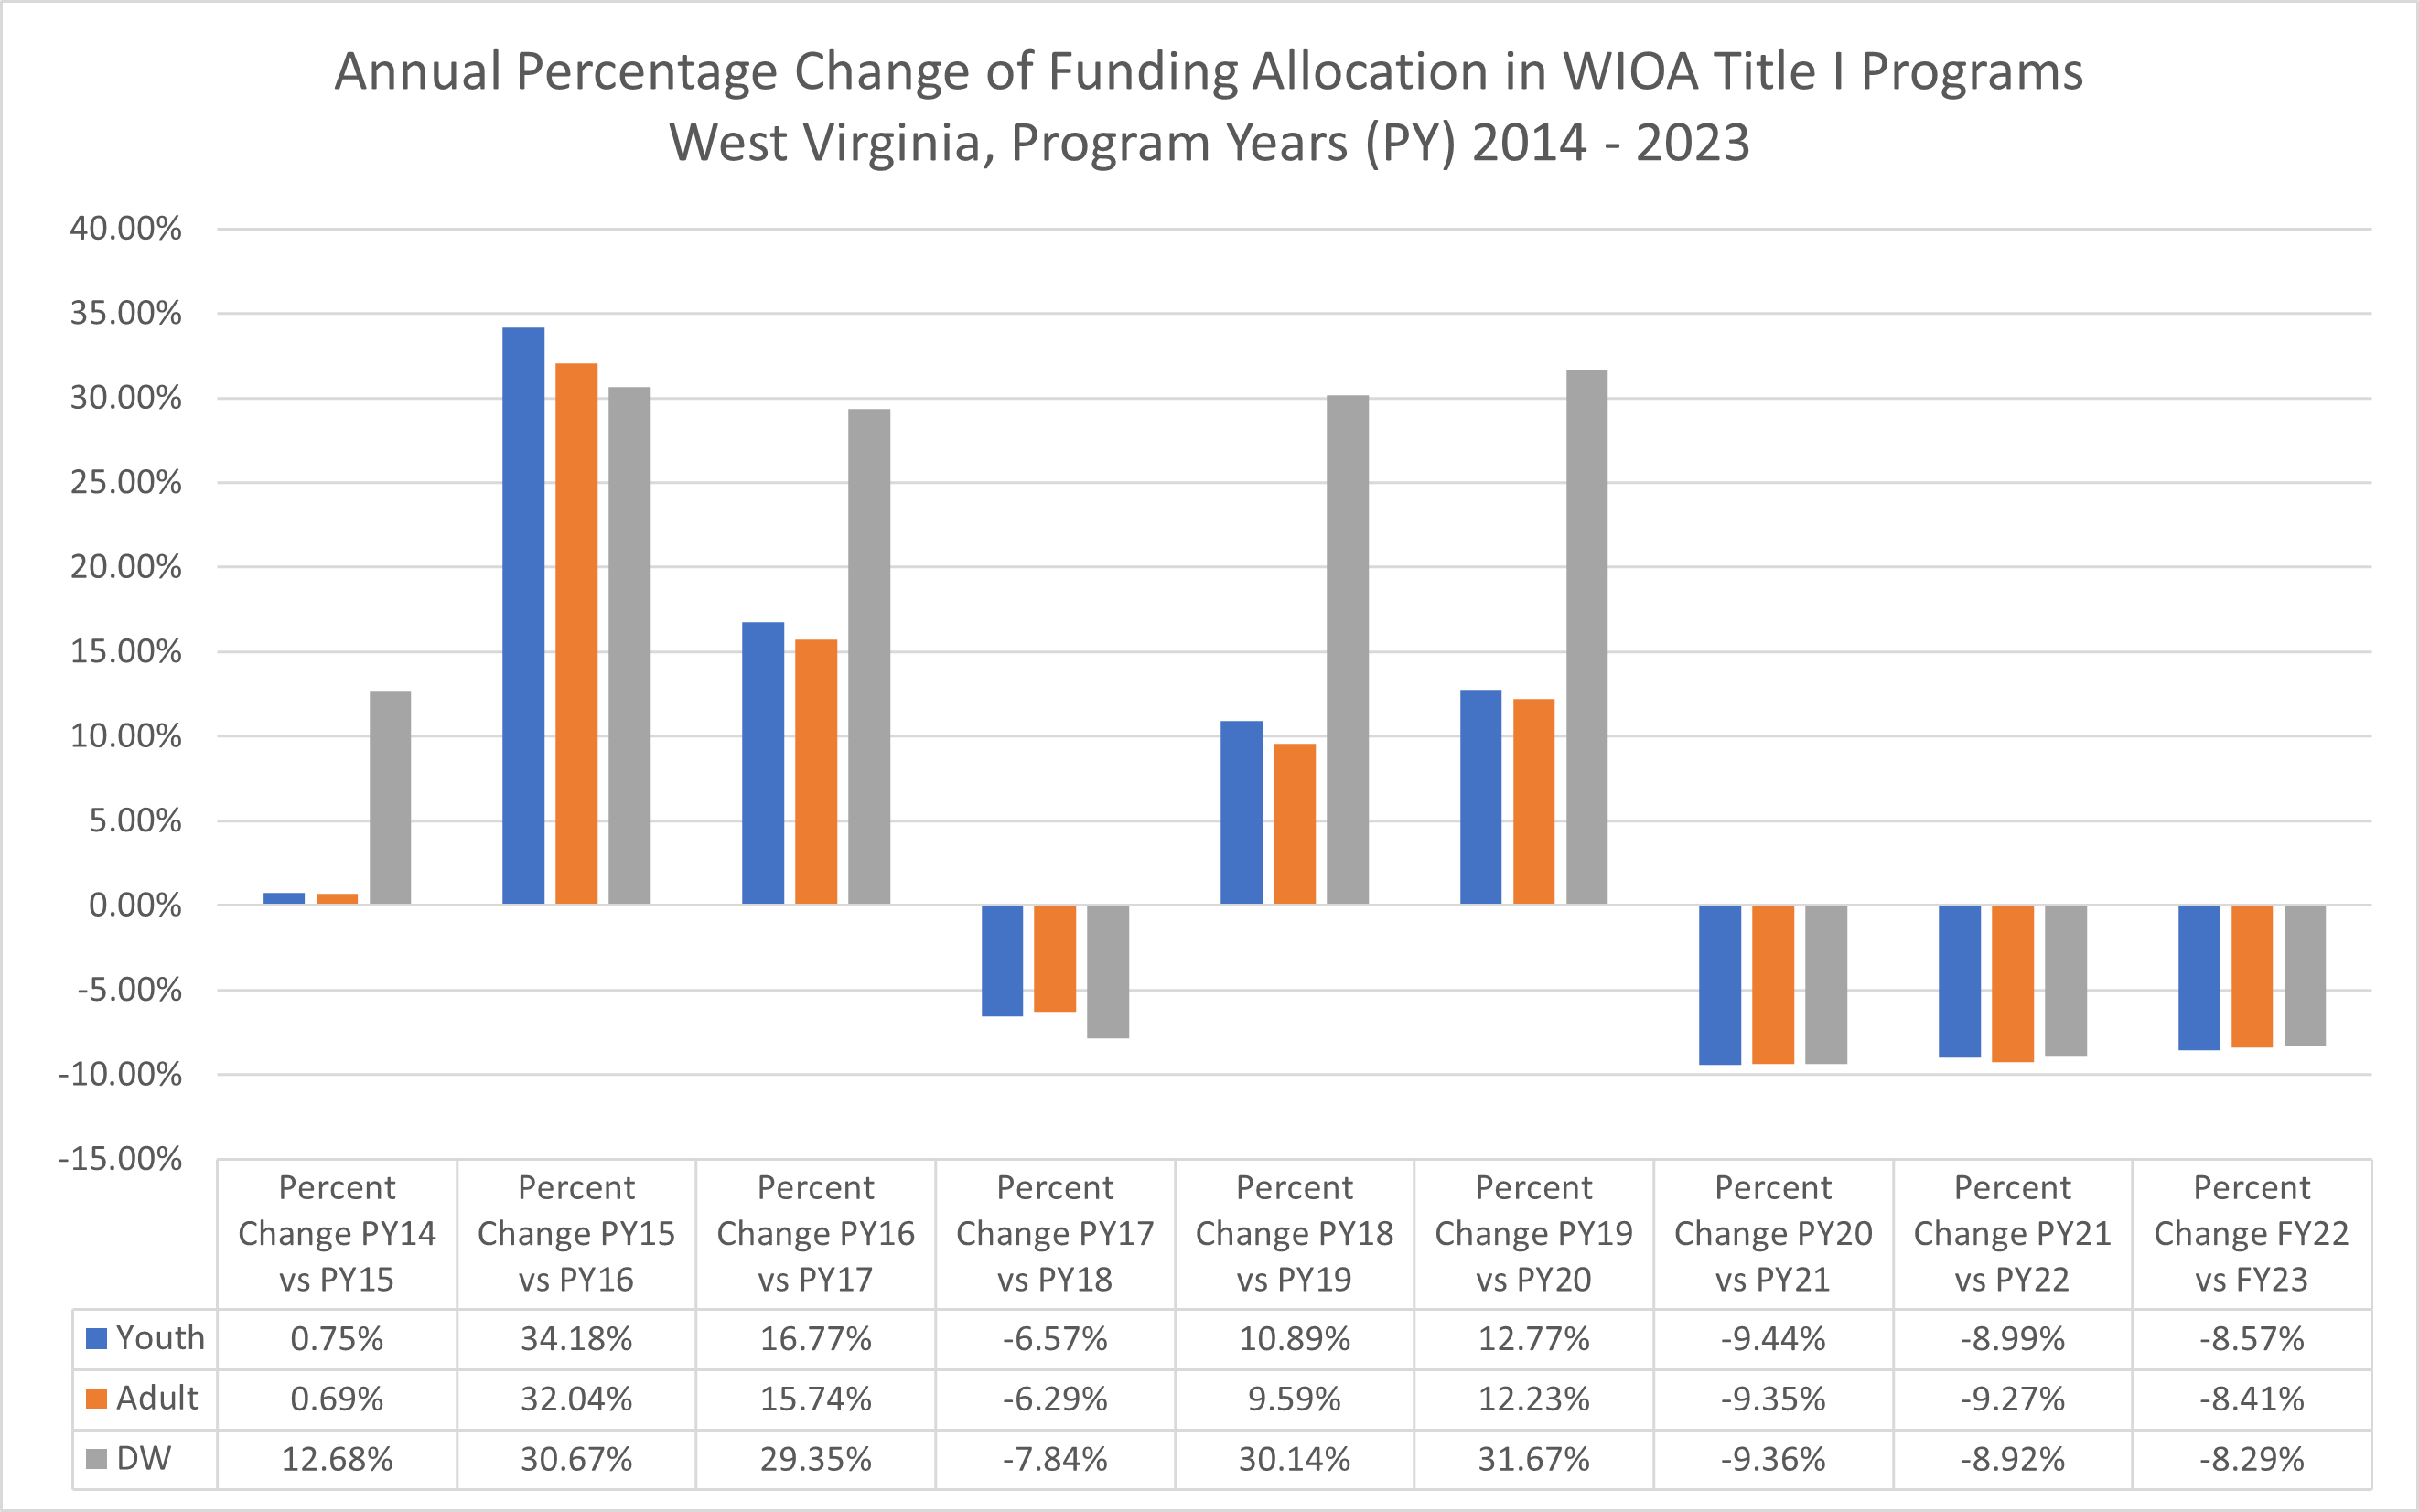
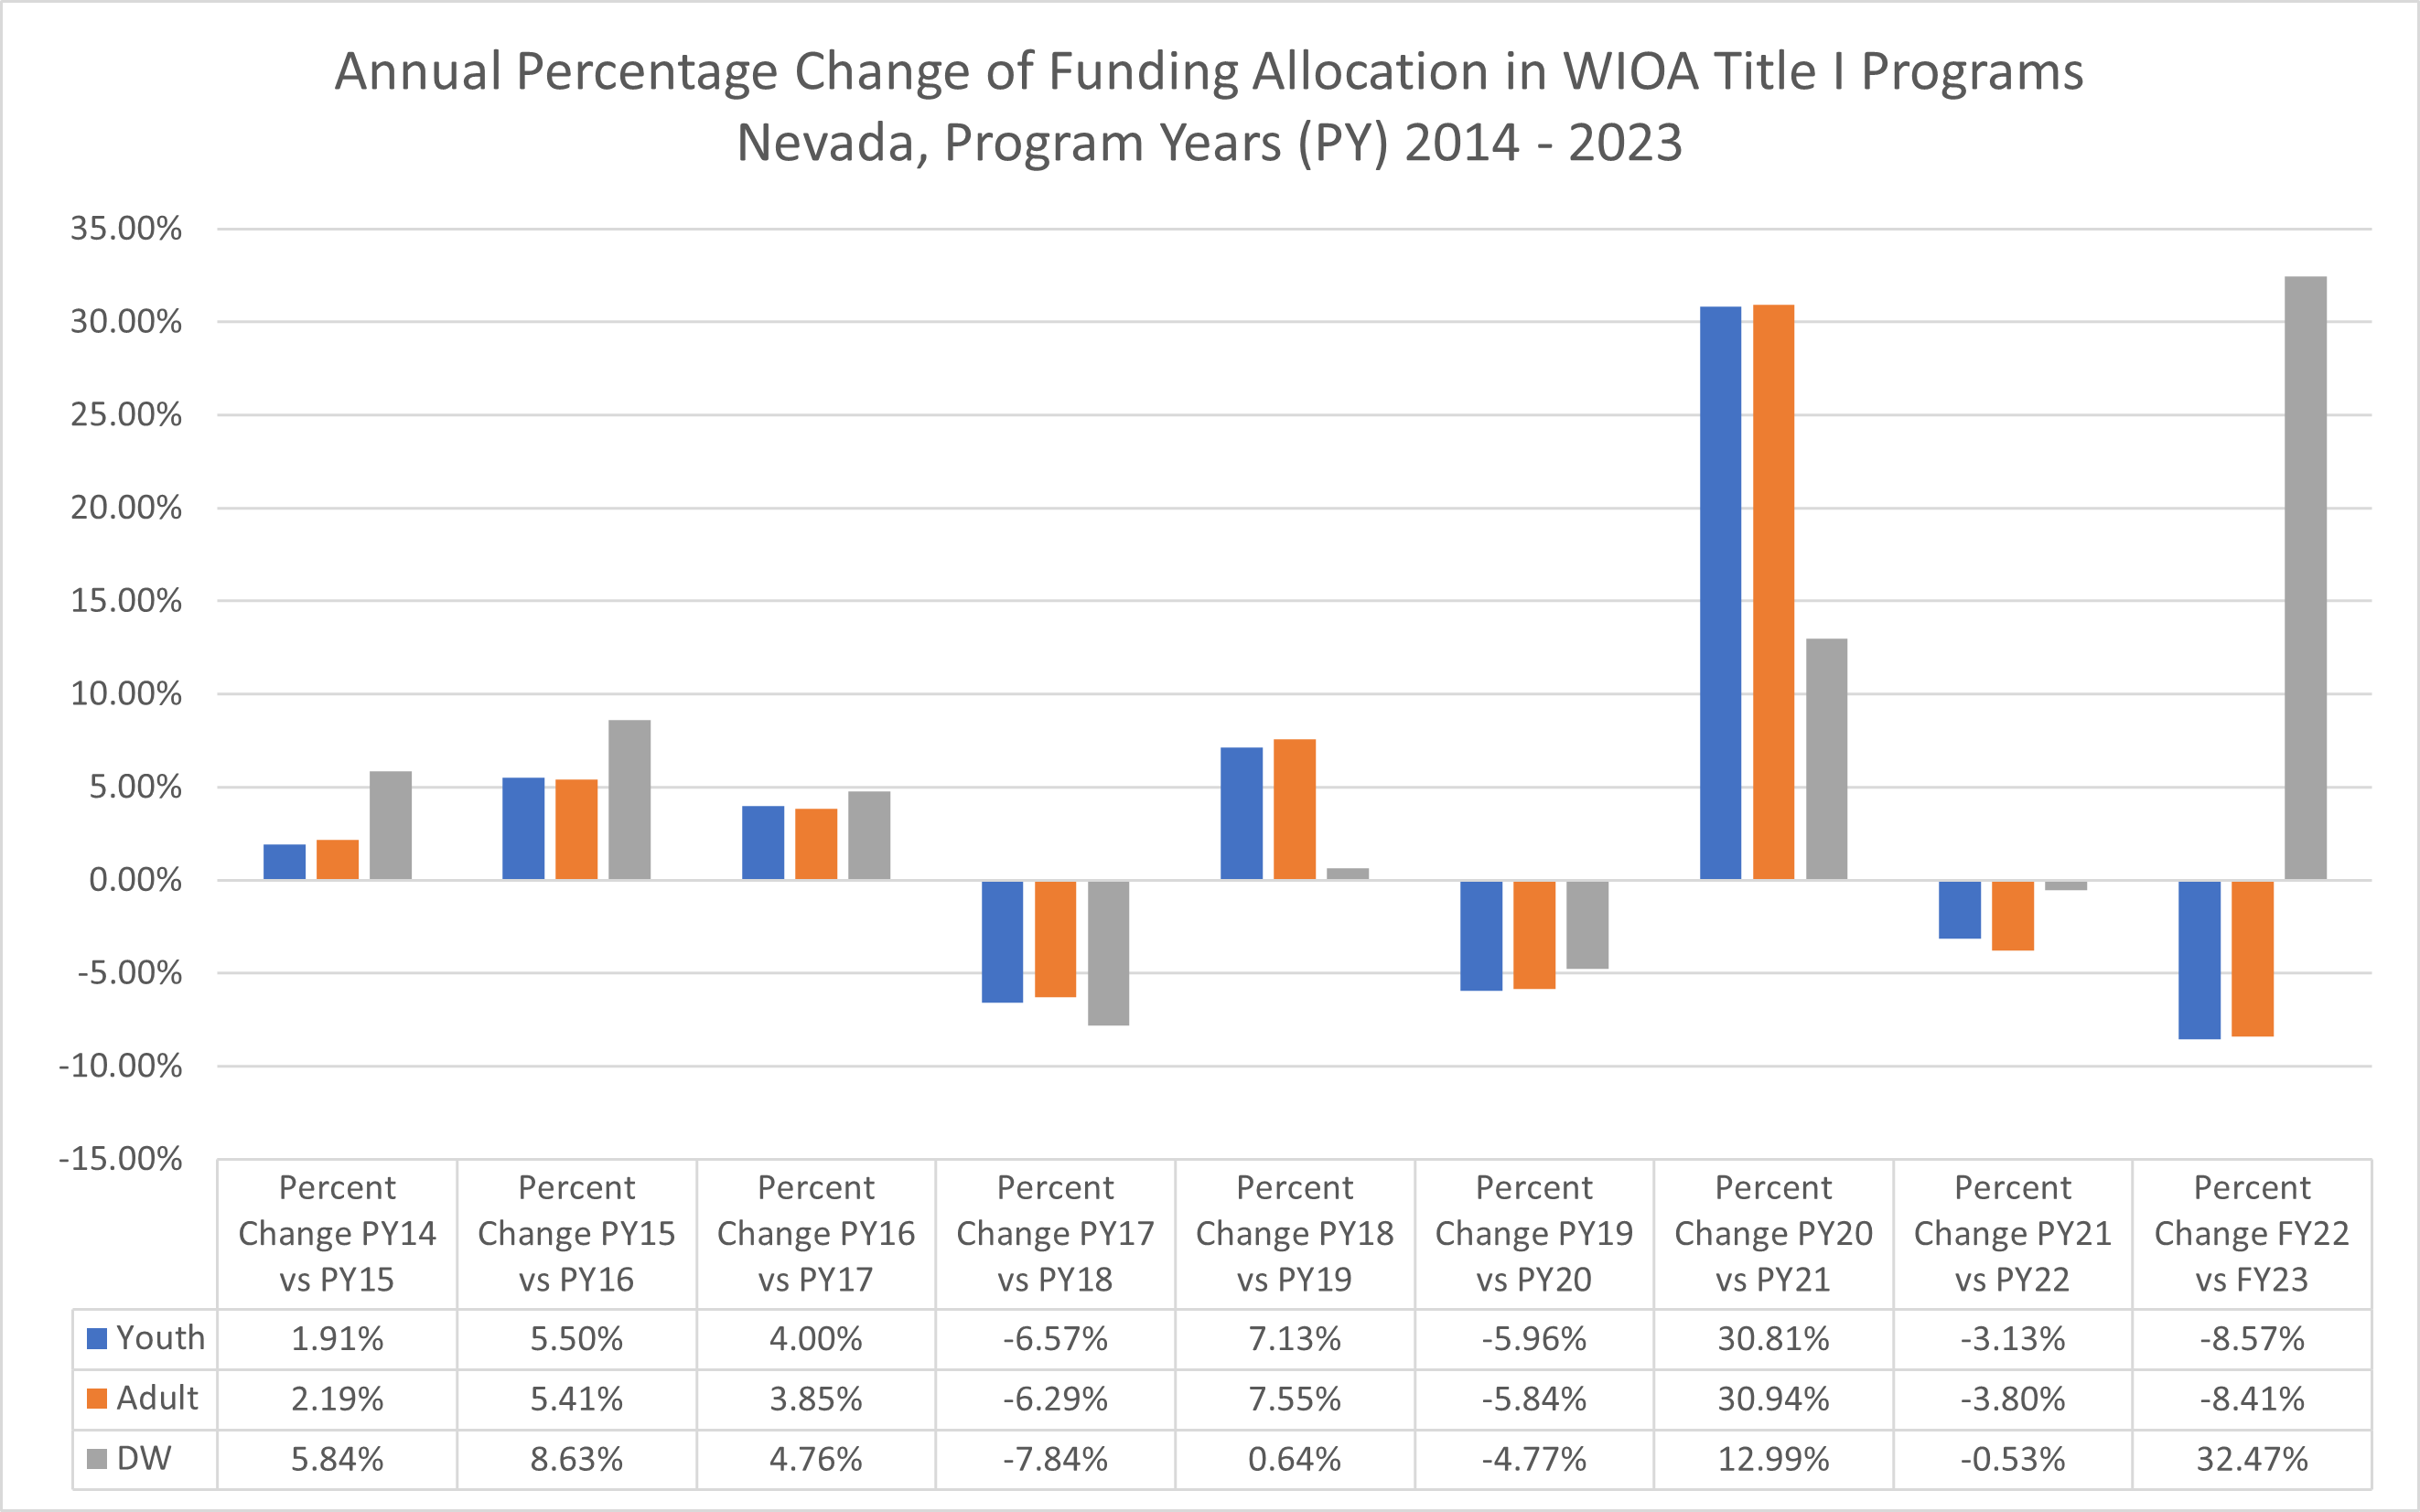
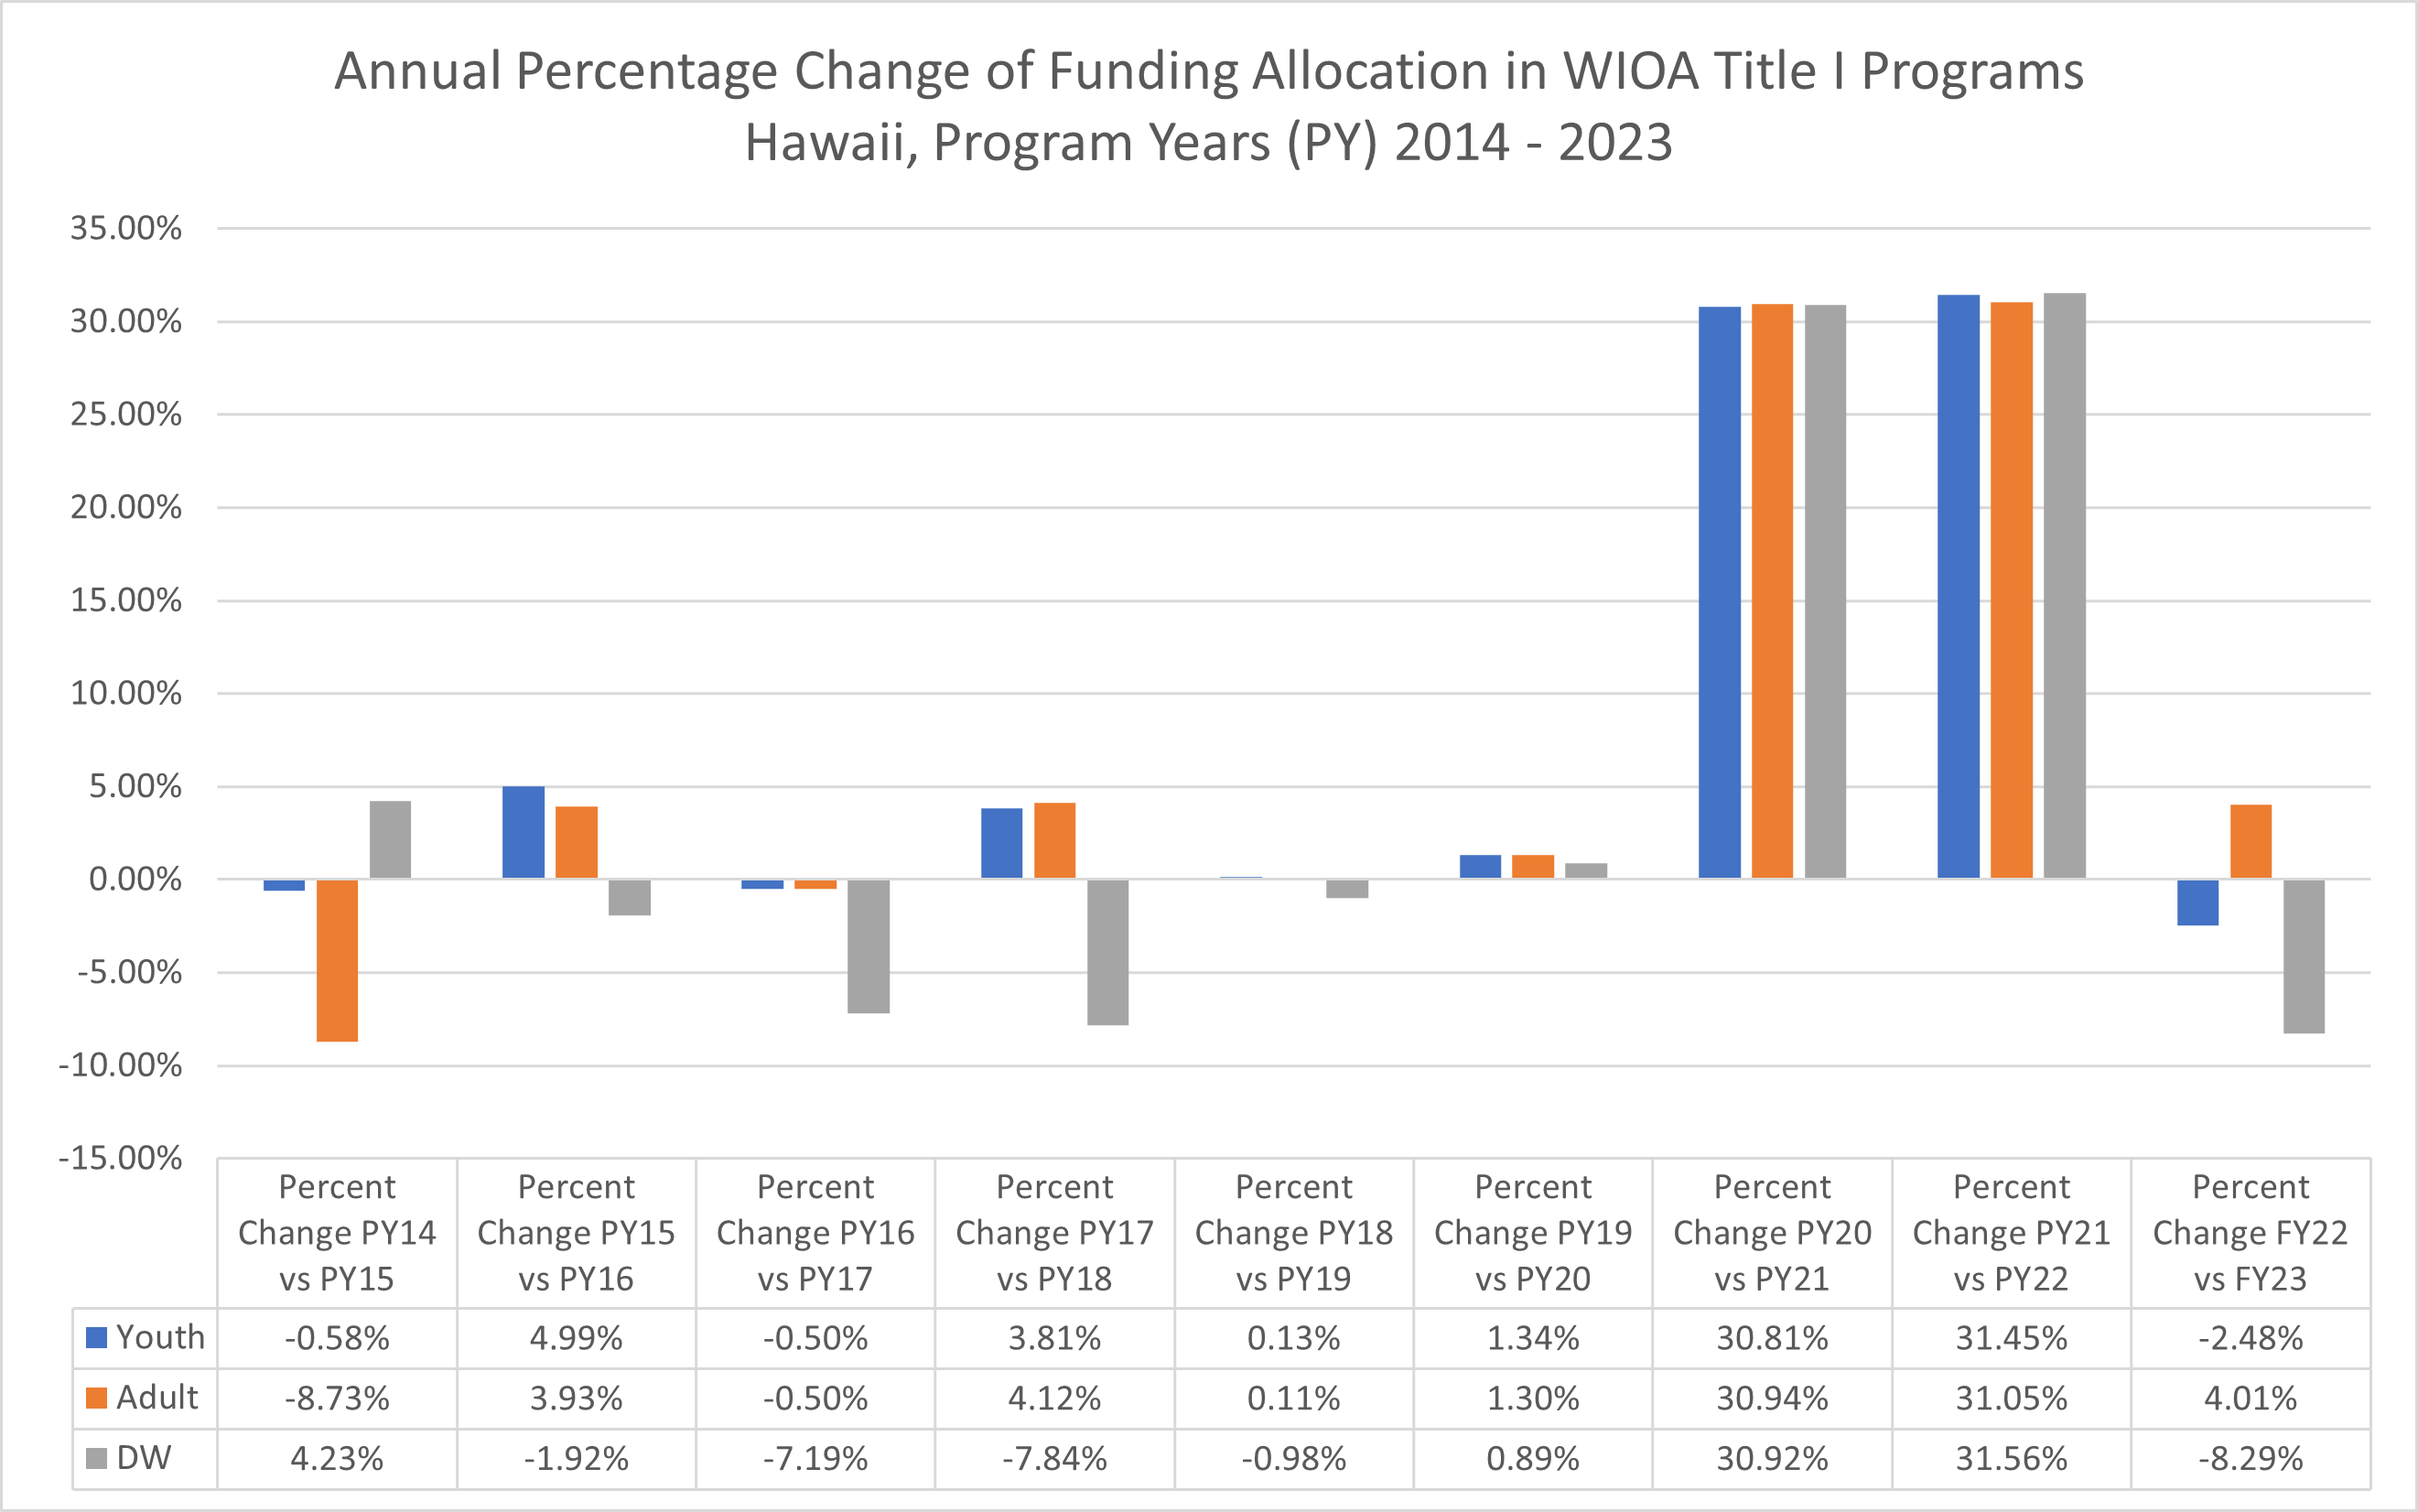
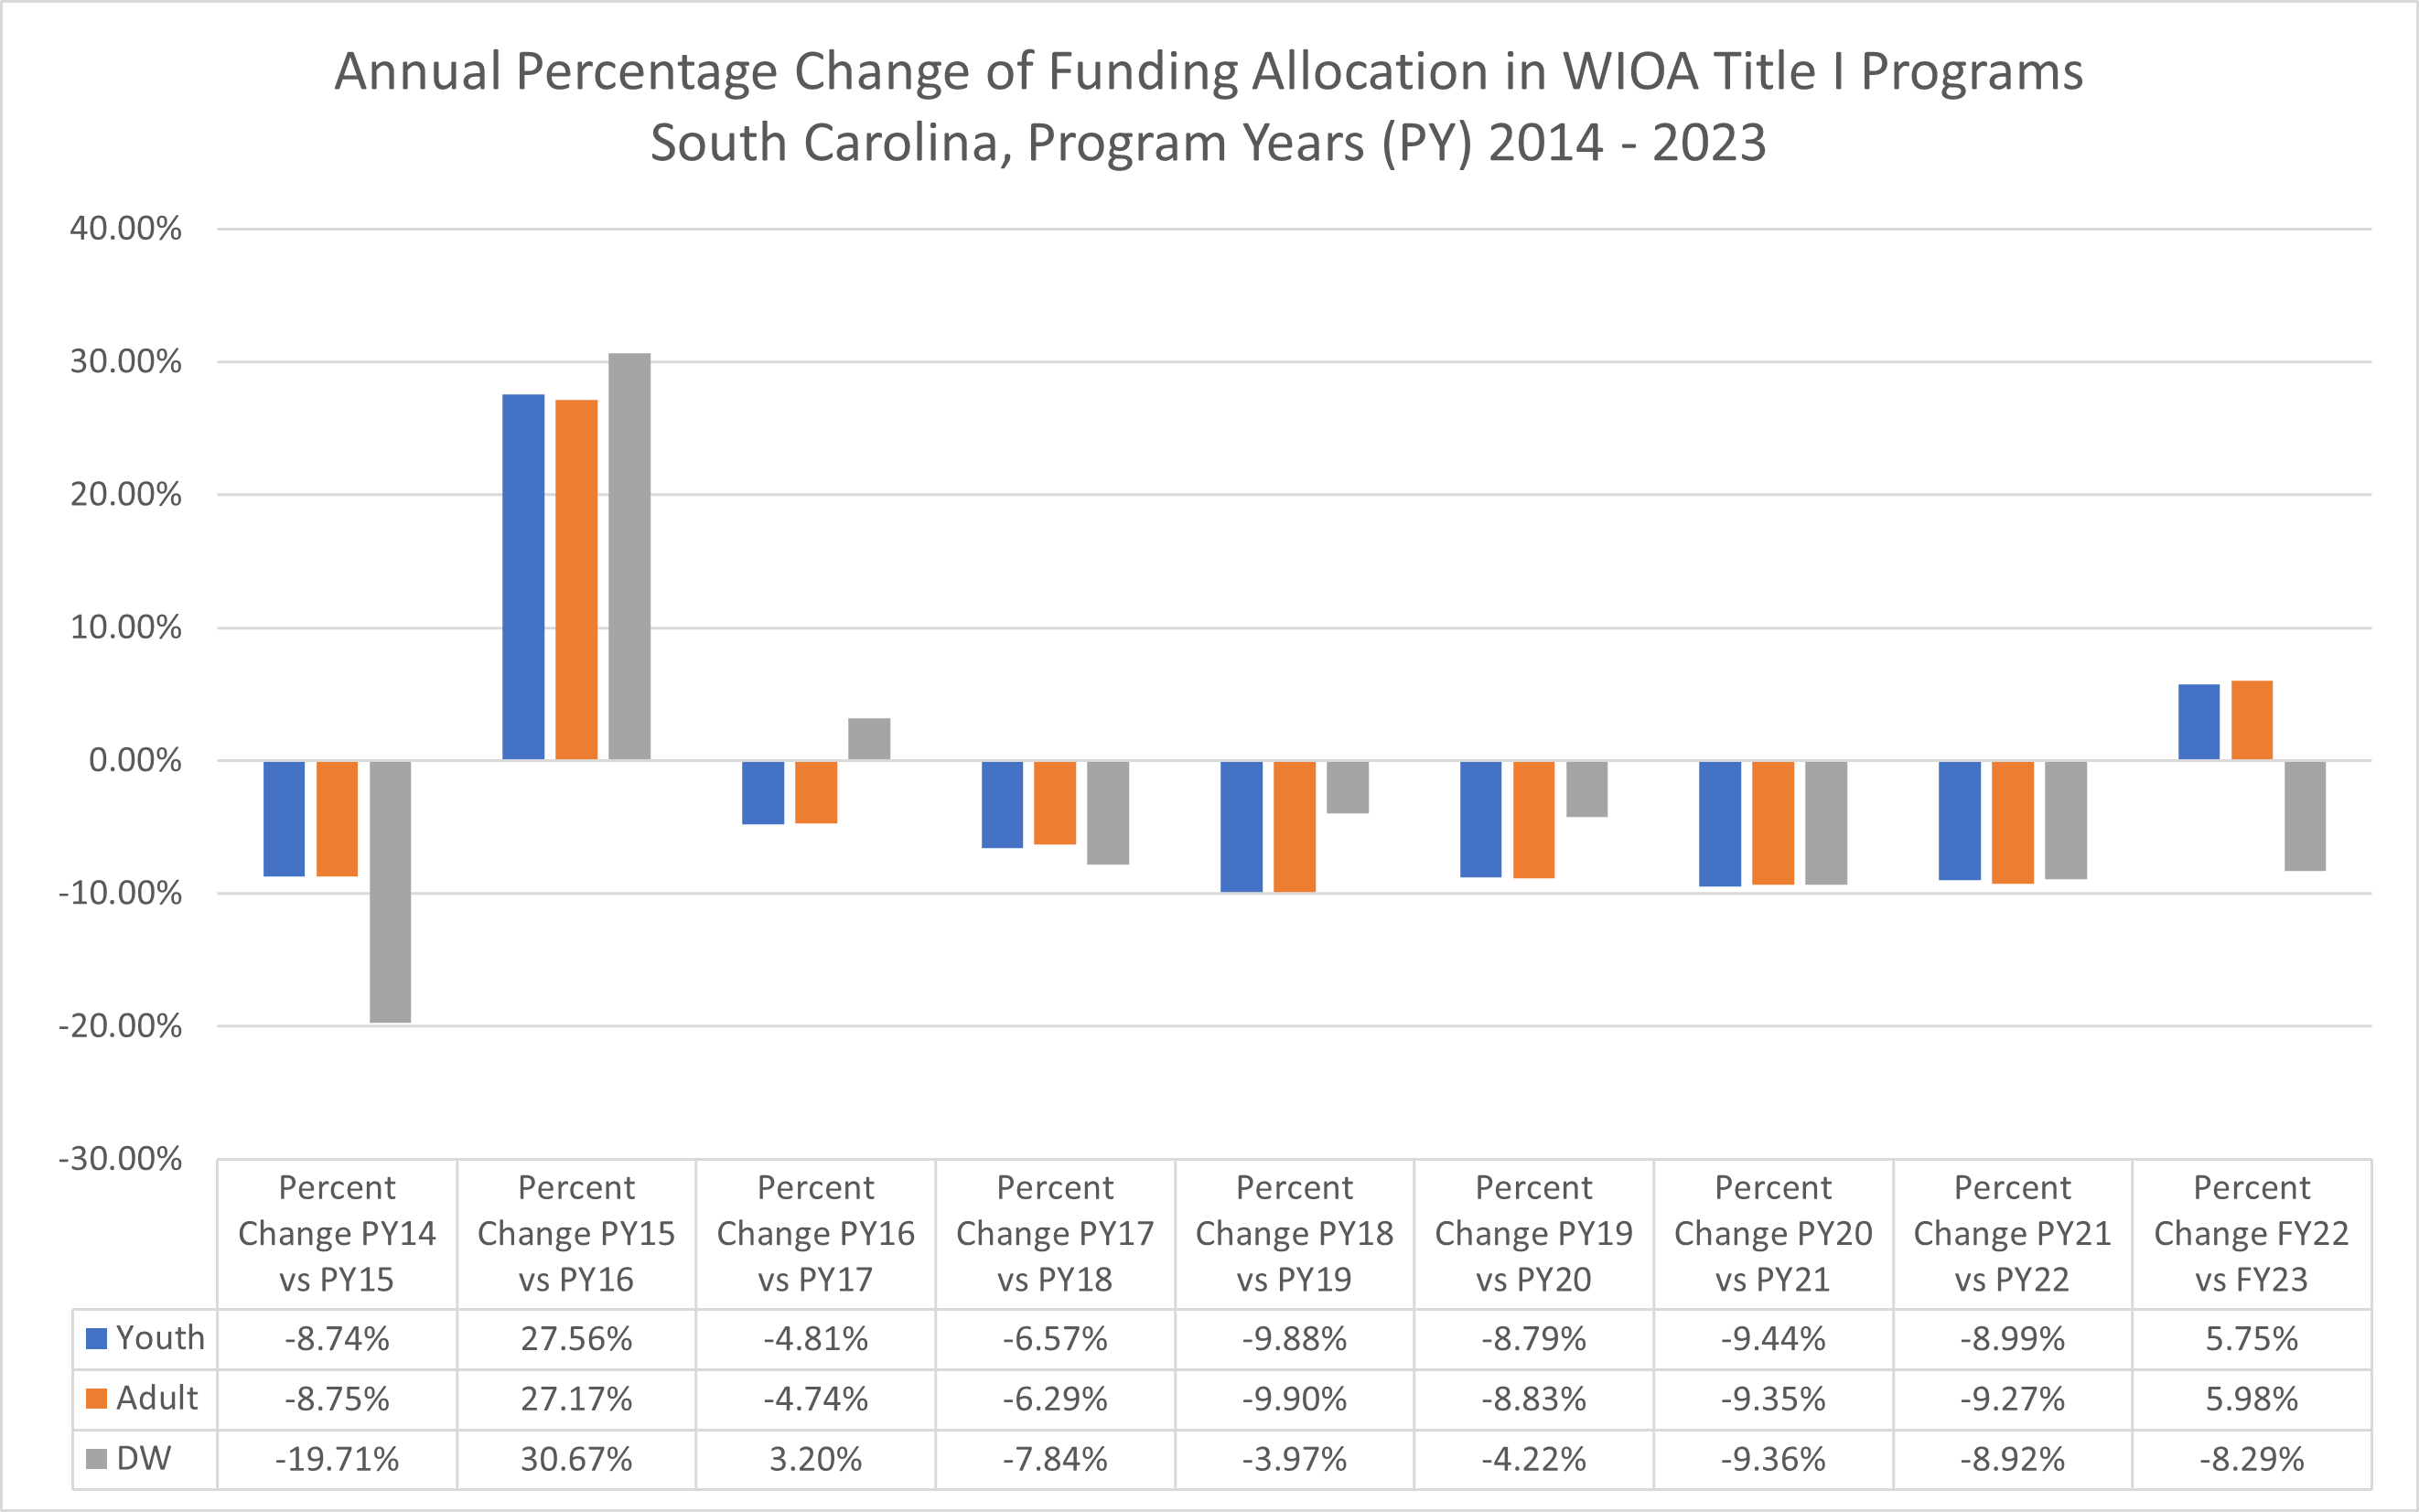
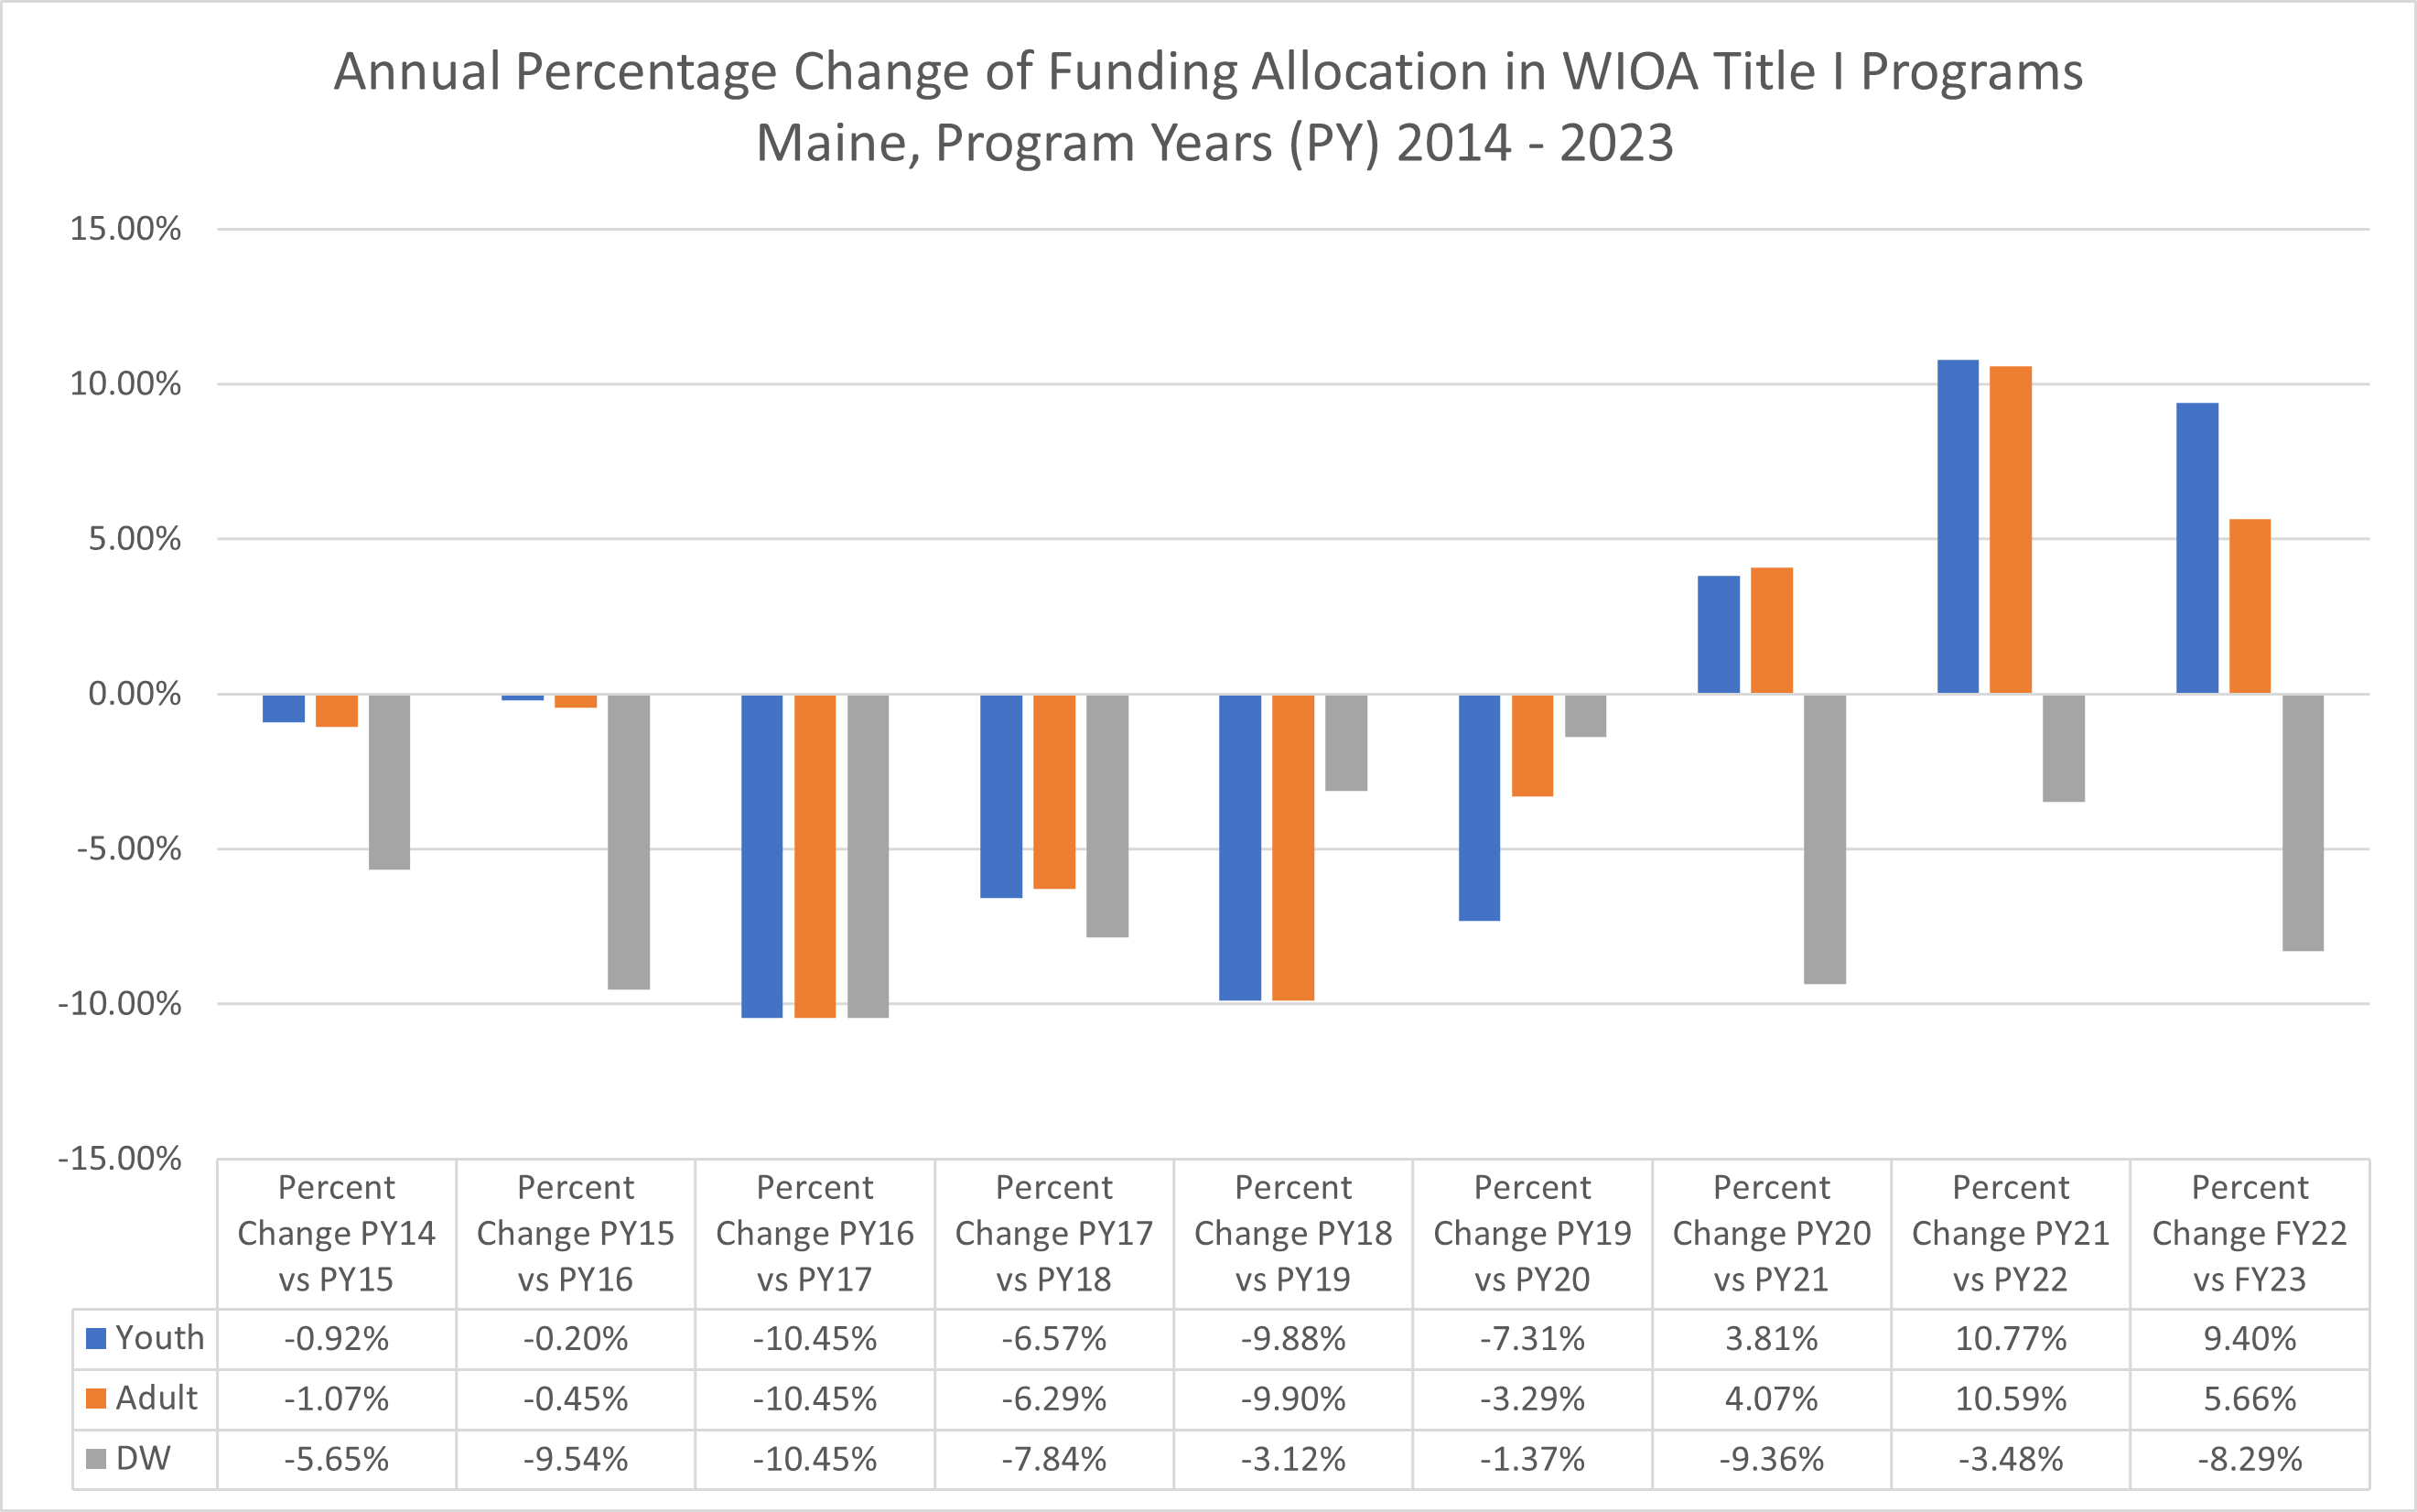
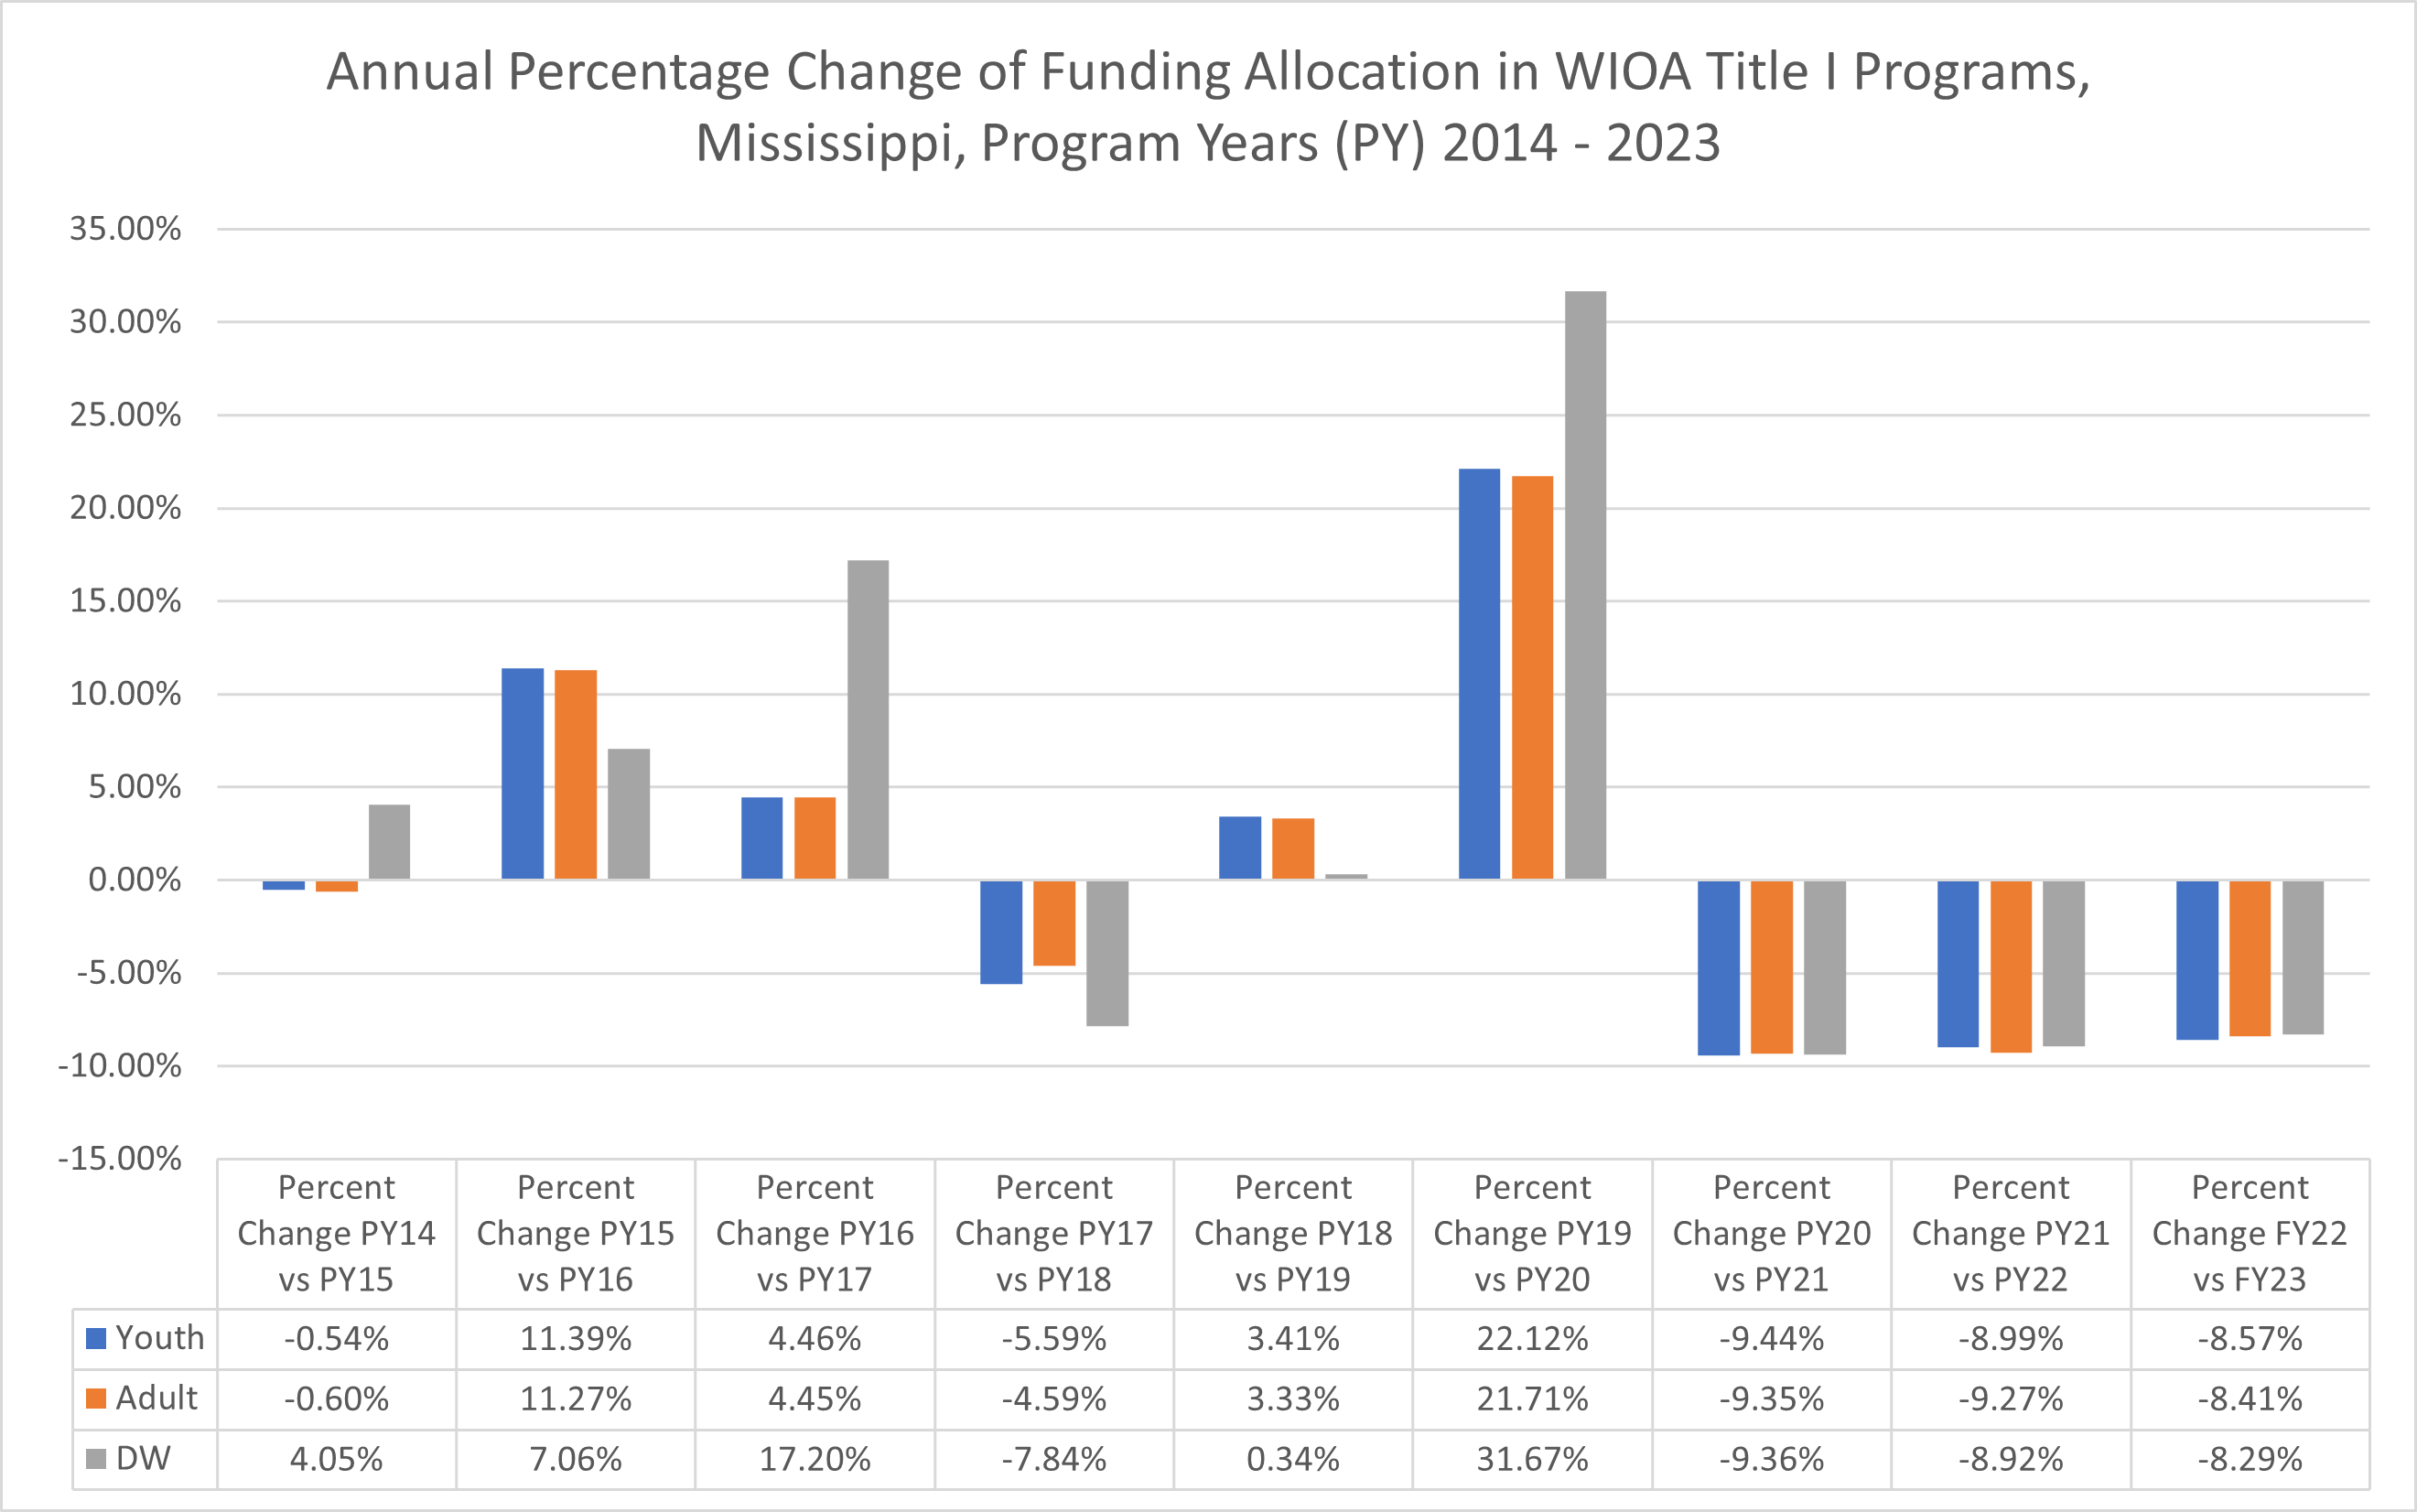
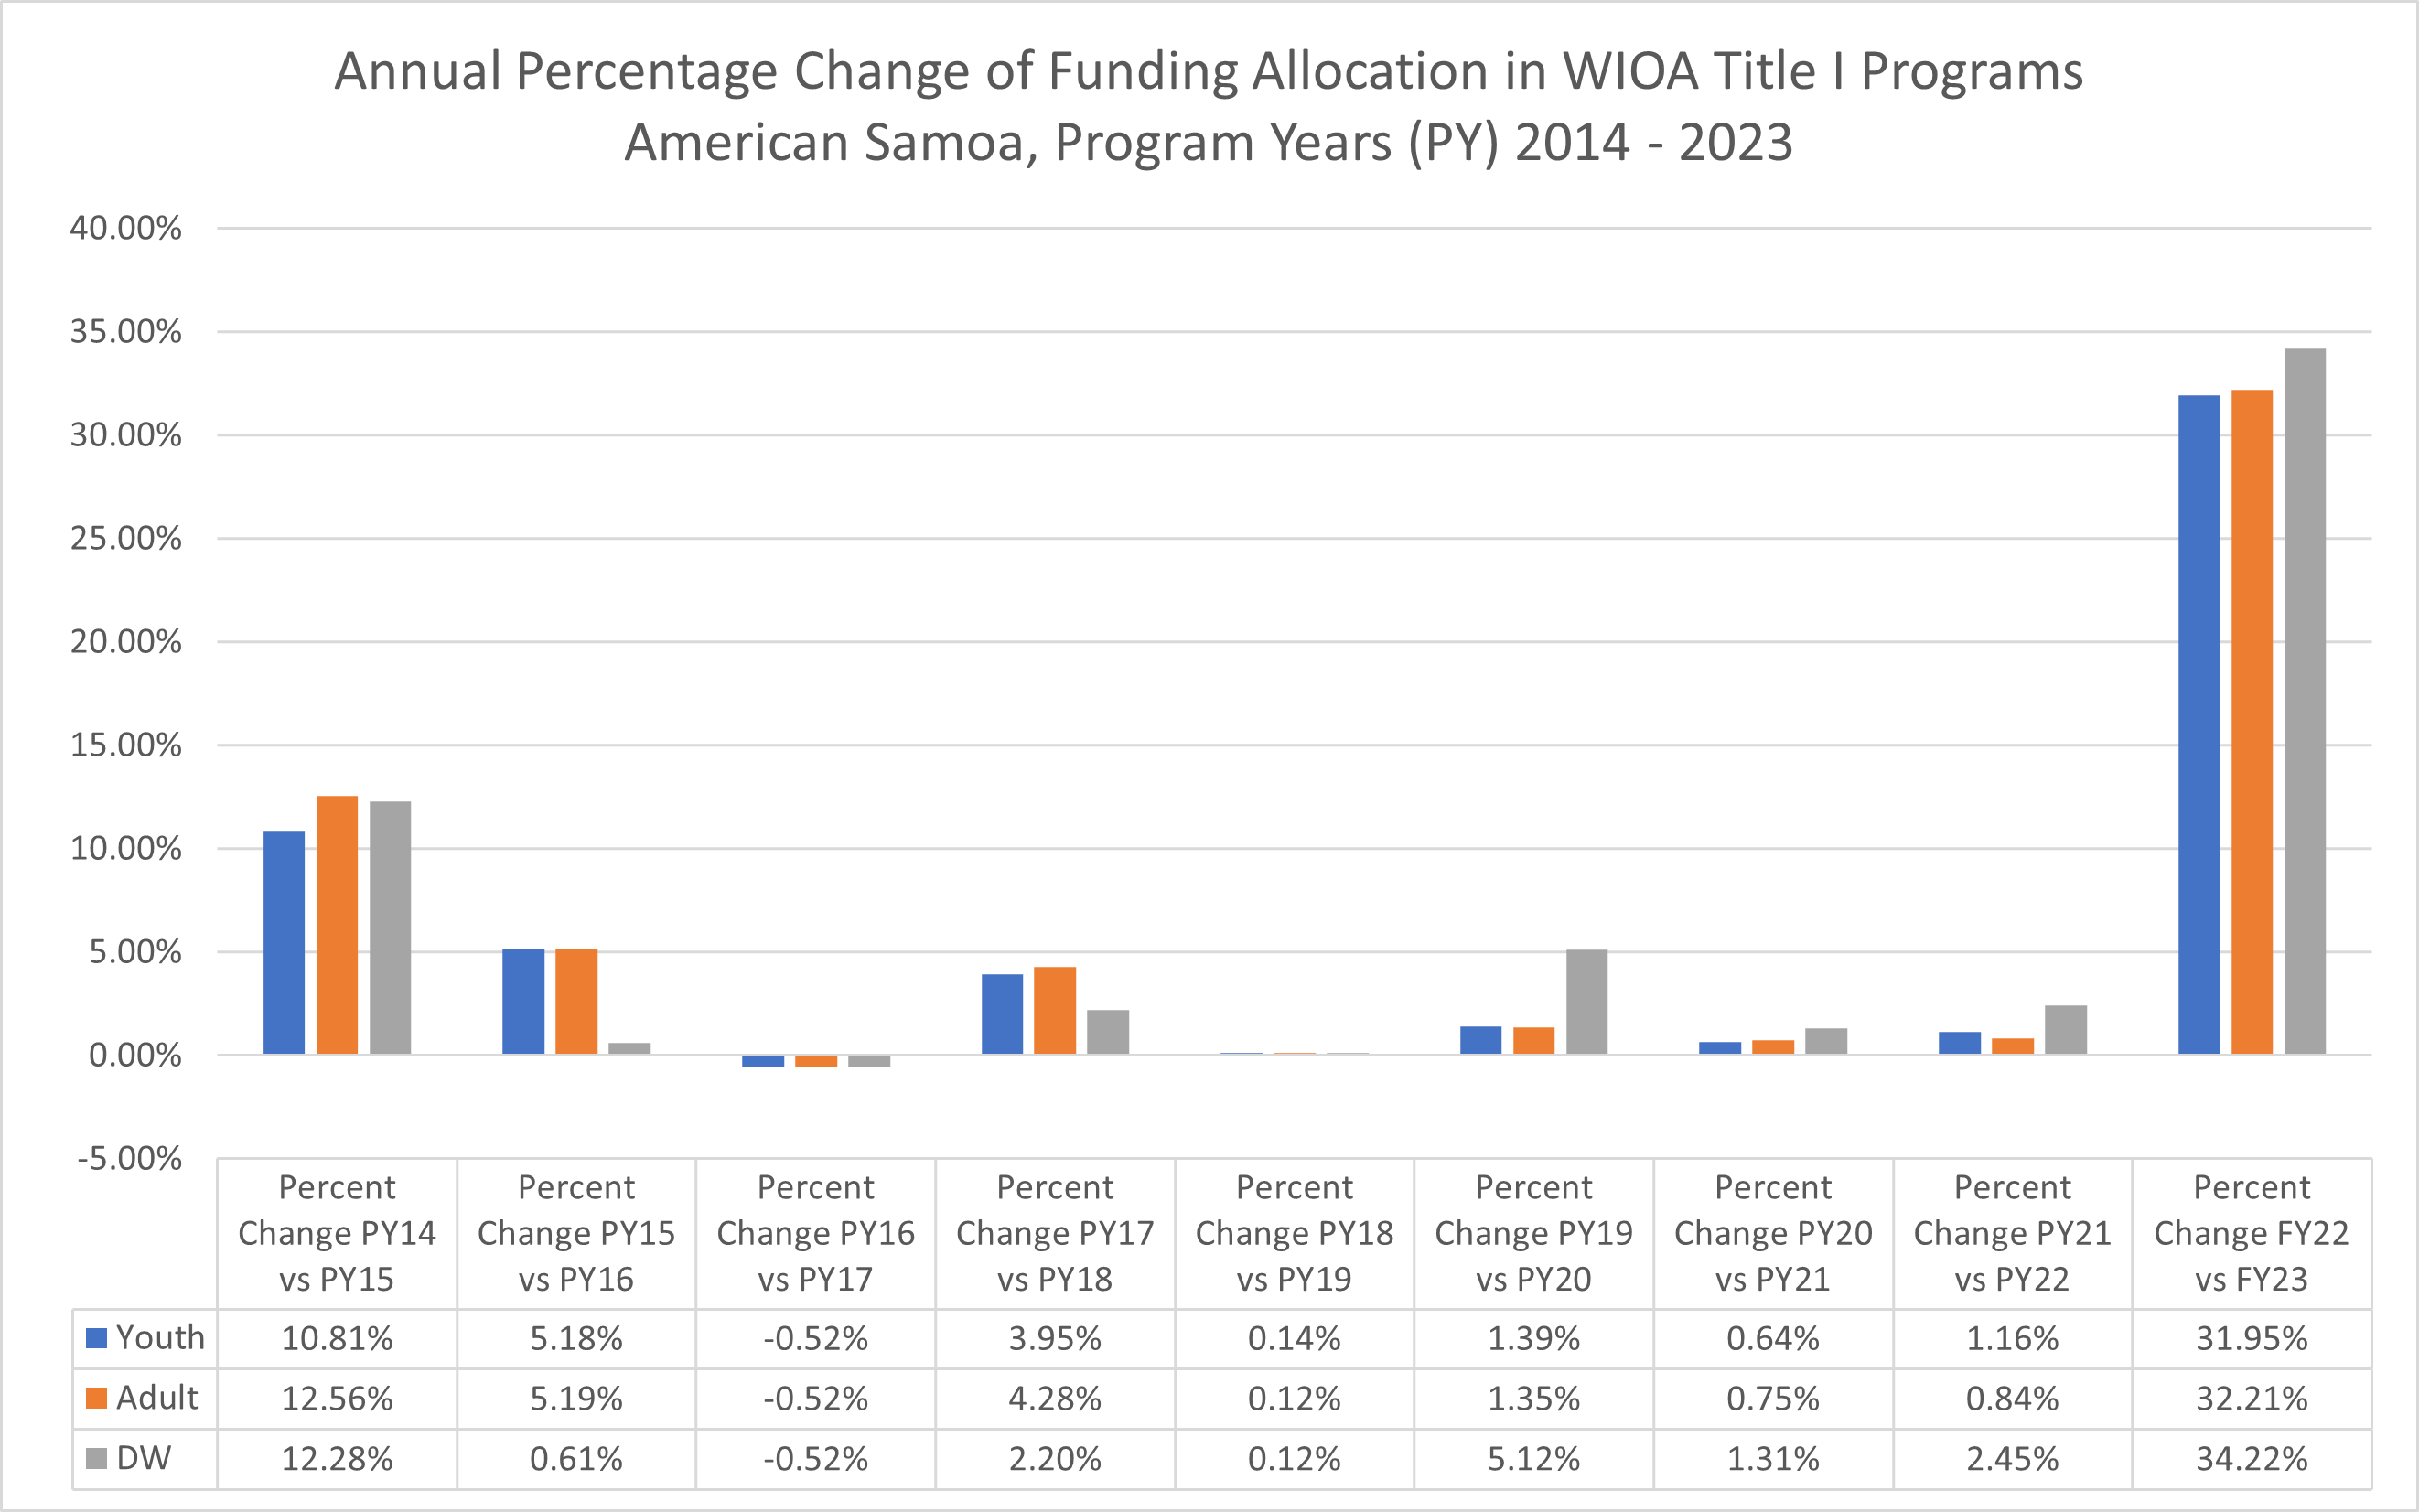
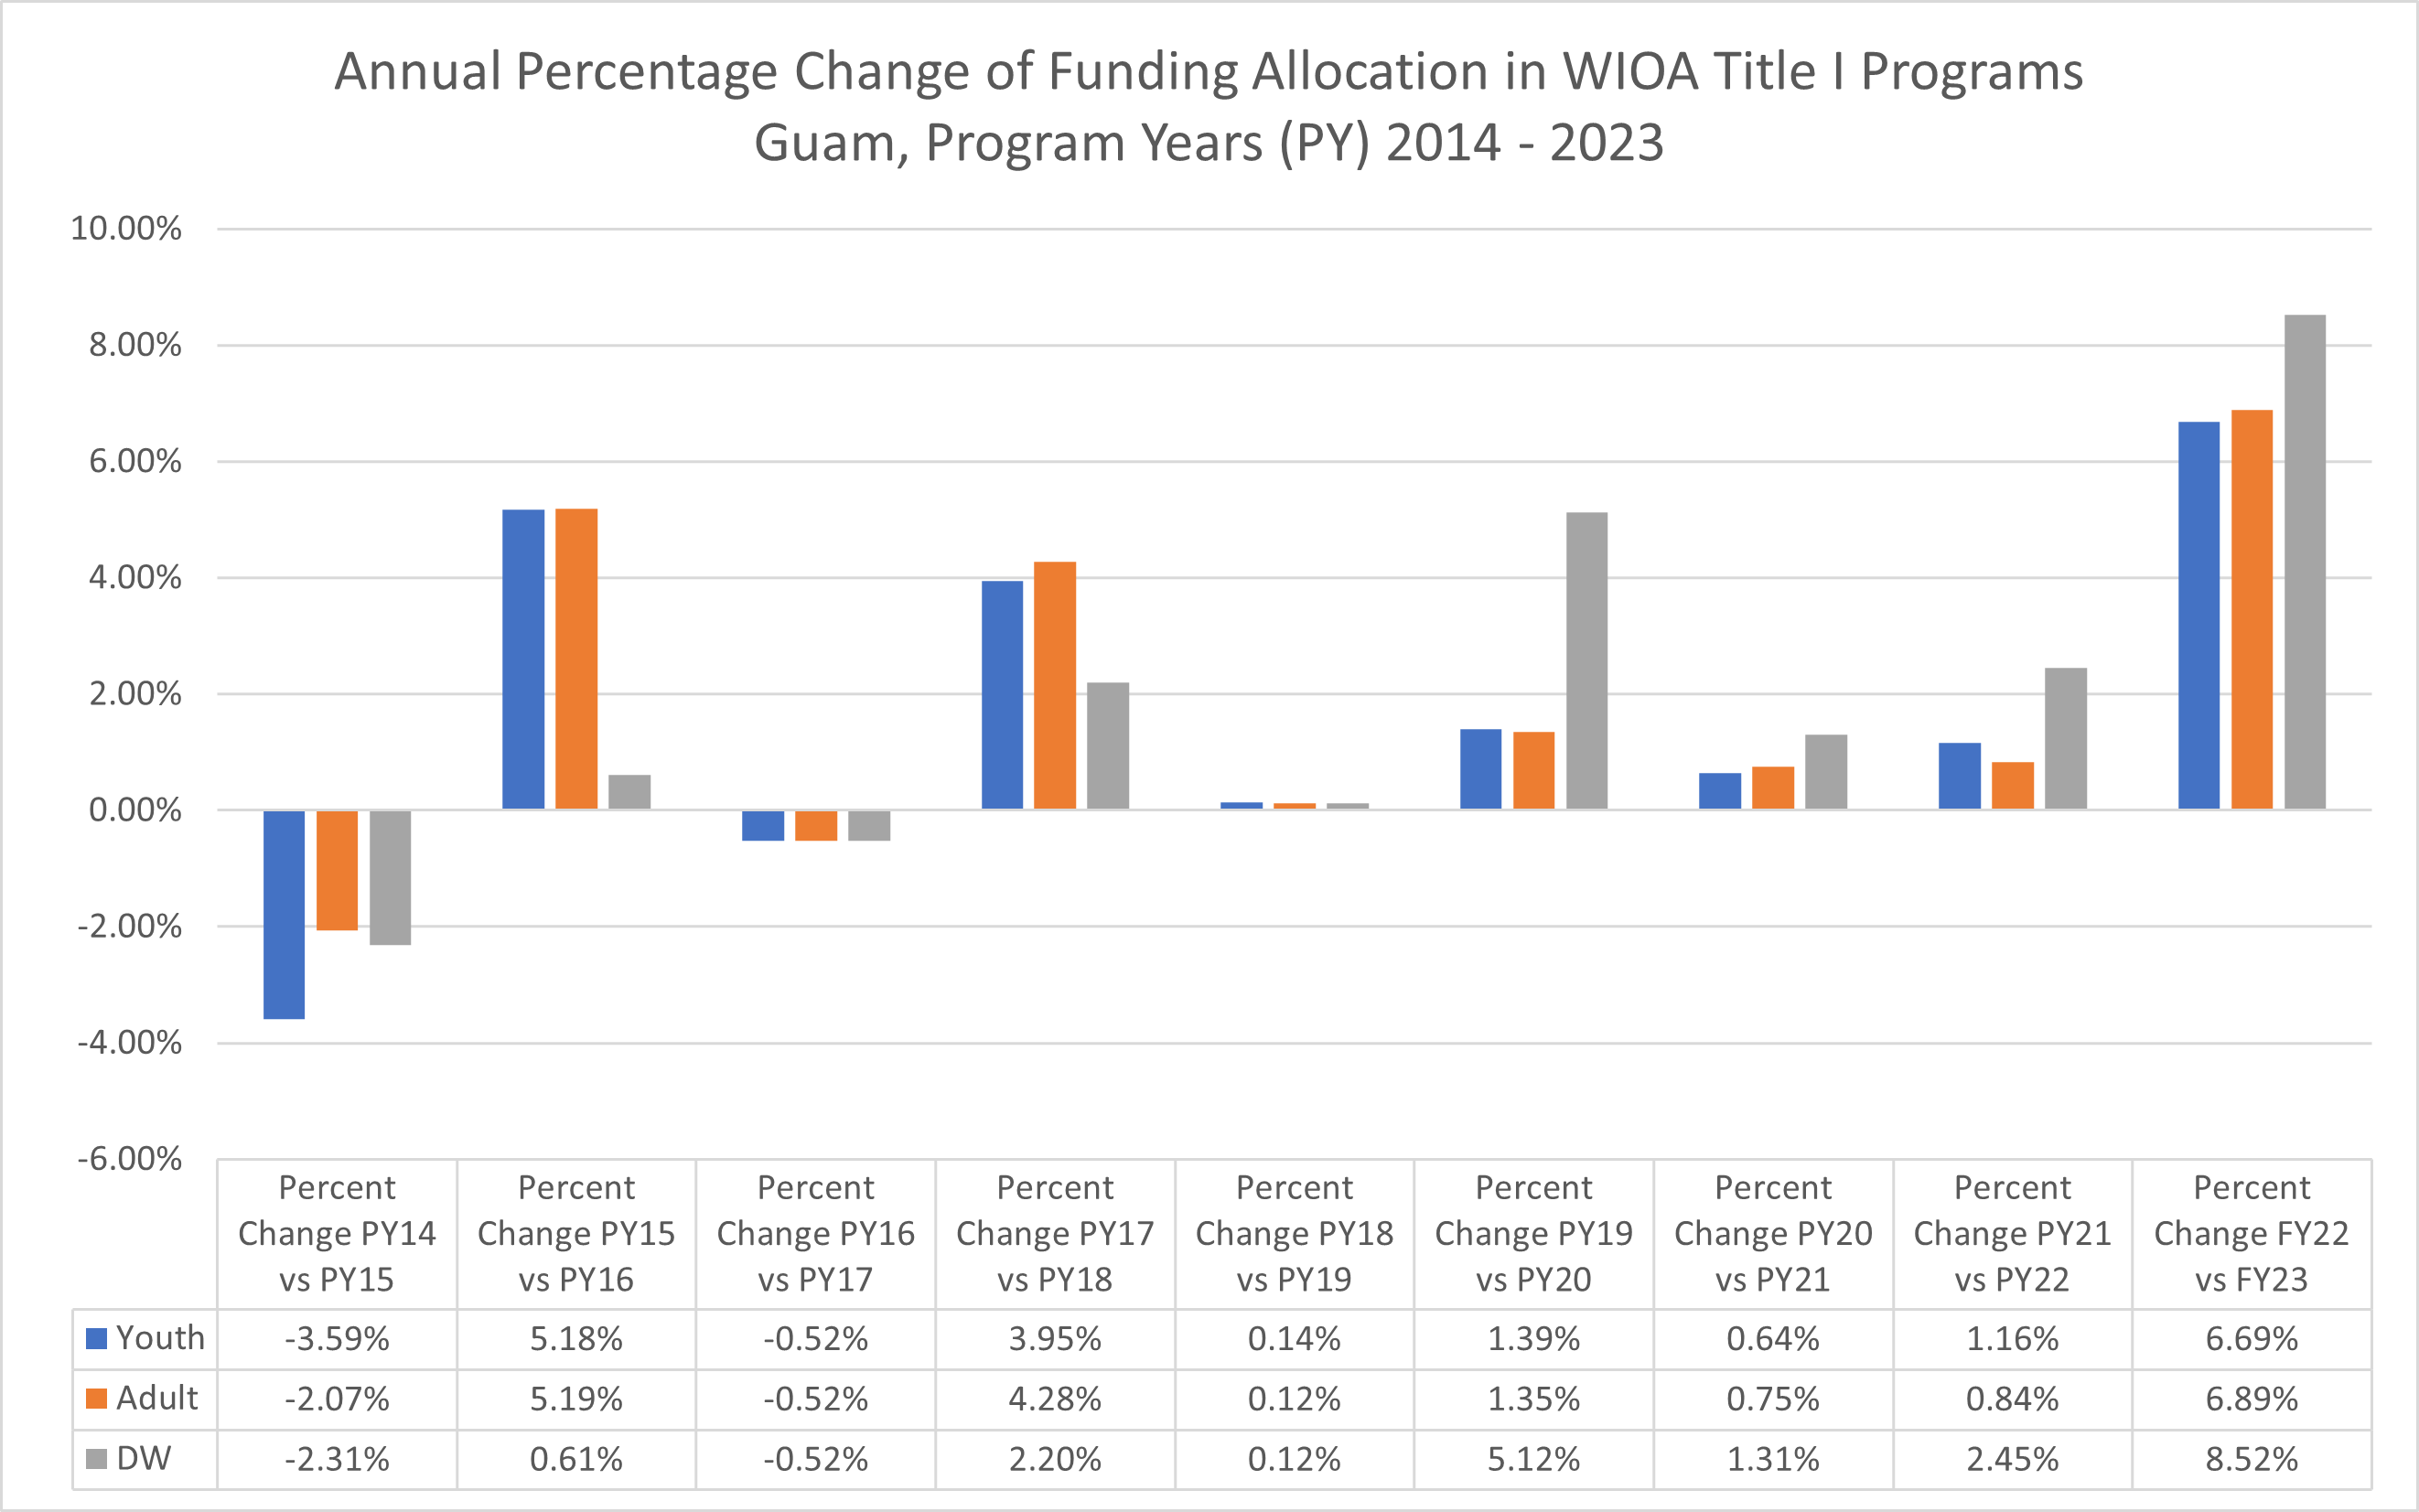
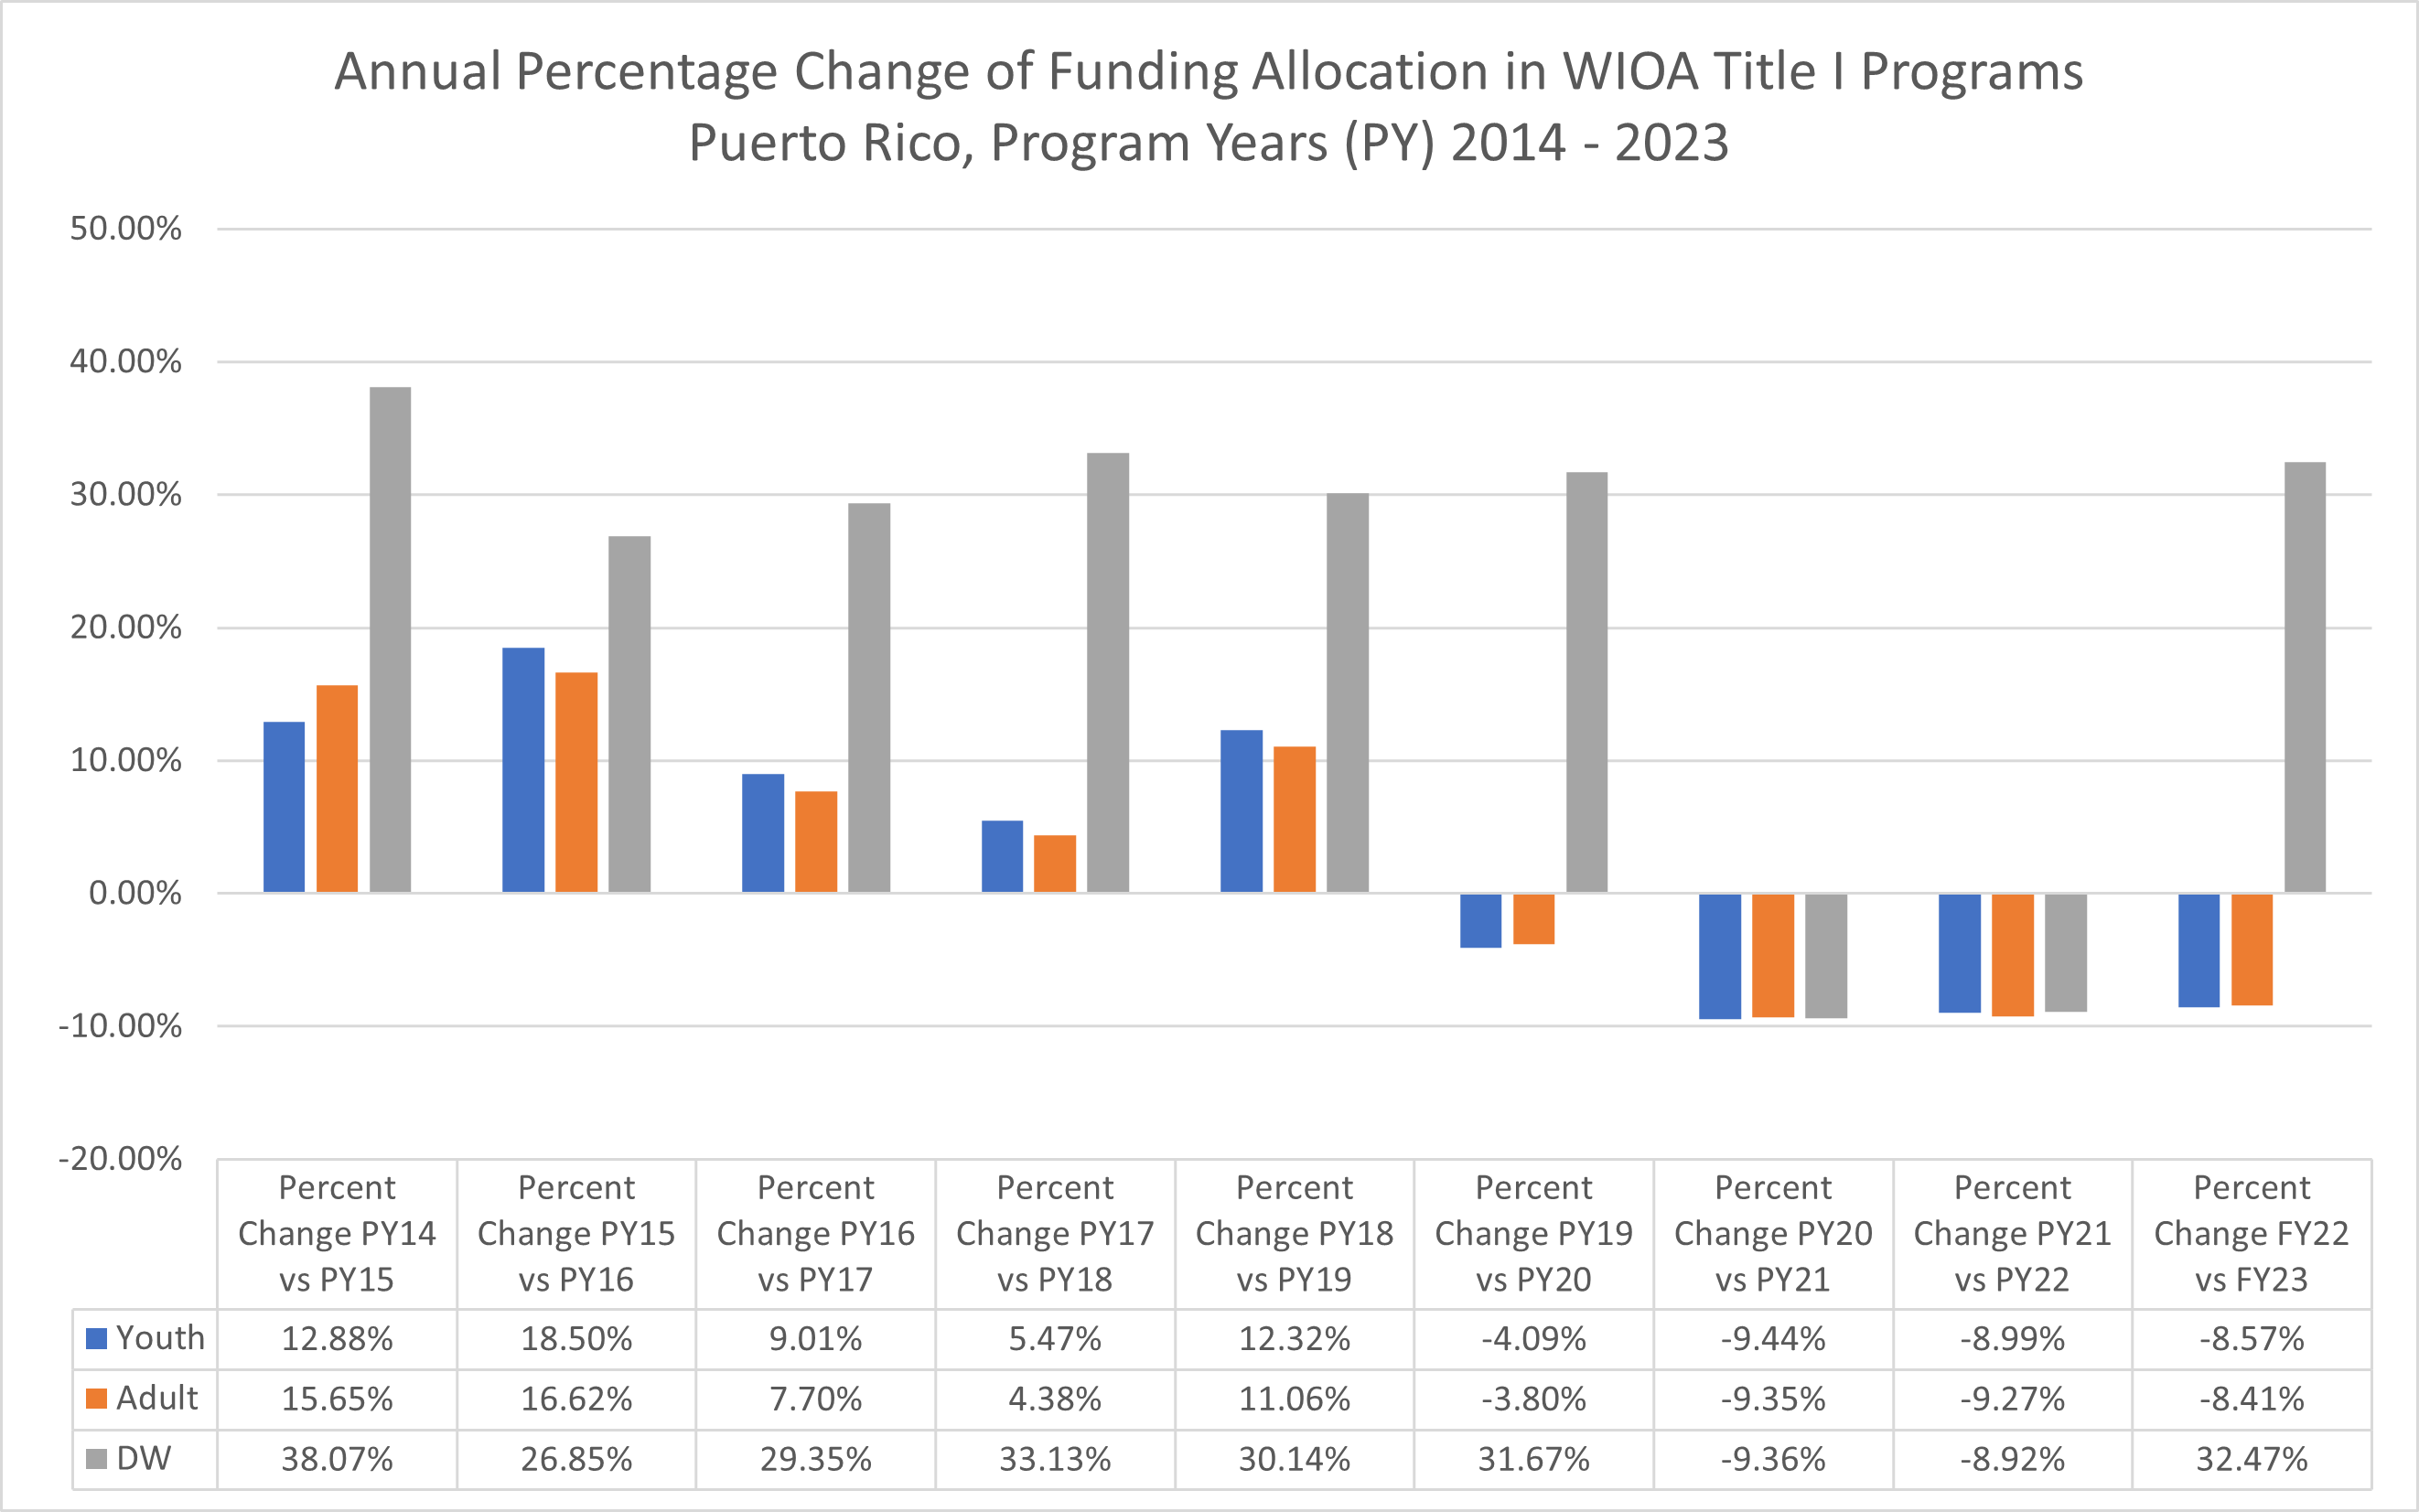
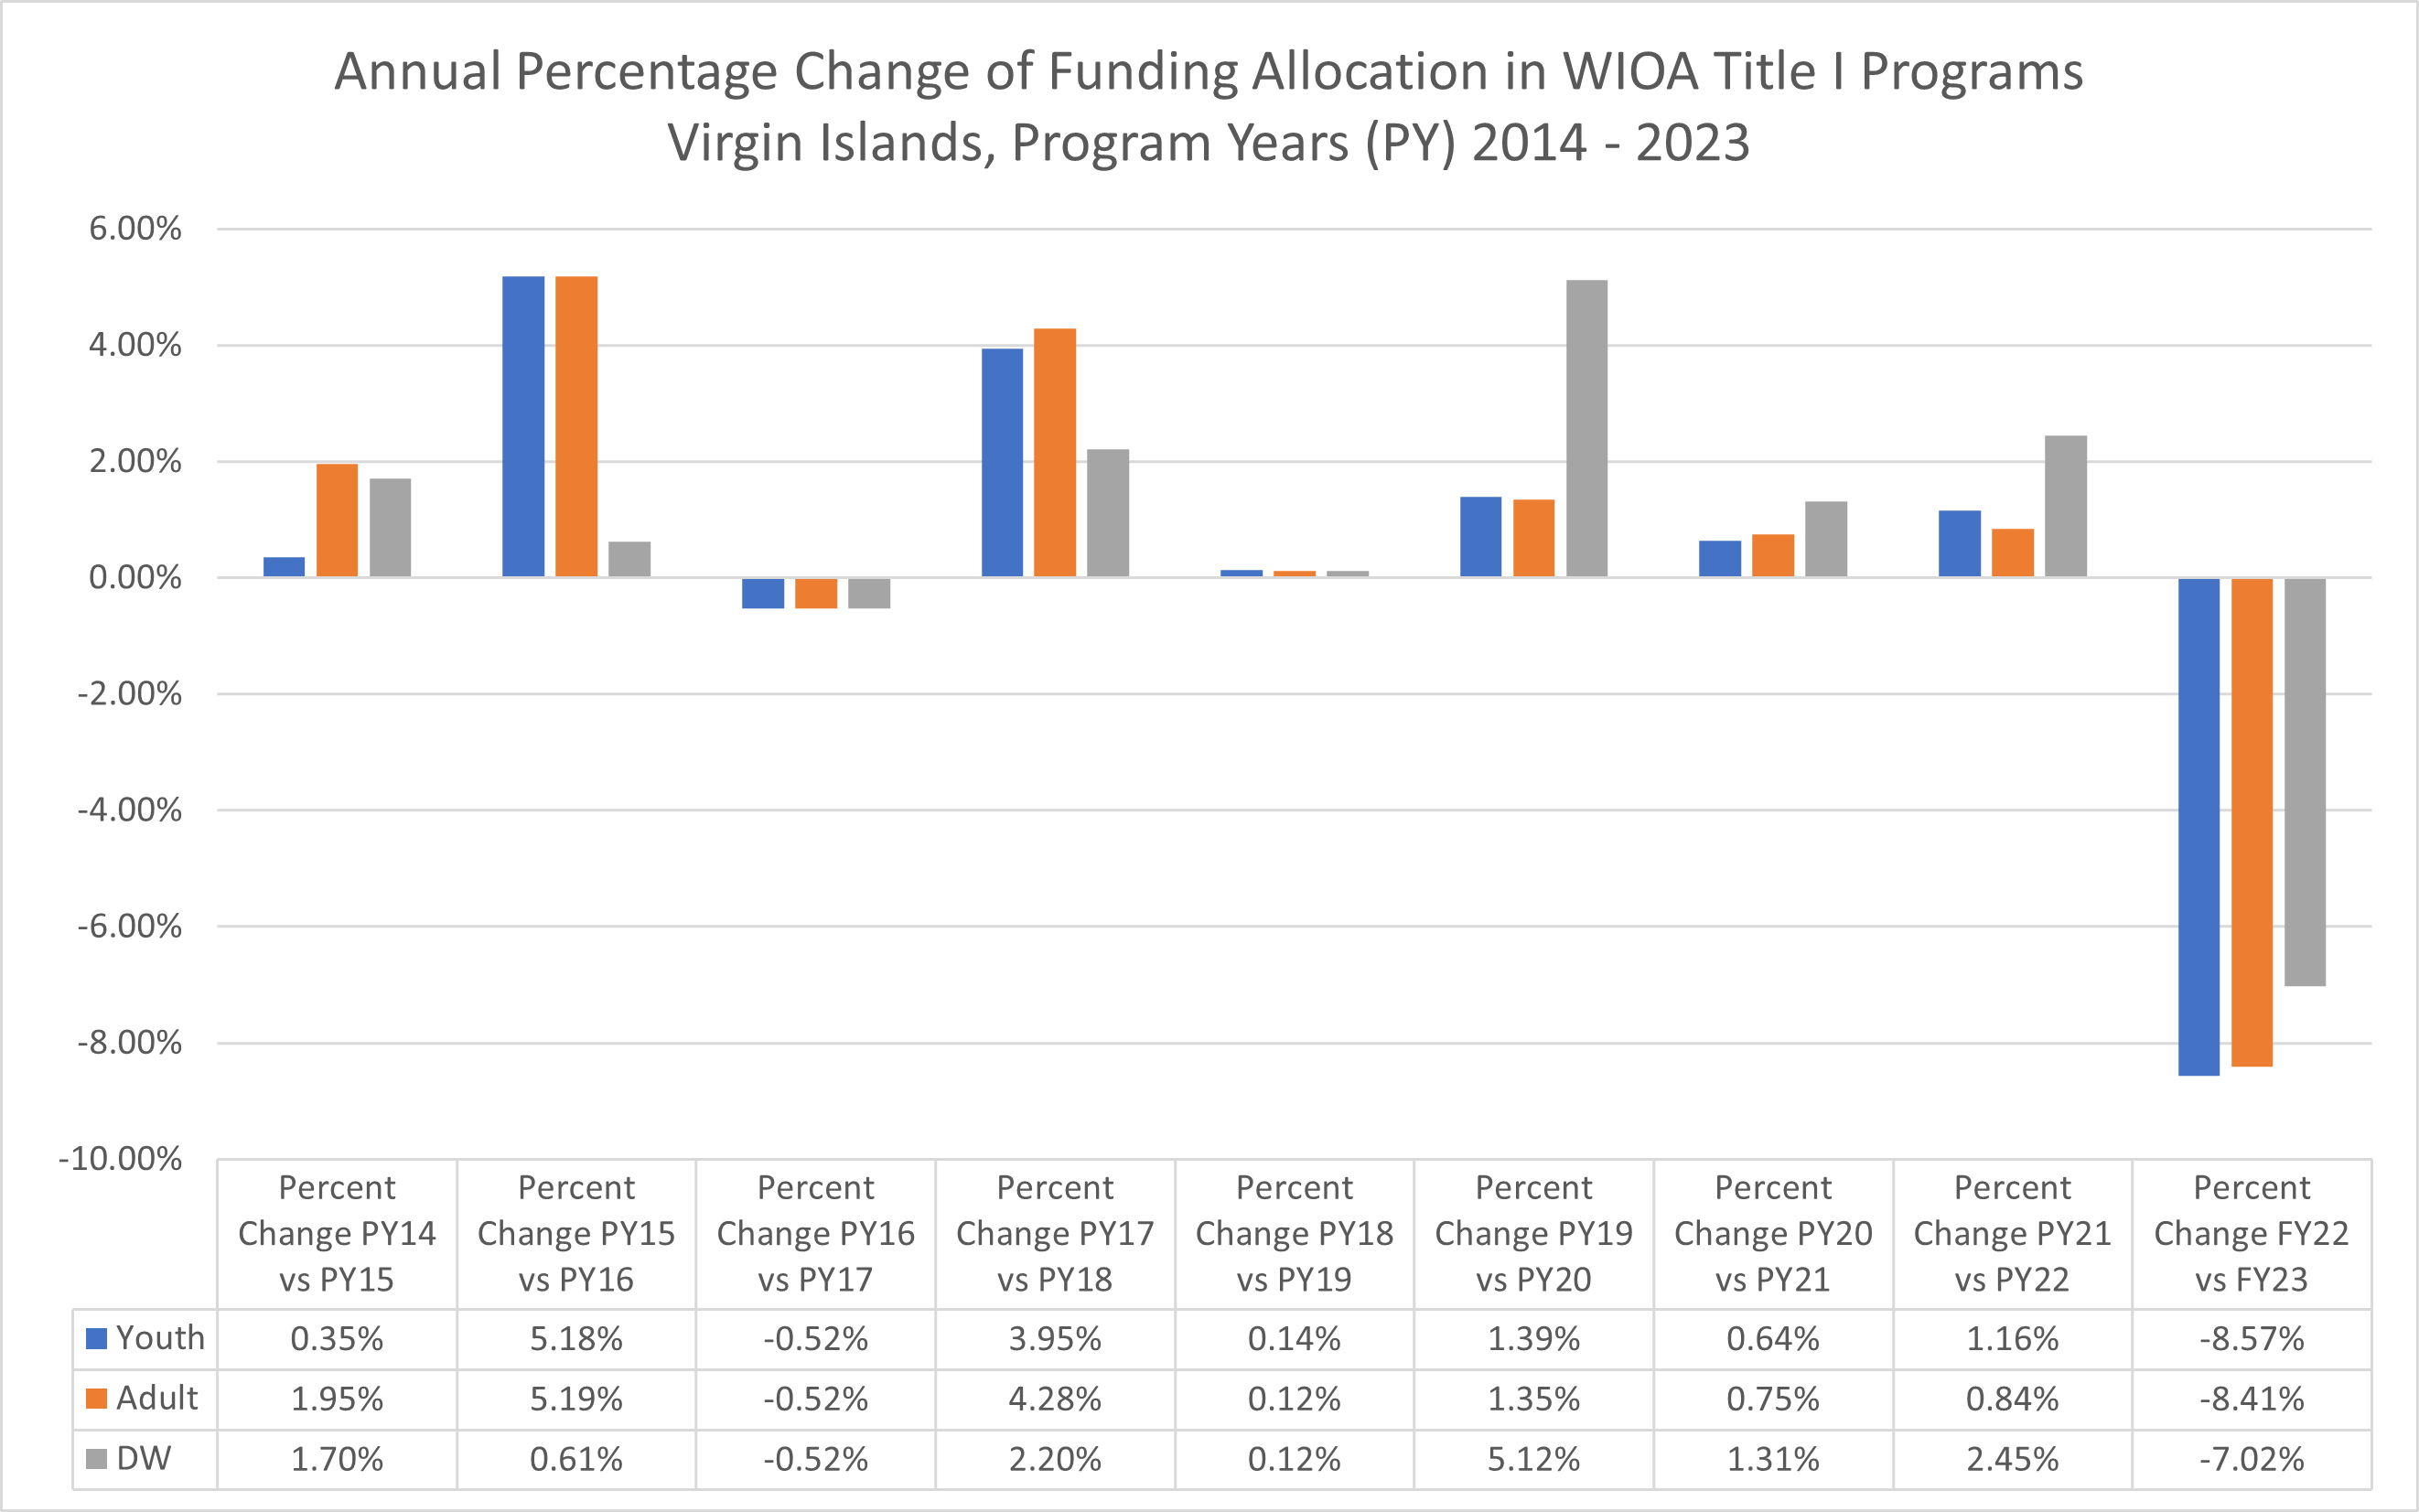
Since WIOA was last reauthorized in 2014, a few trends have emerged. Some states have seen consistent cuts across their Youth, Adult, and Dislocated Worker allocations, averaging approximately 8%-9% each year. These states often have lower than average unemployment rates YOY and are subject to the minimum funding threshold. Some states have seen large spikes in their allocations, sometimes more than 30%. These are states that have the highest unemployment rates and are capped by the maximum funding threshold. Meanwhile, many states experience both large increases one year only to be cut the following year(s). This is primarily due to YOY swings in rates of unemployment relative to other states, resulting in hitting a funding ceiling one year, followed by hitting the funding floor the following year.
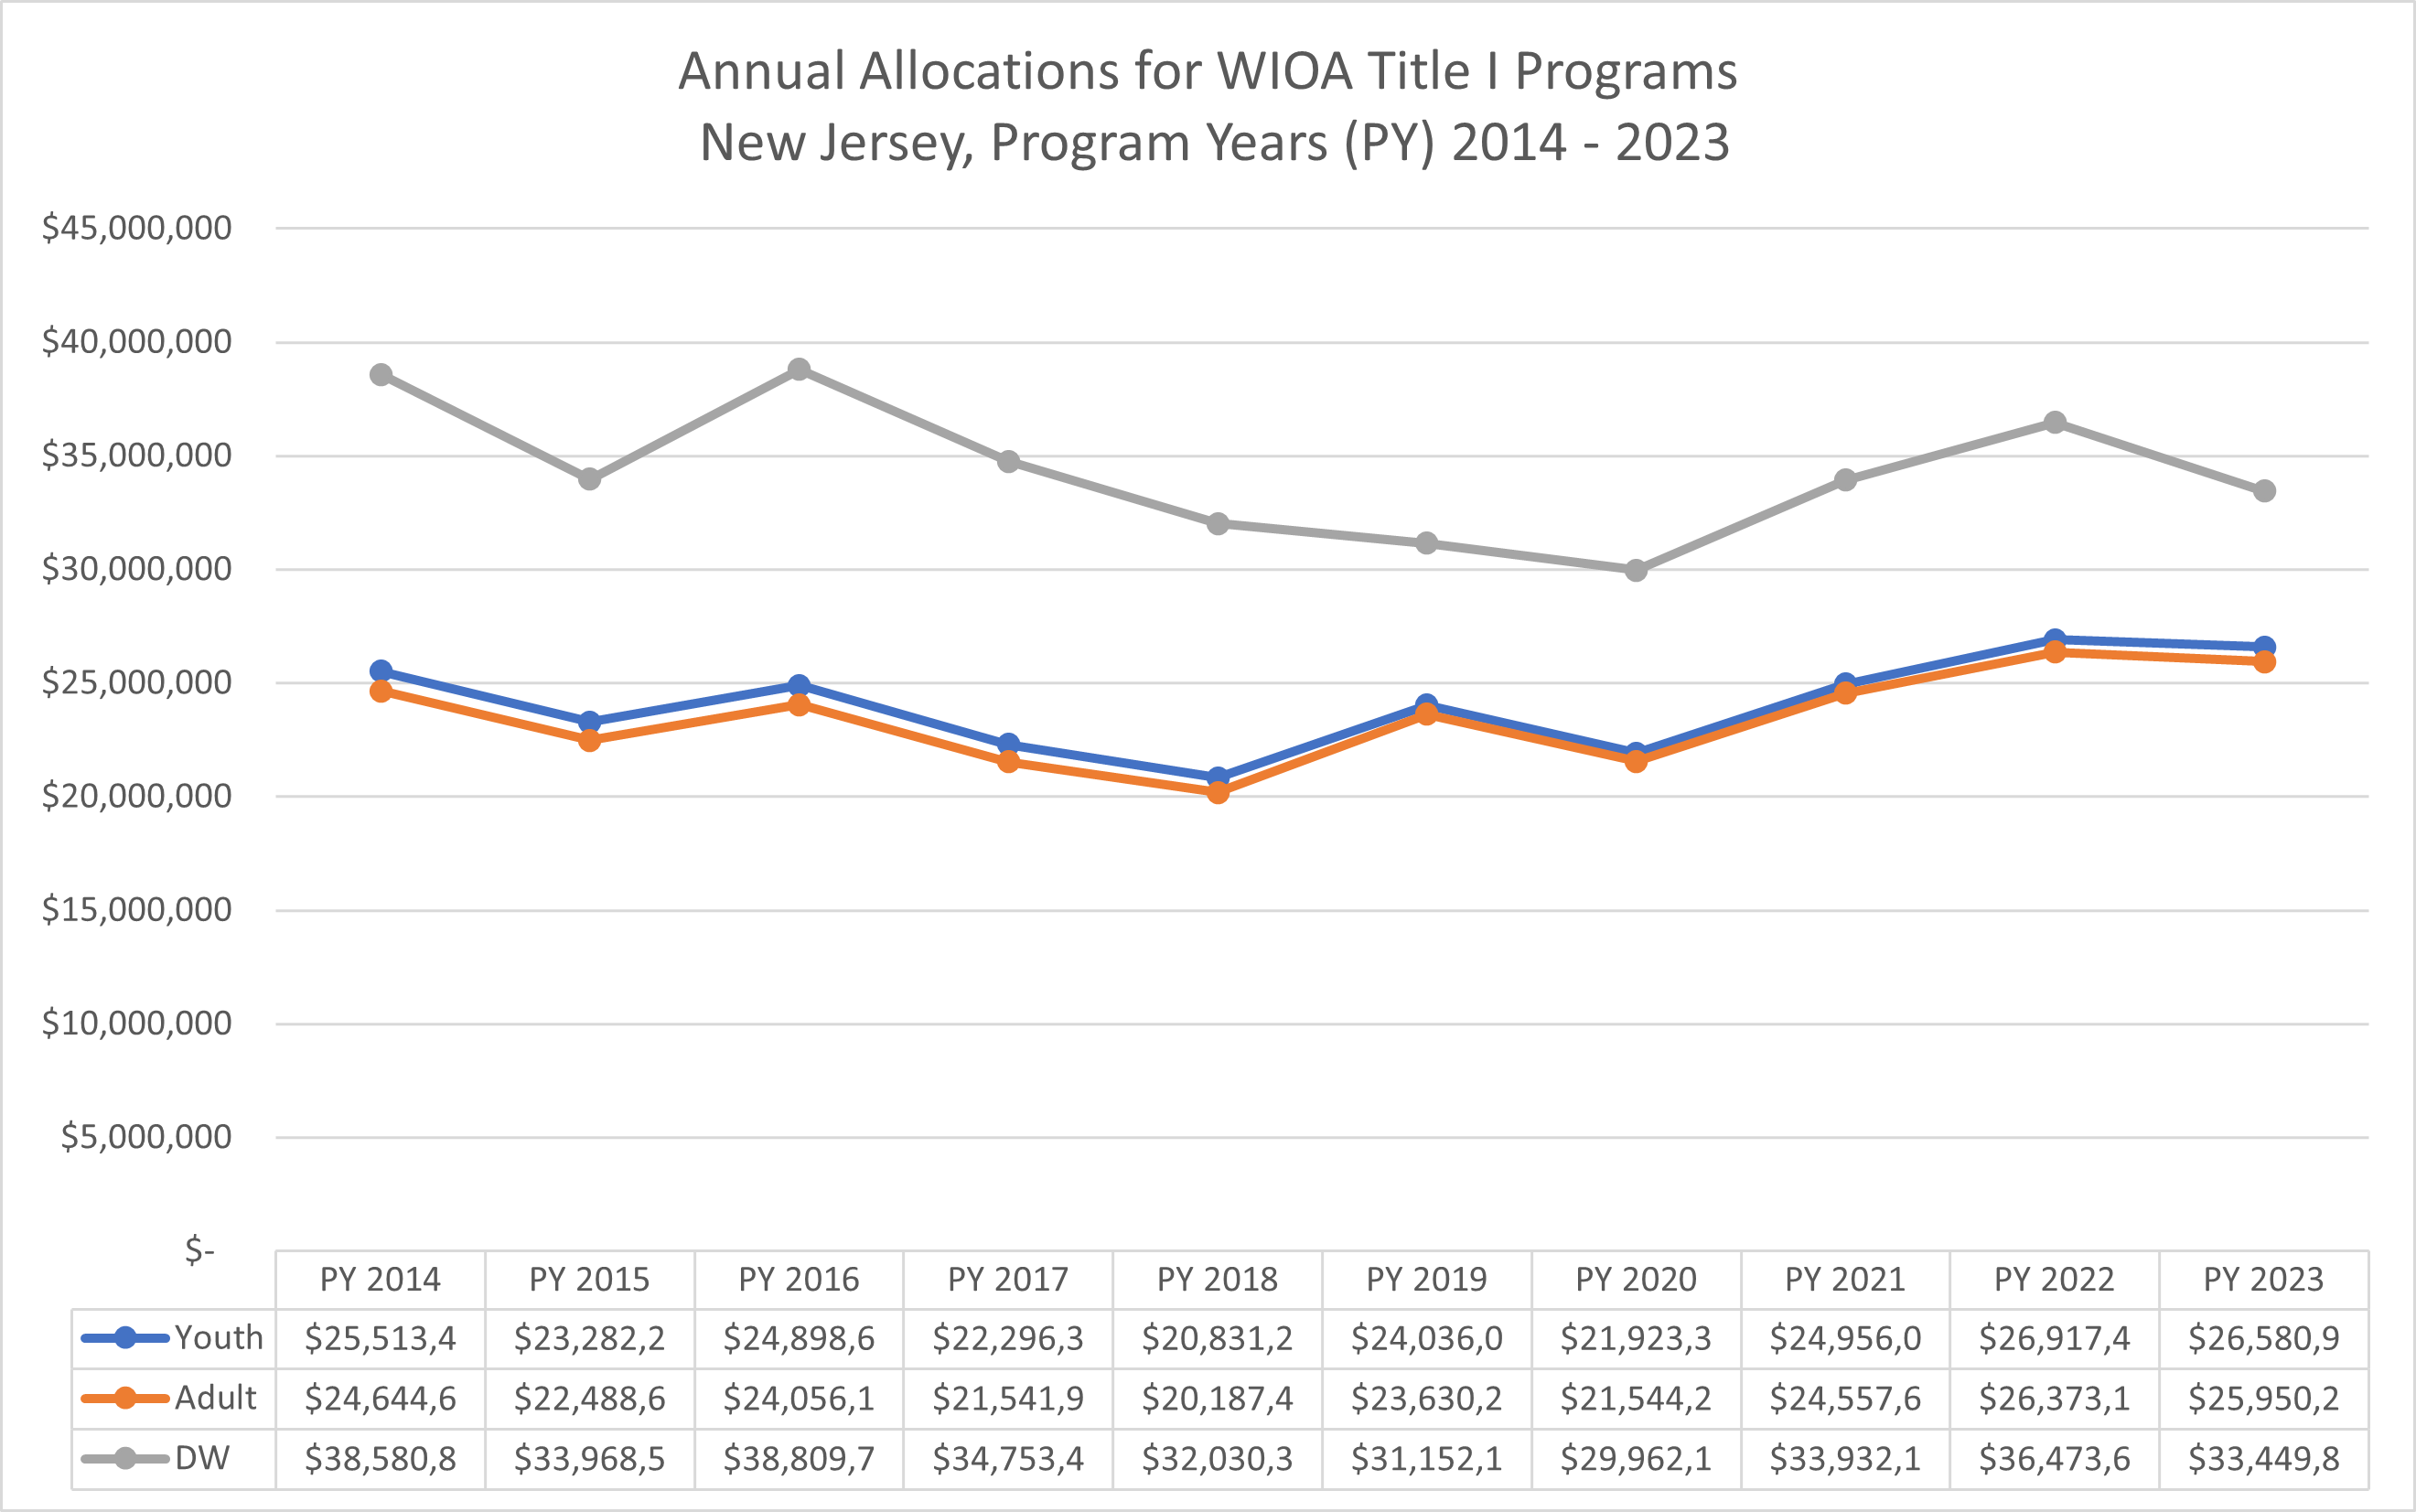
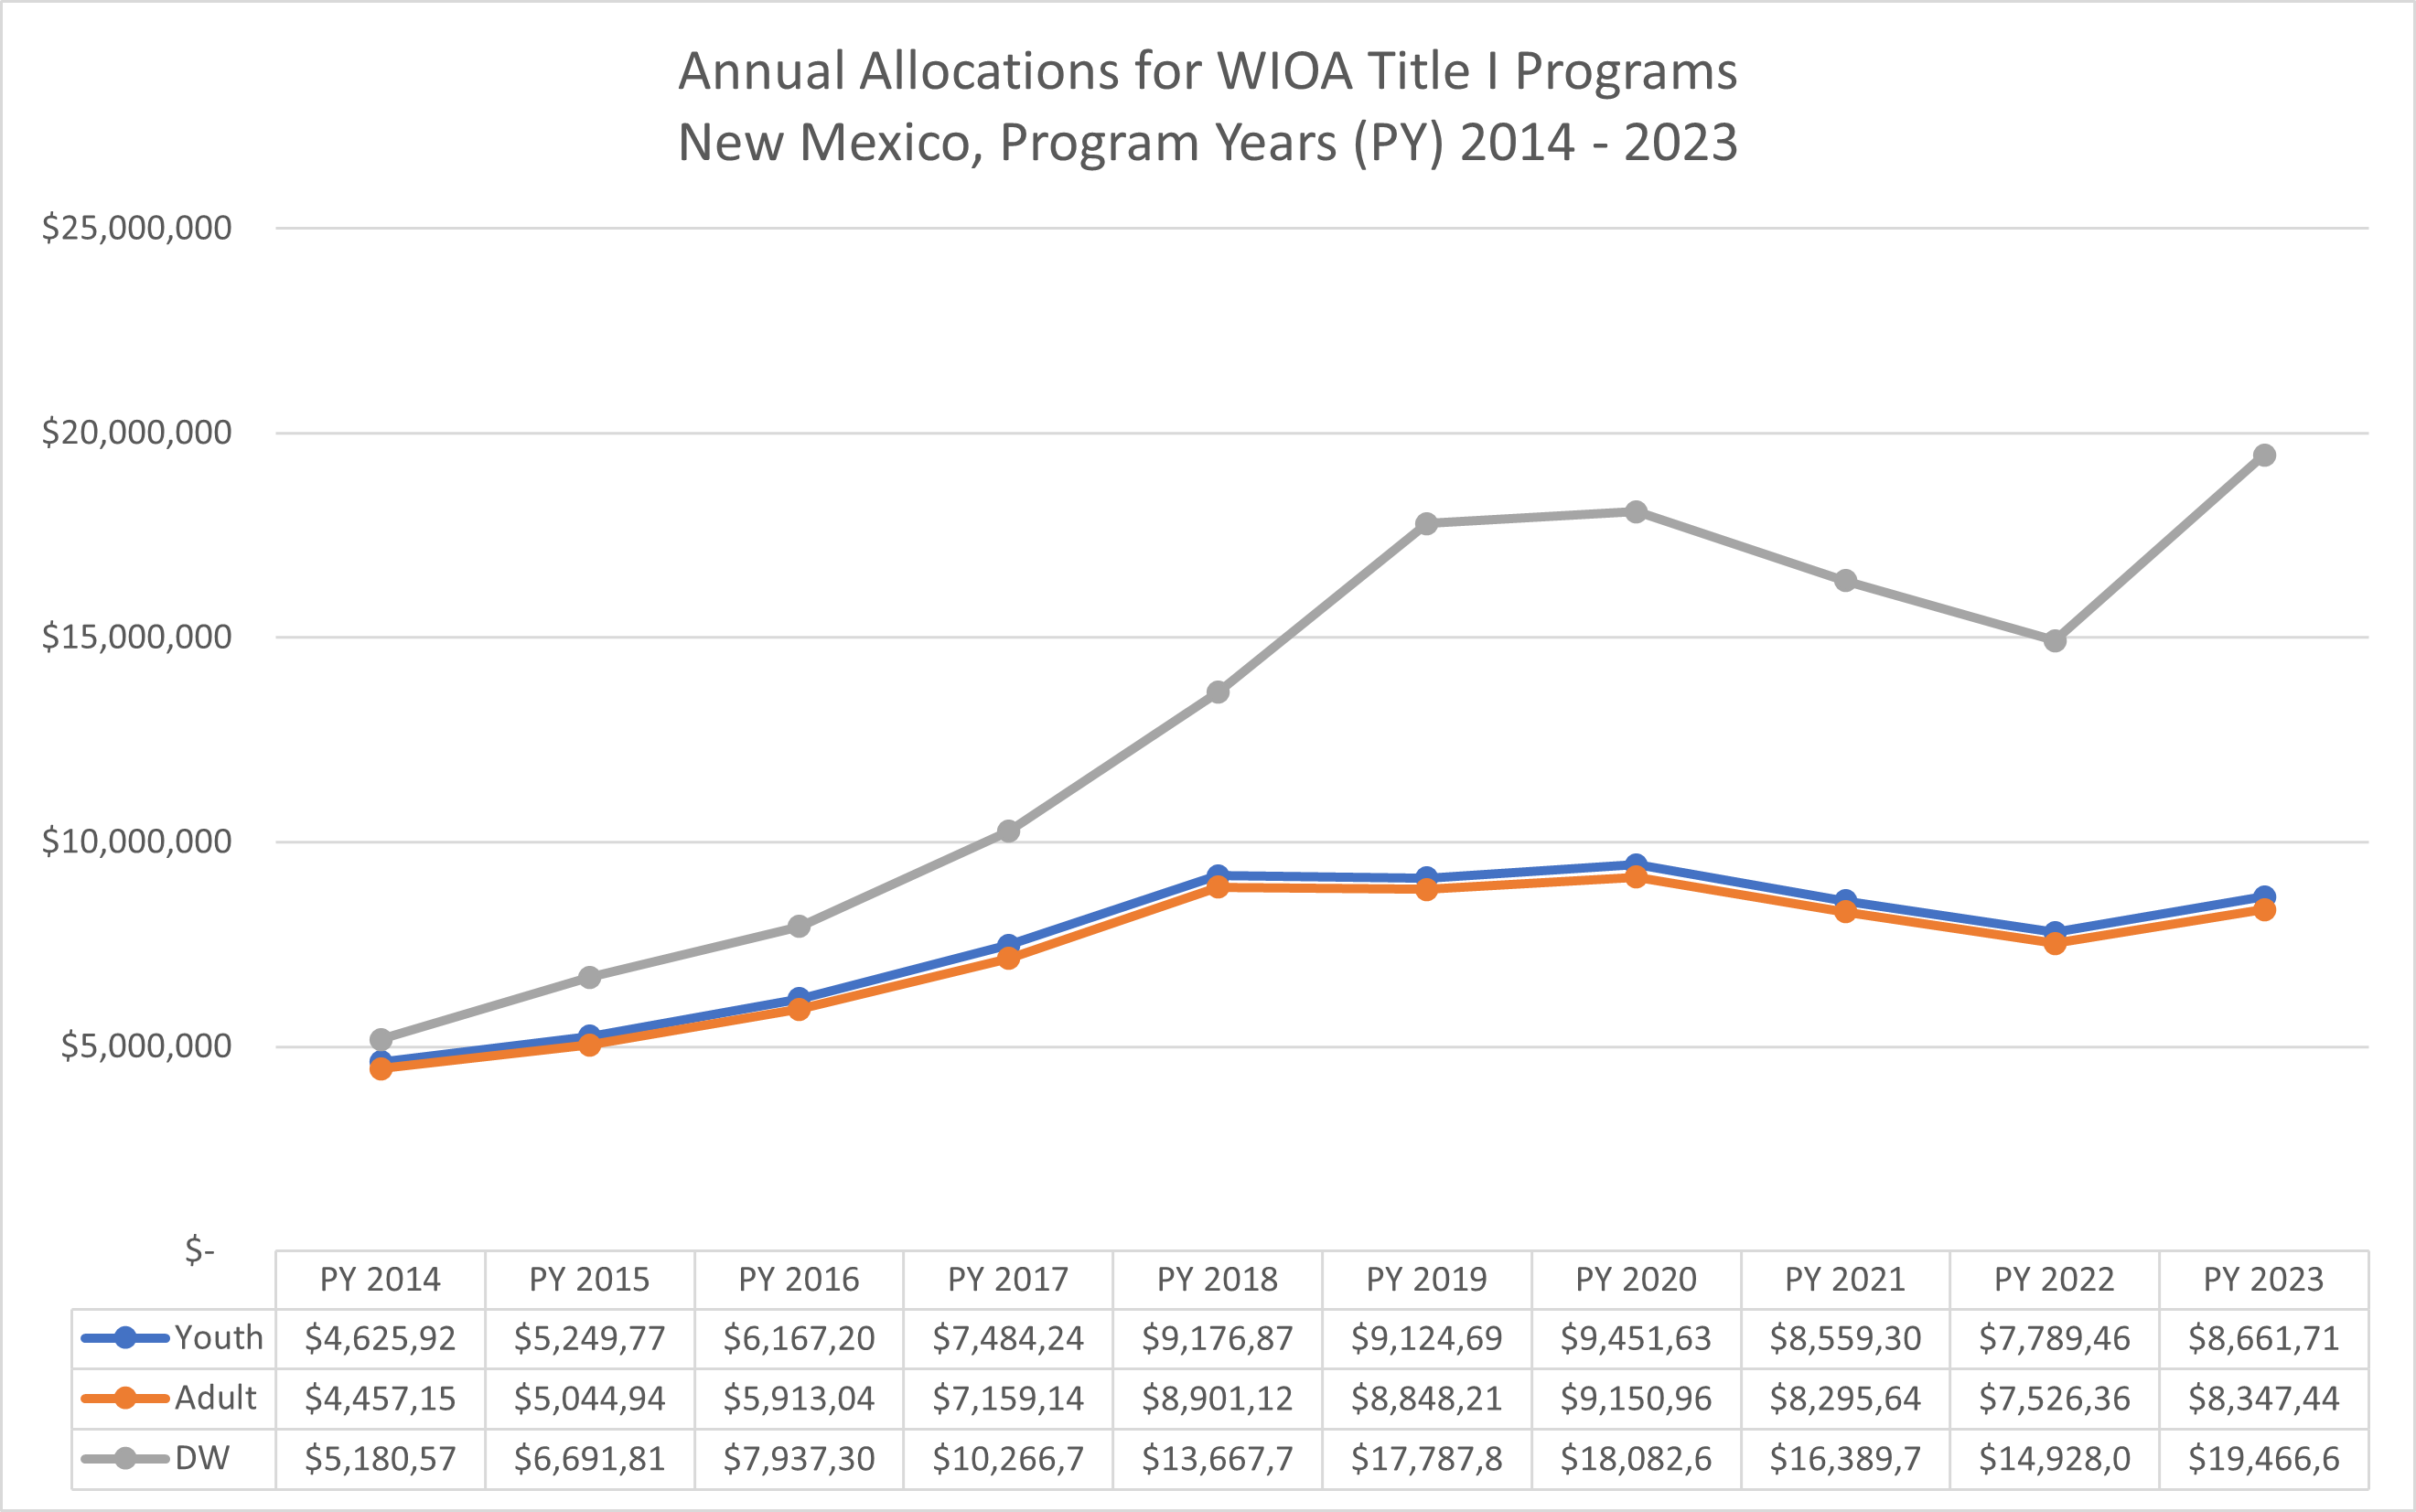
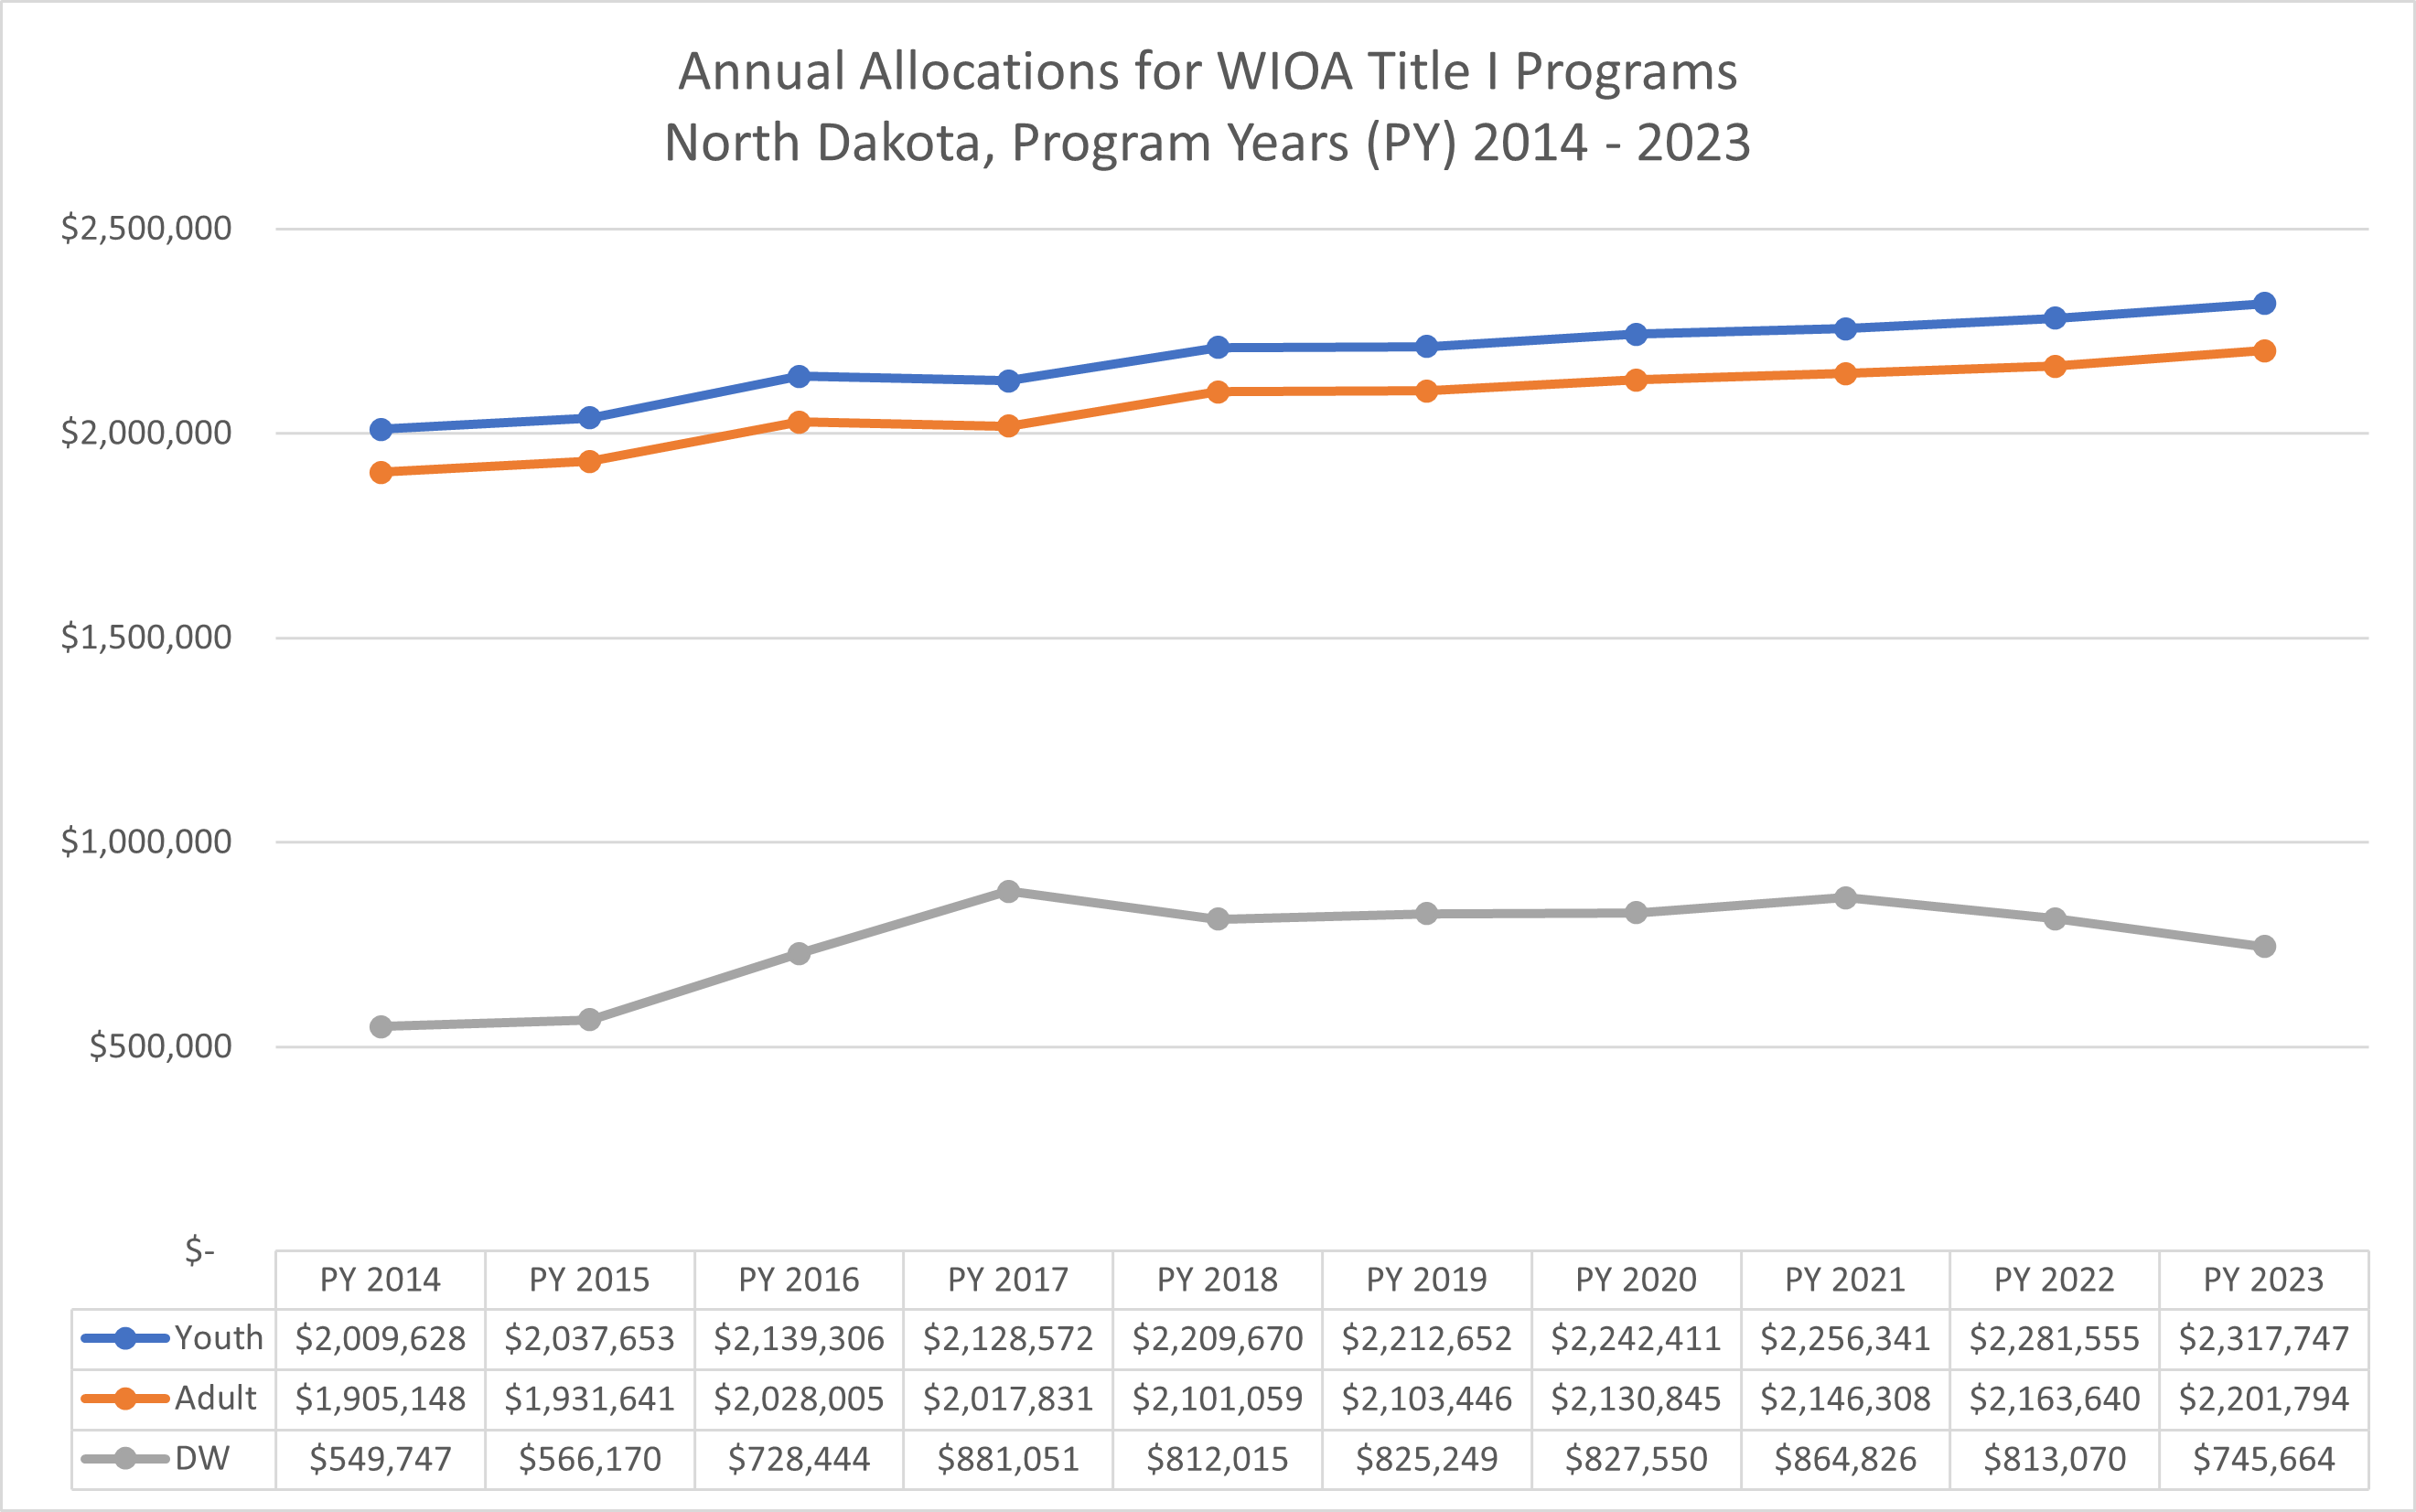
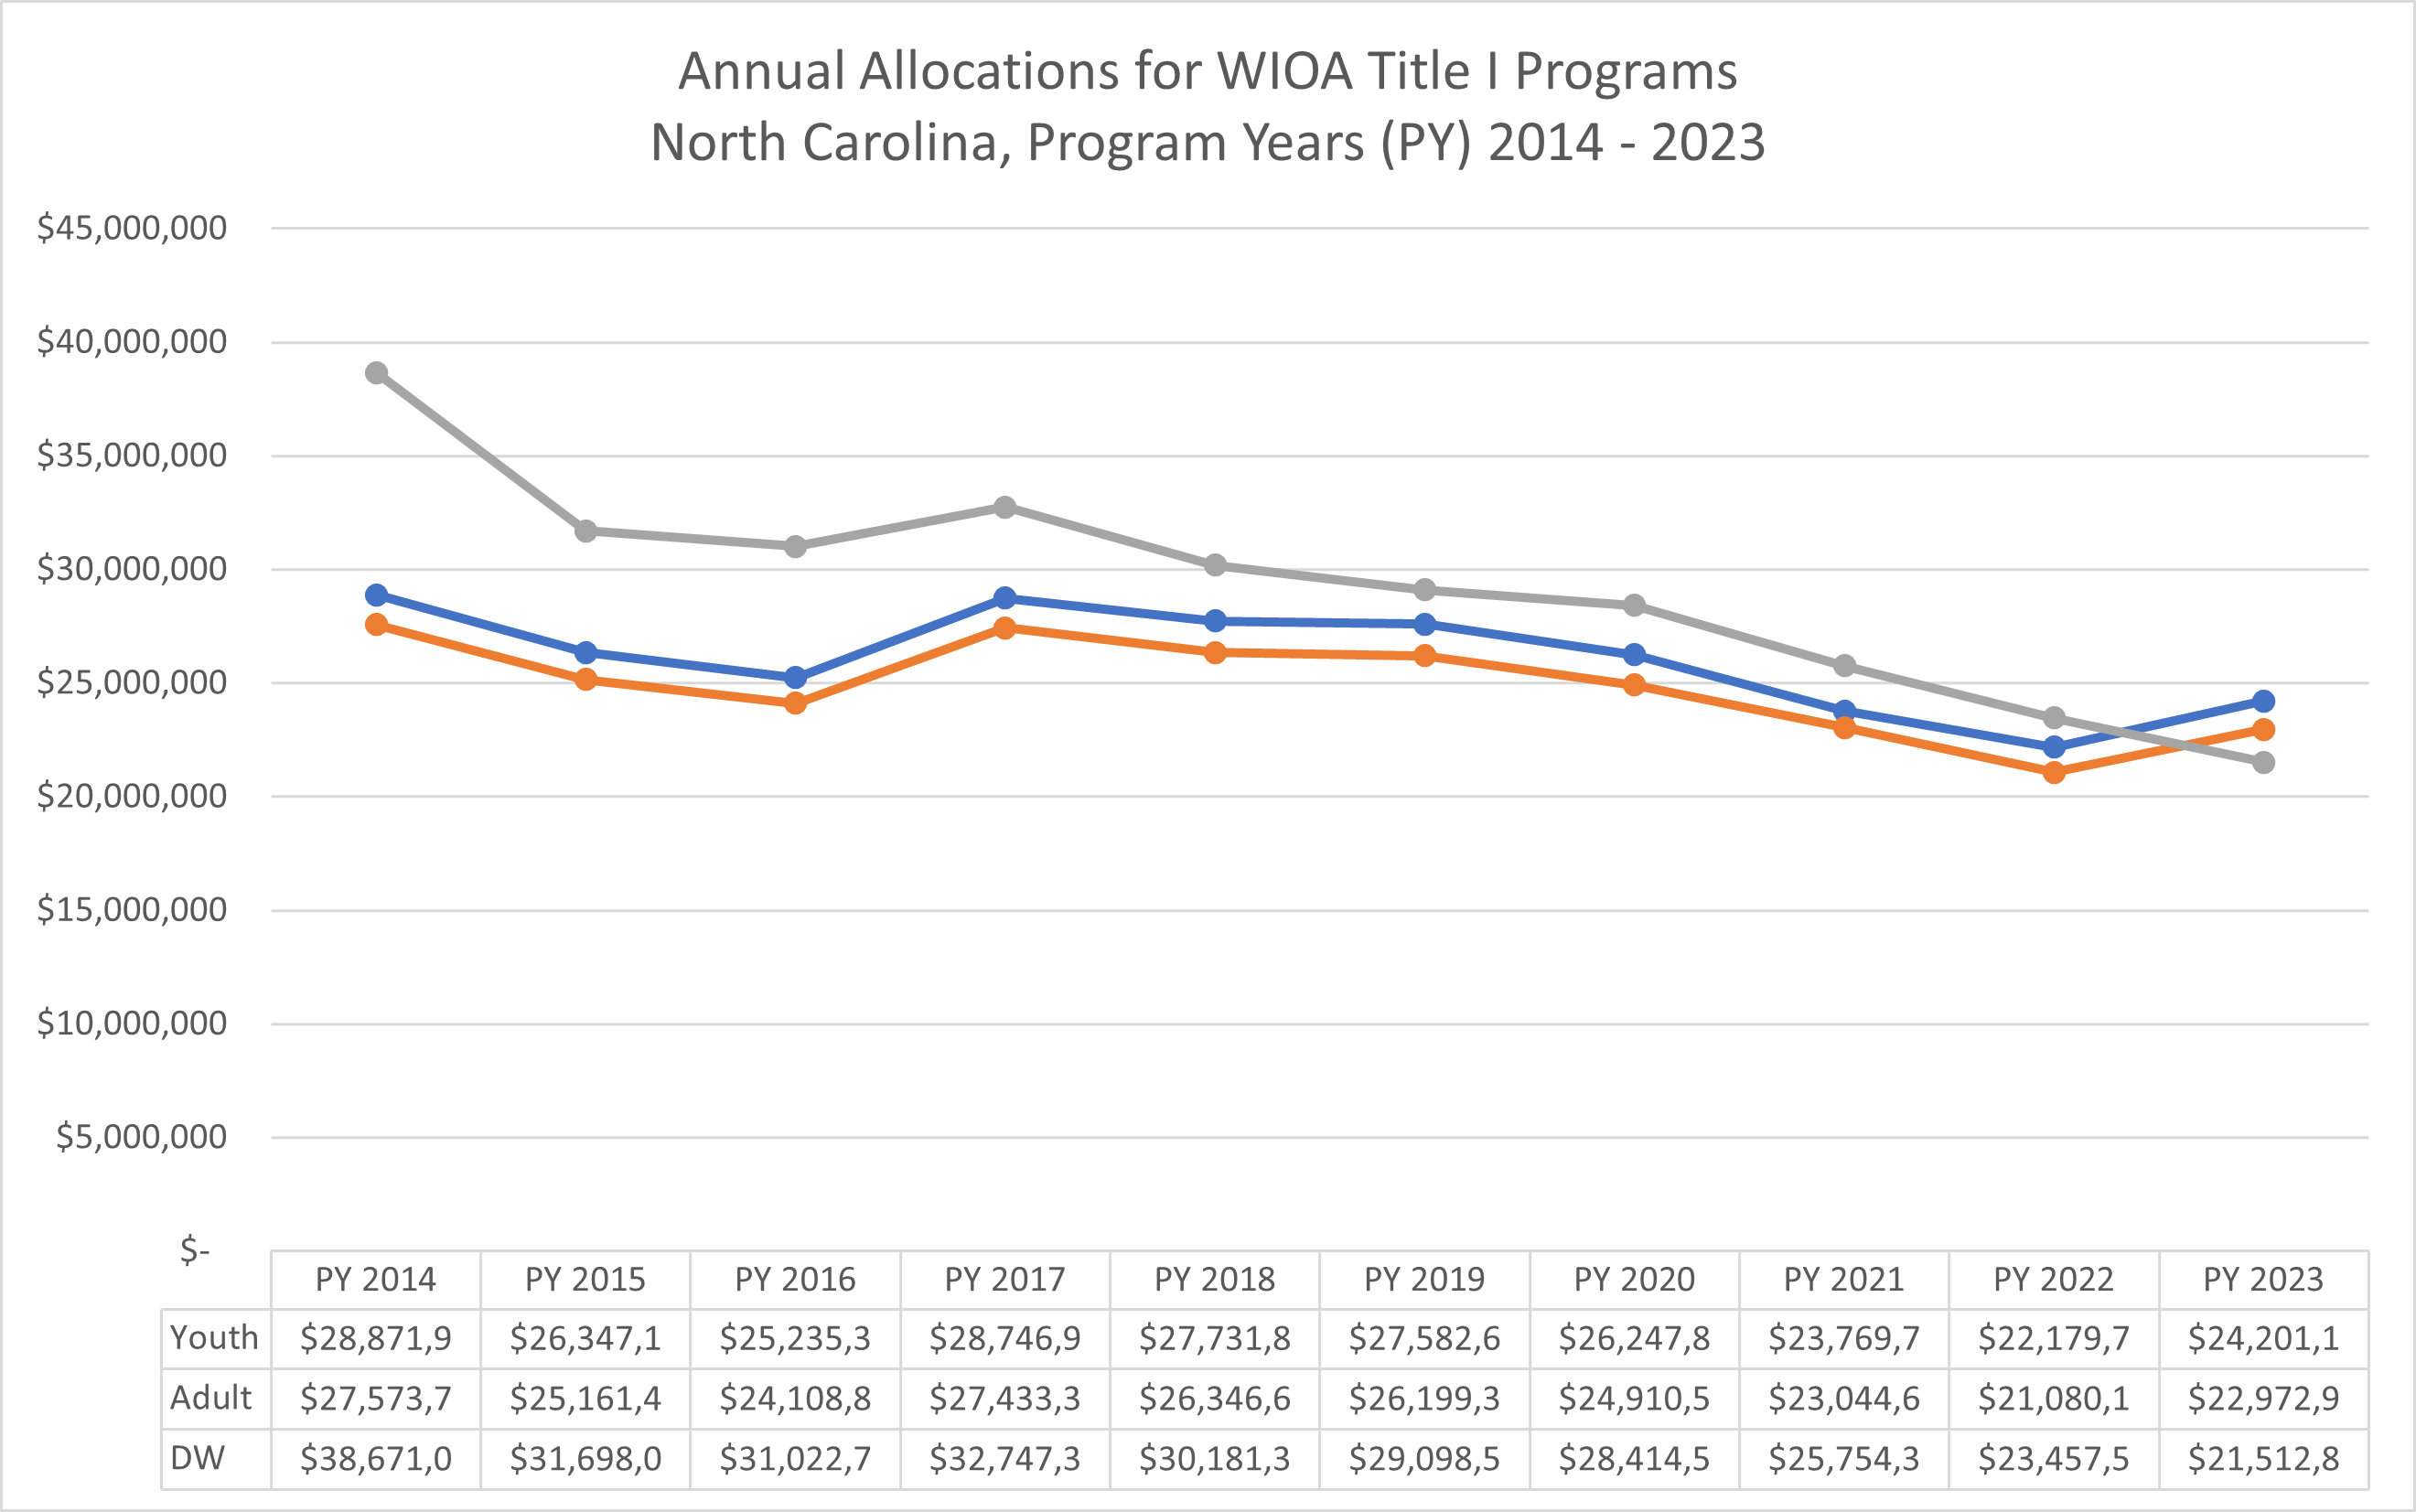
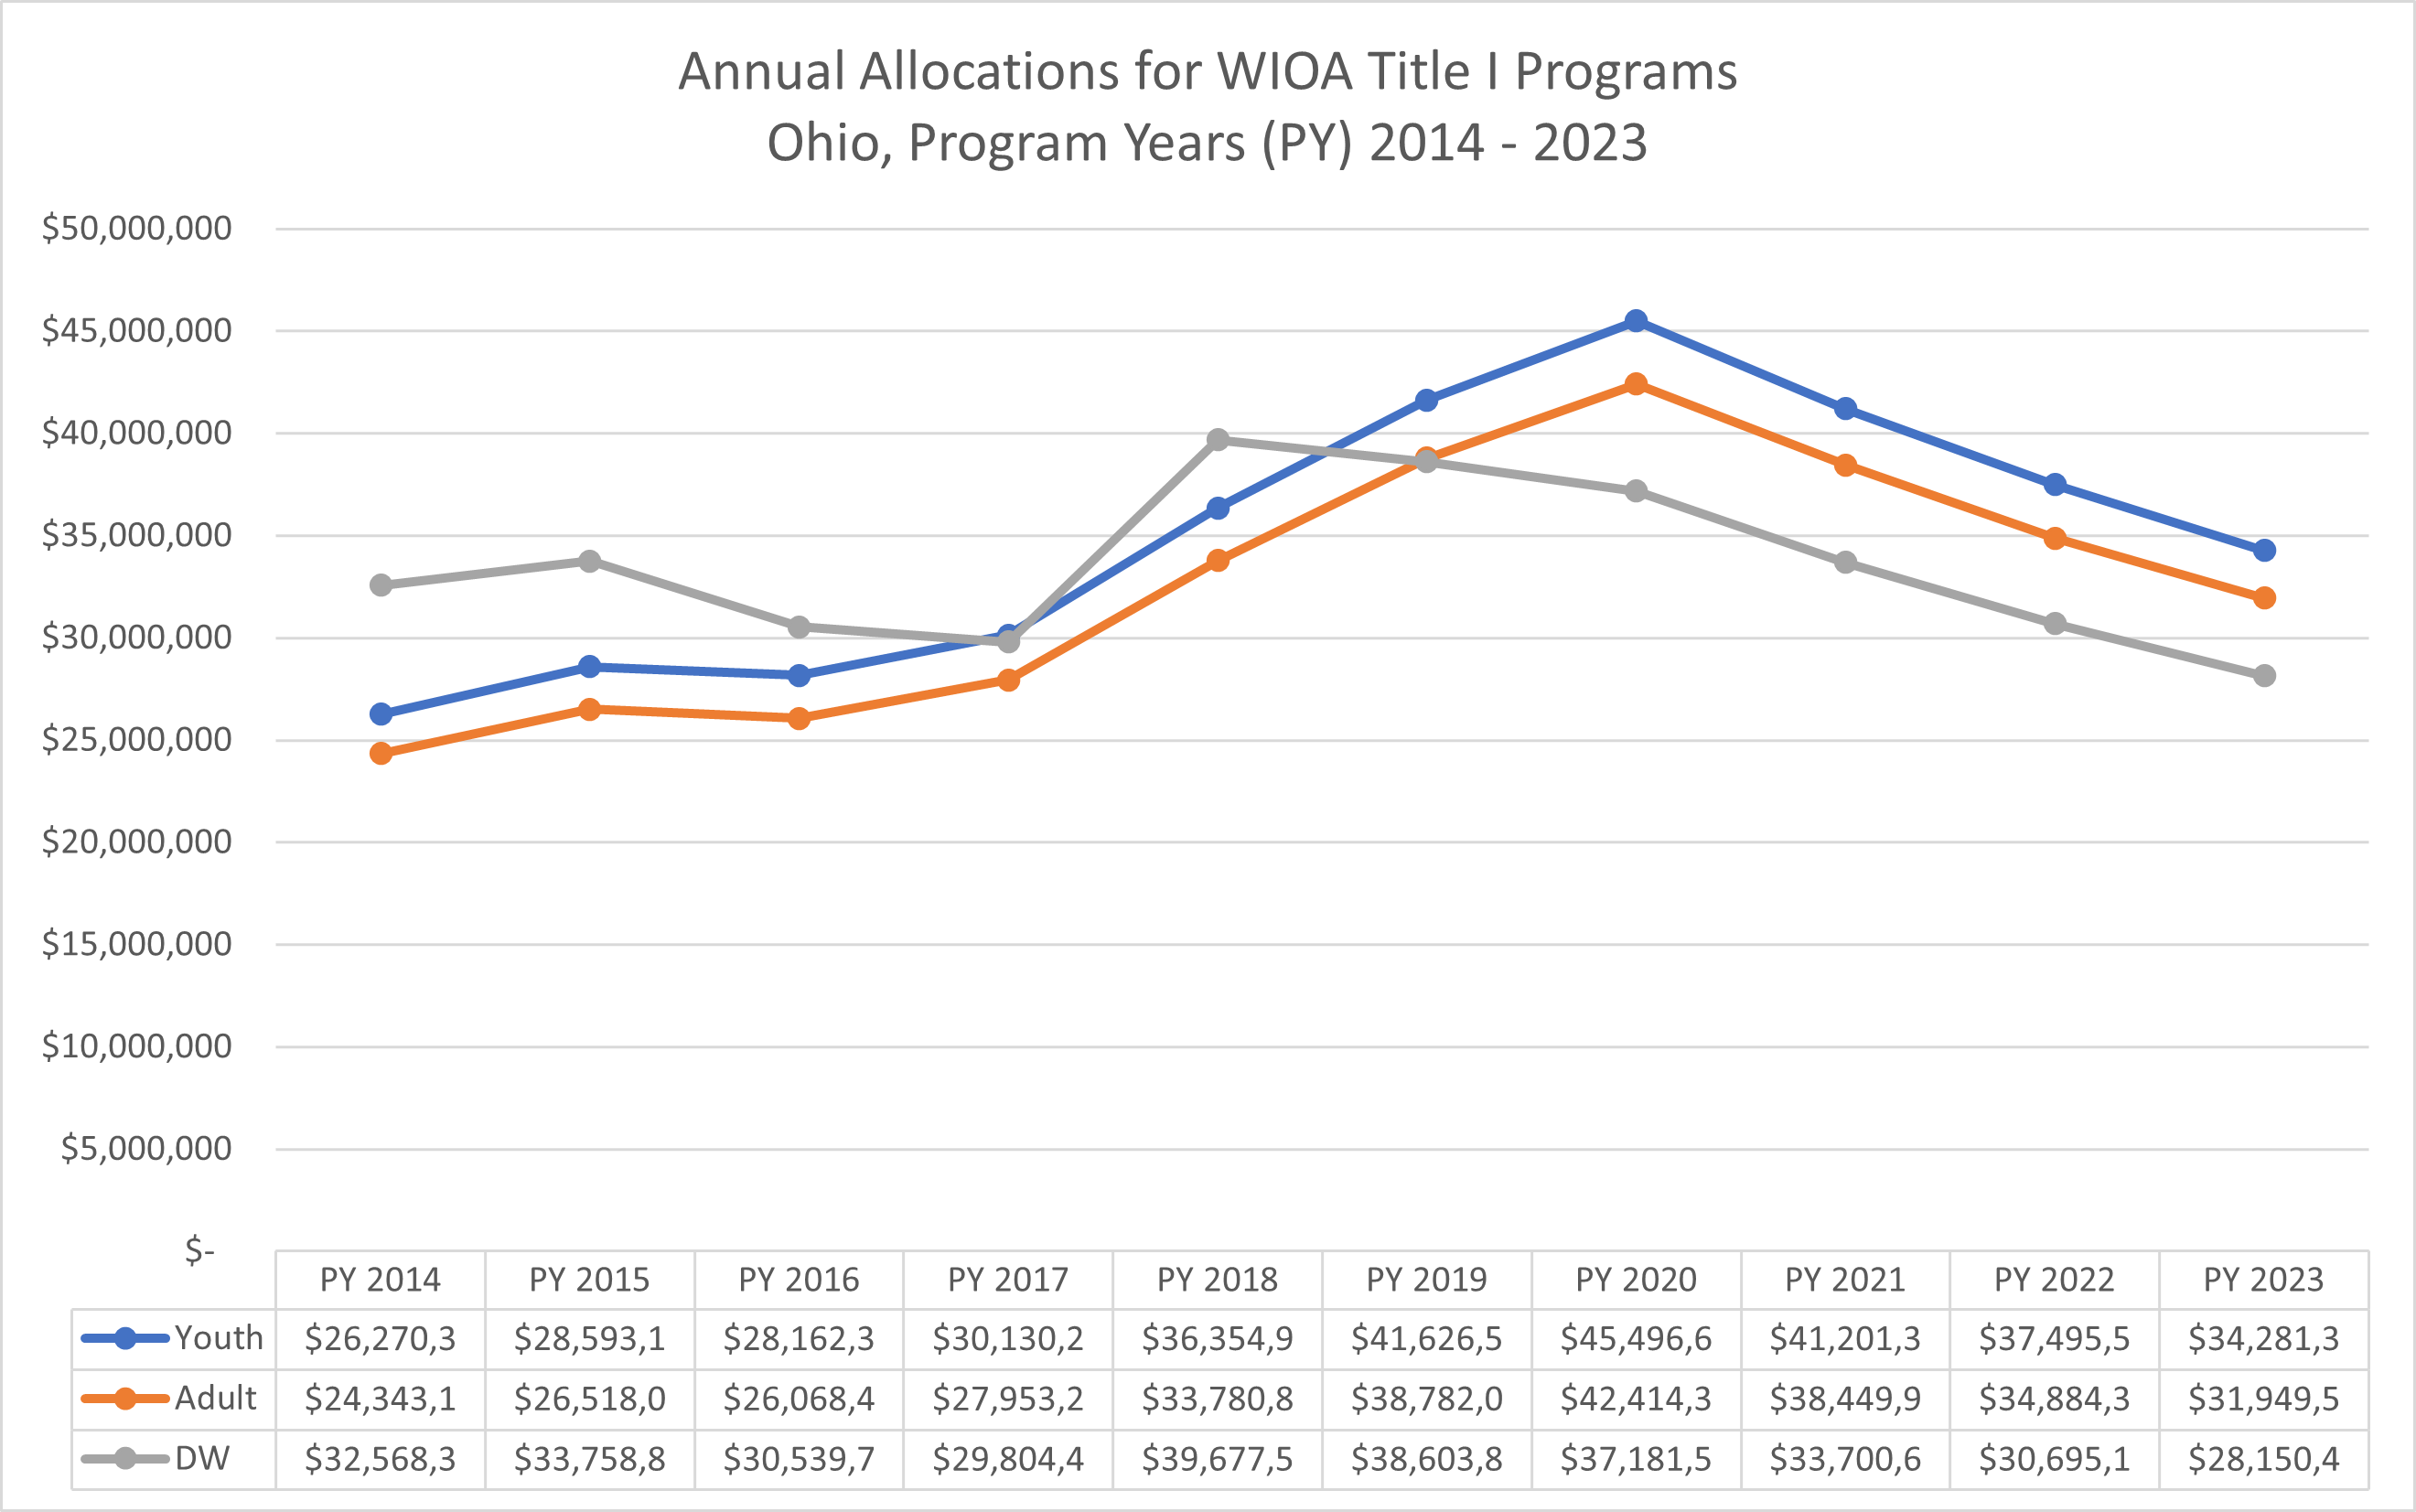
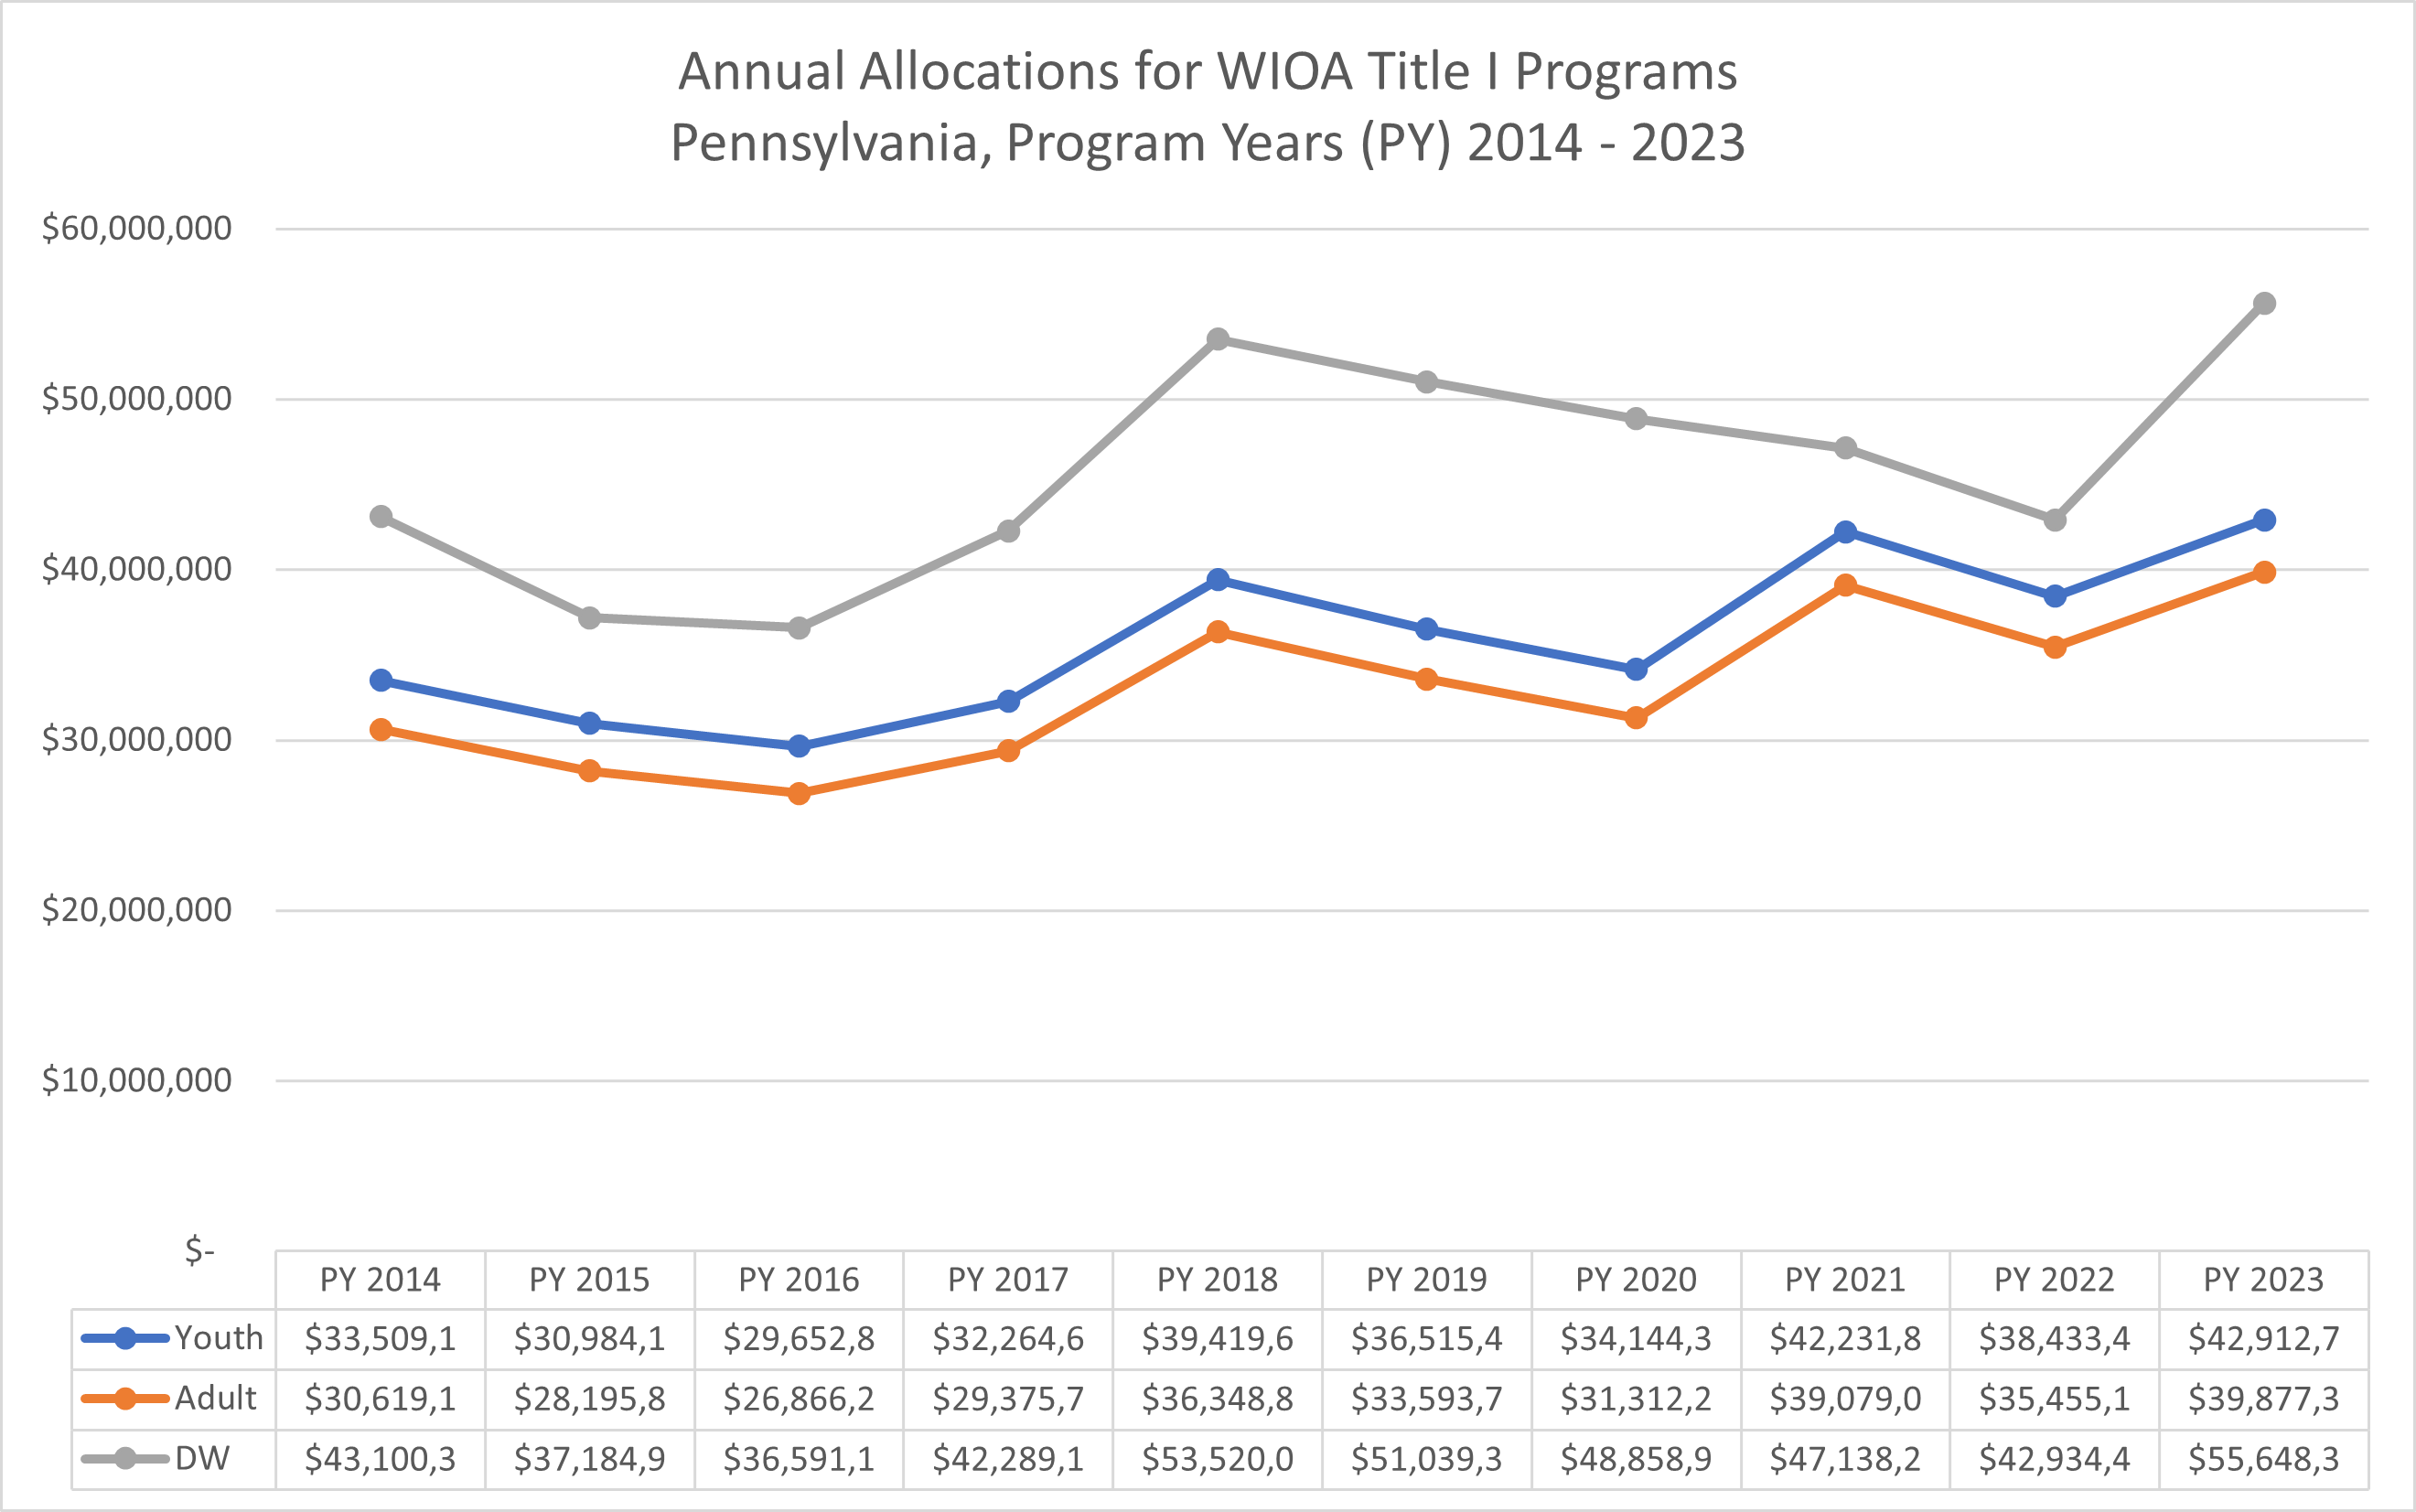
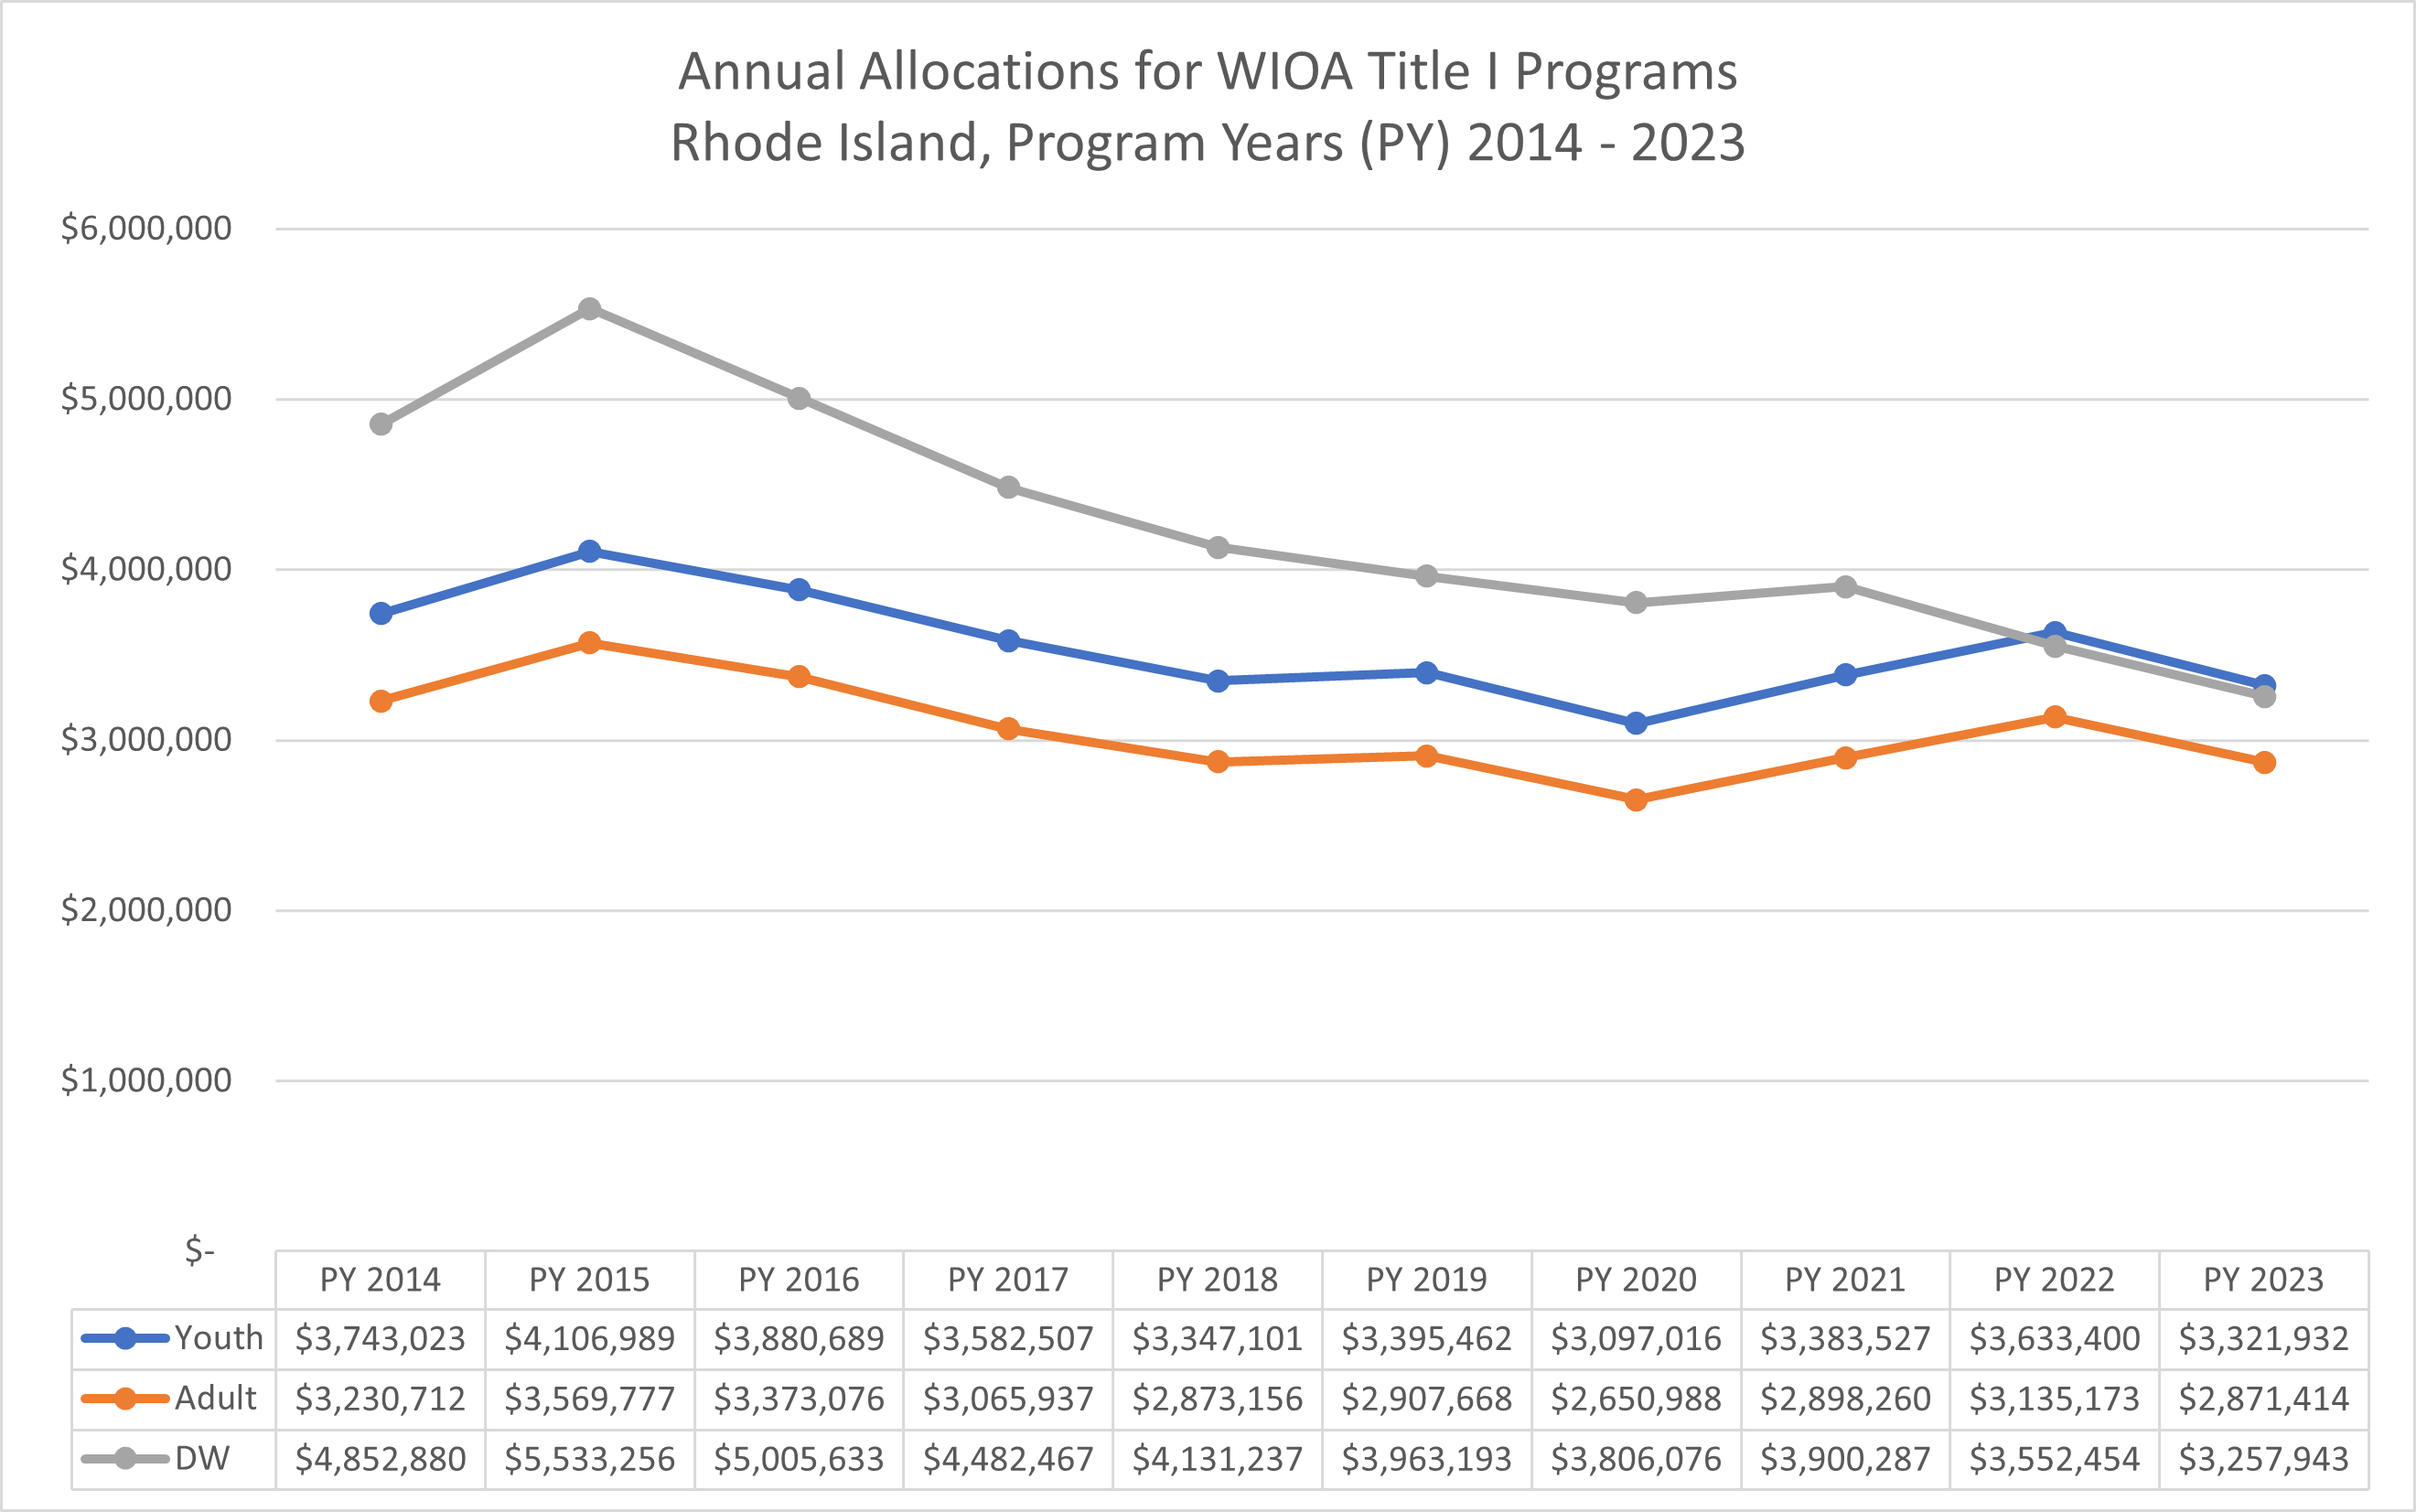
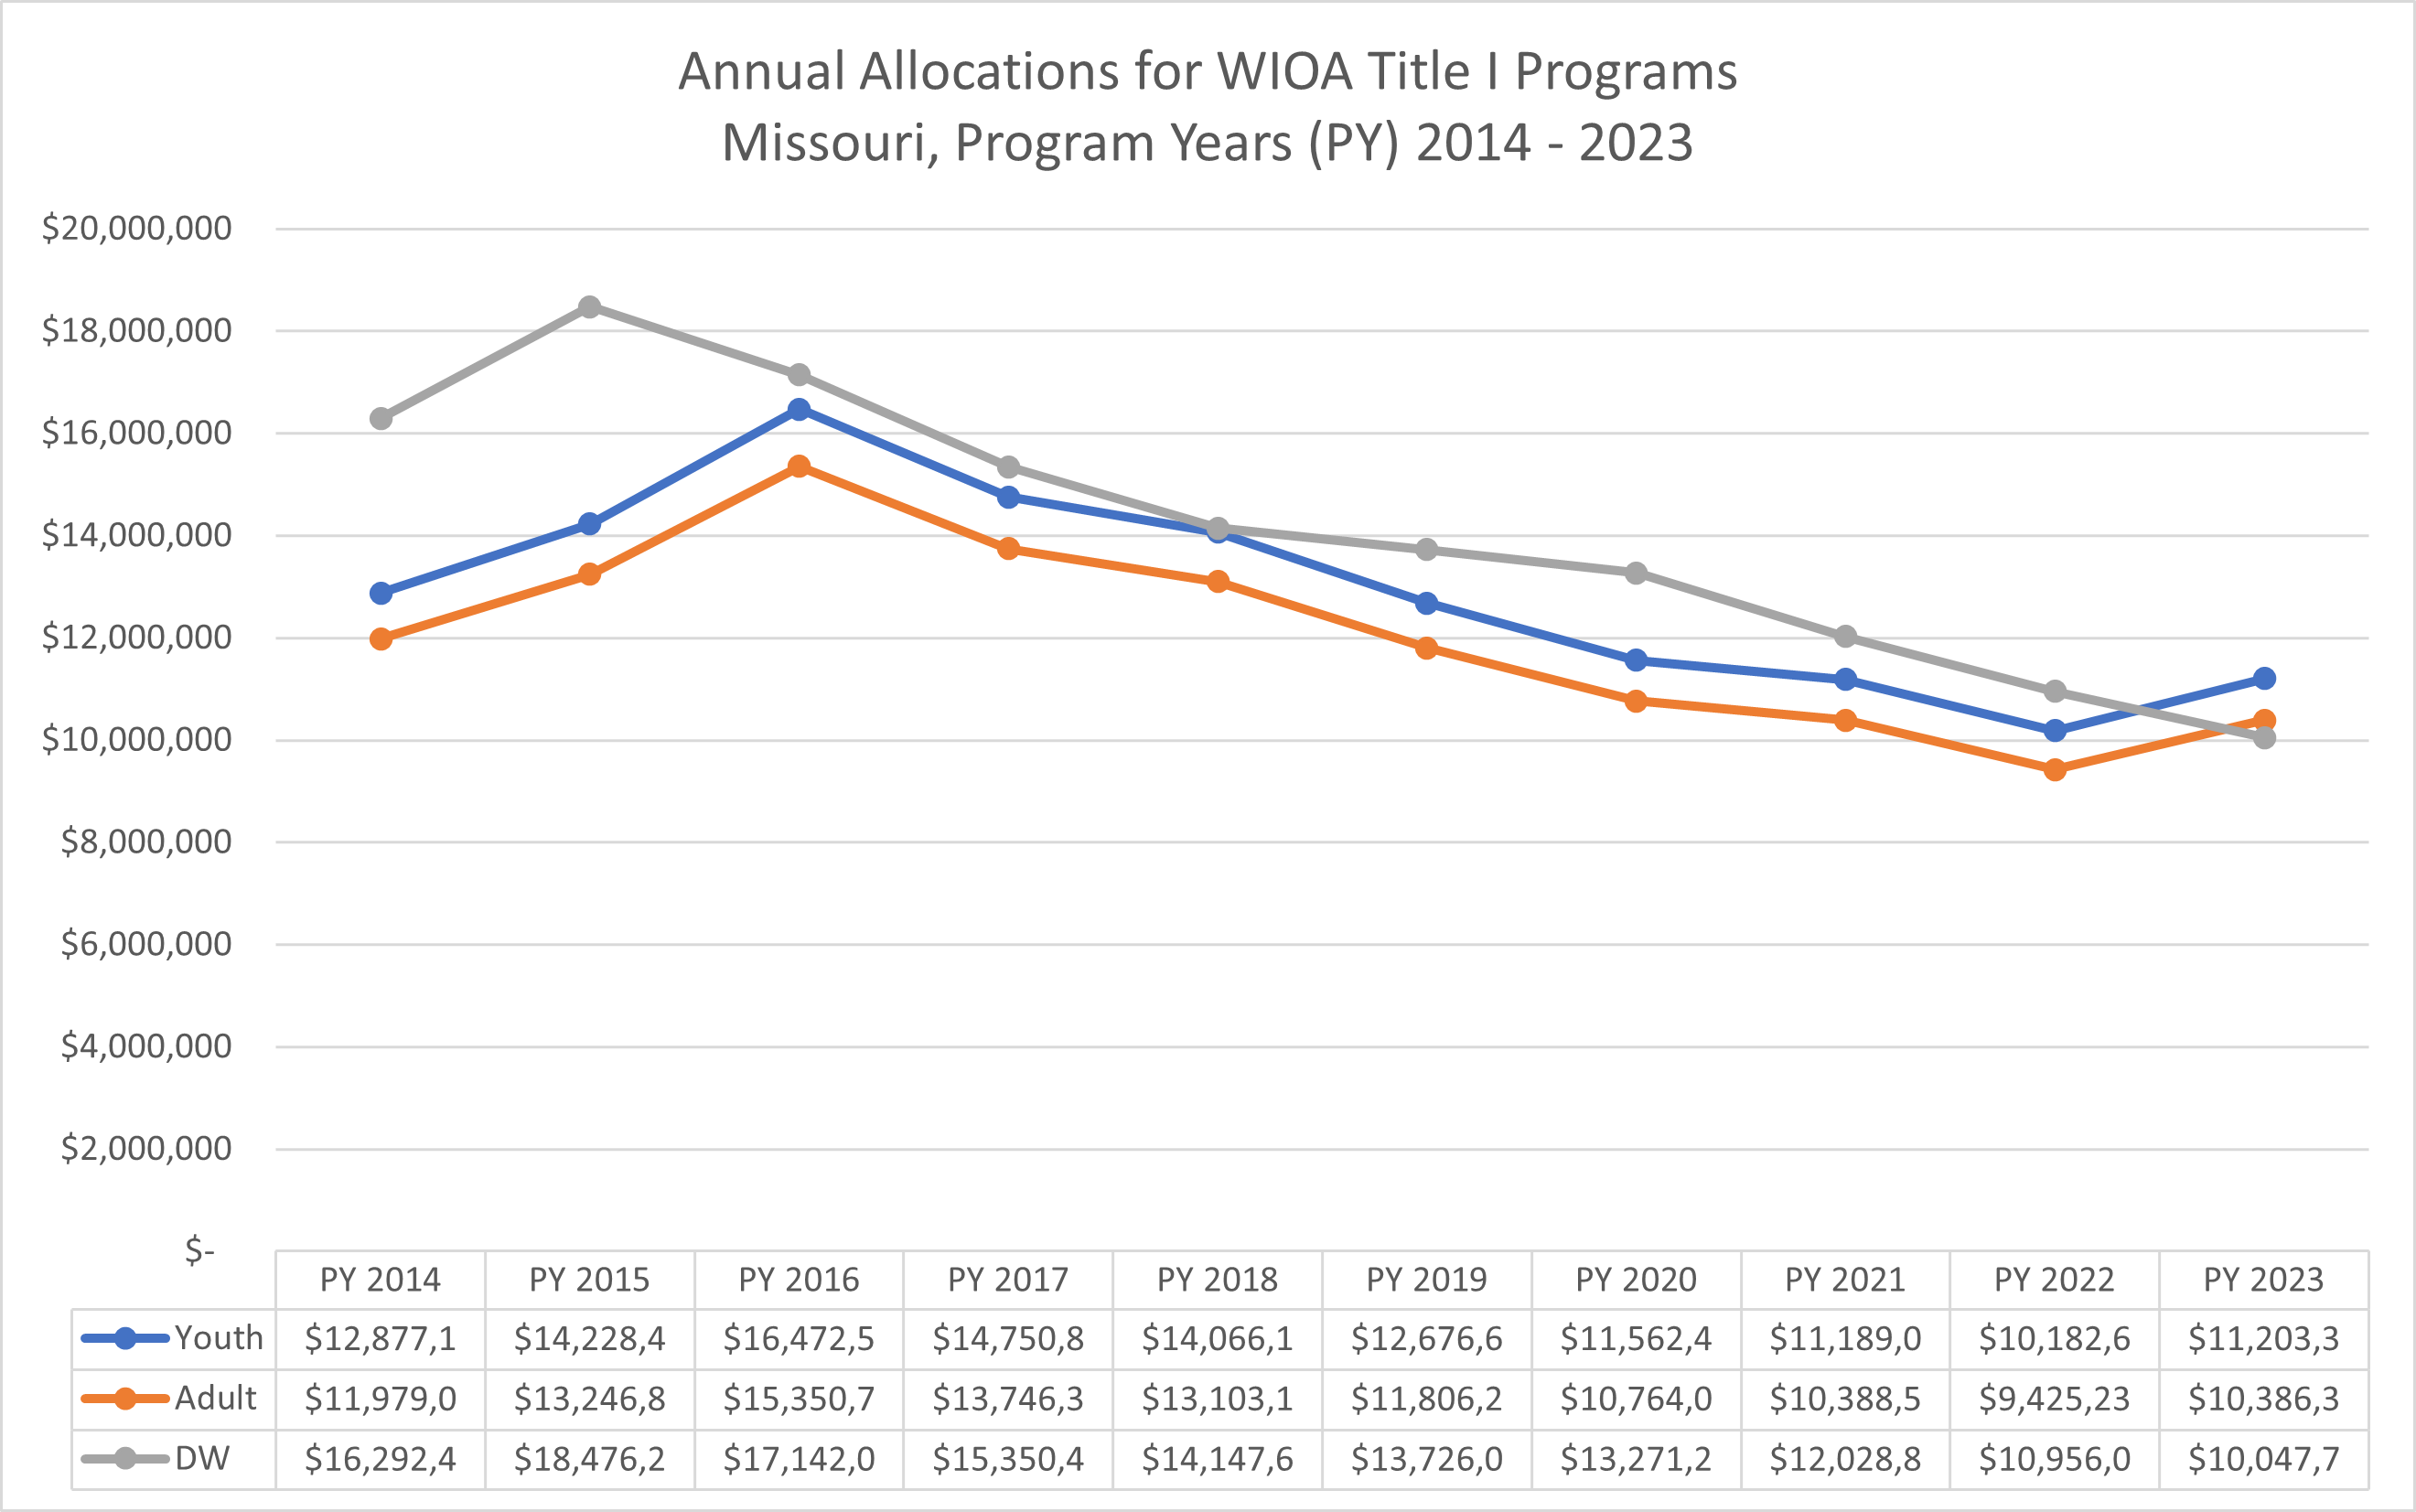
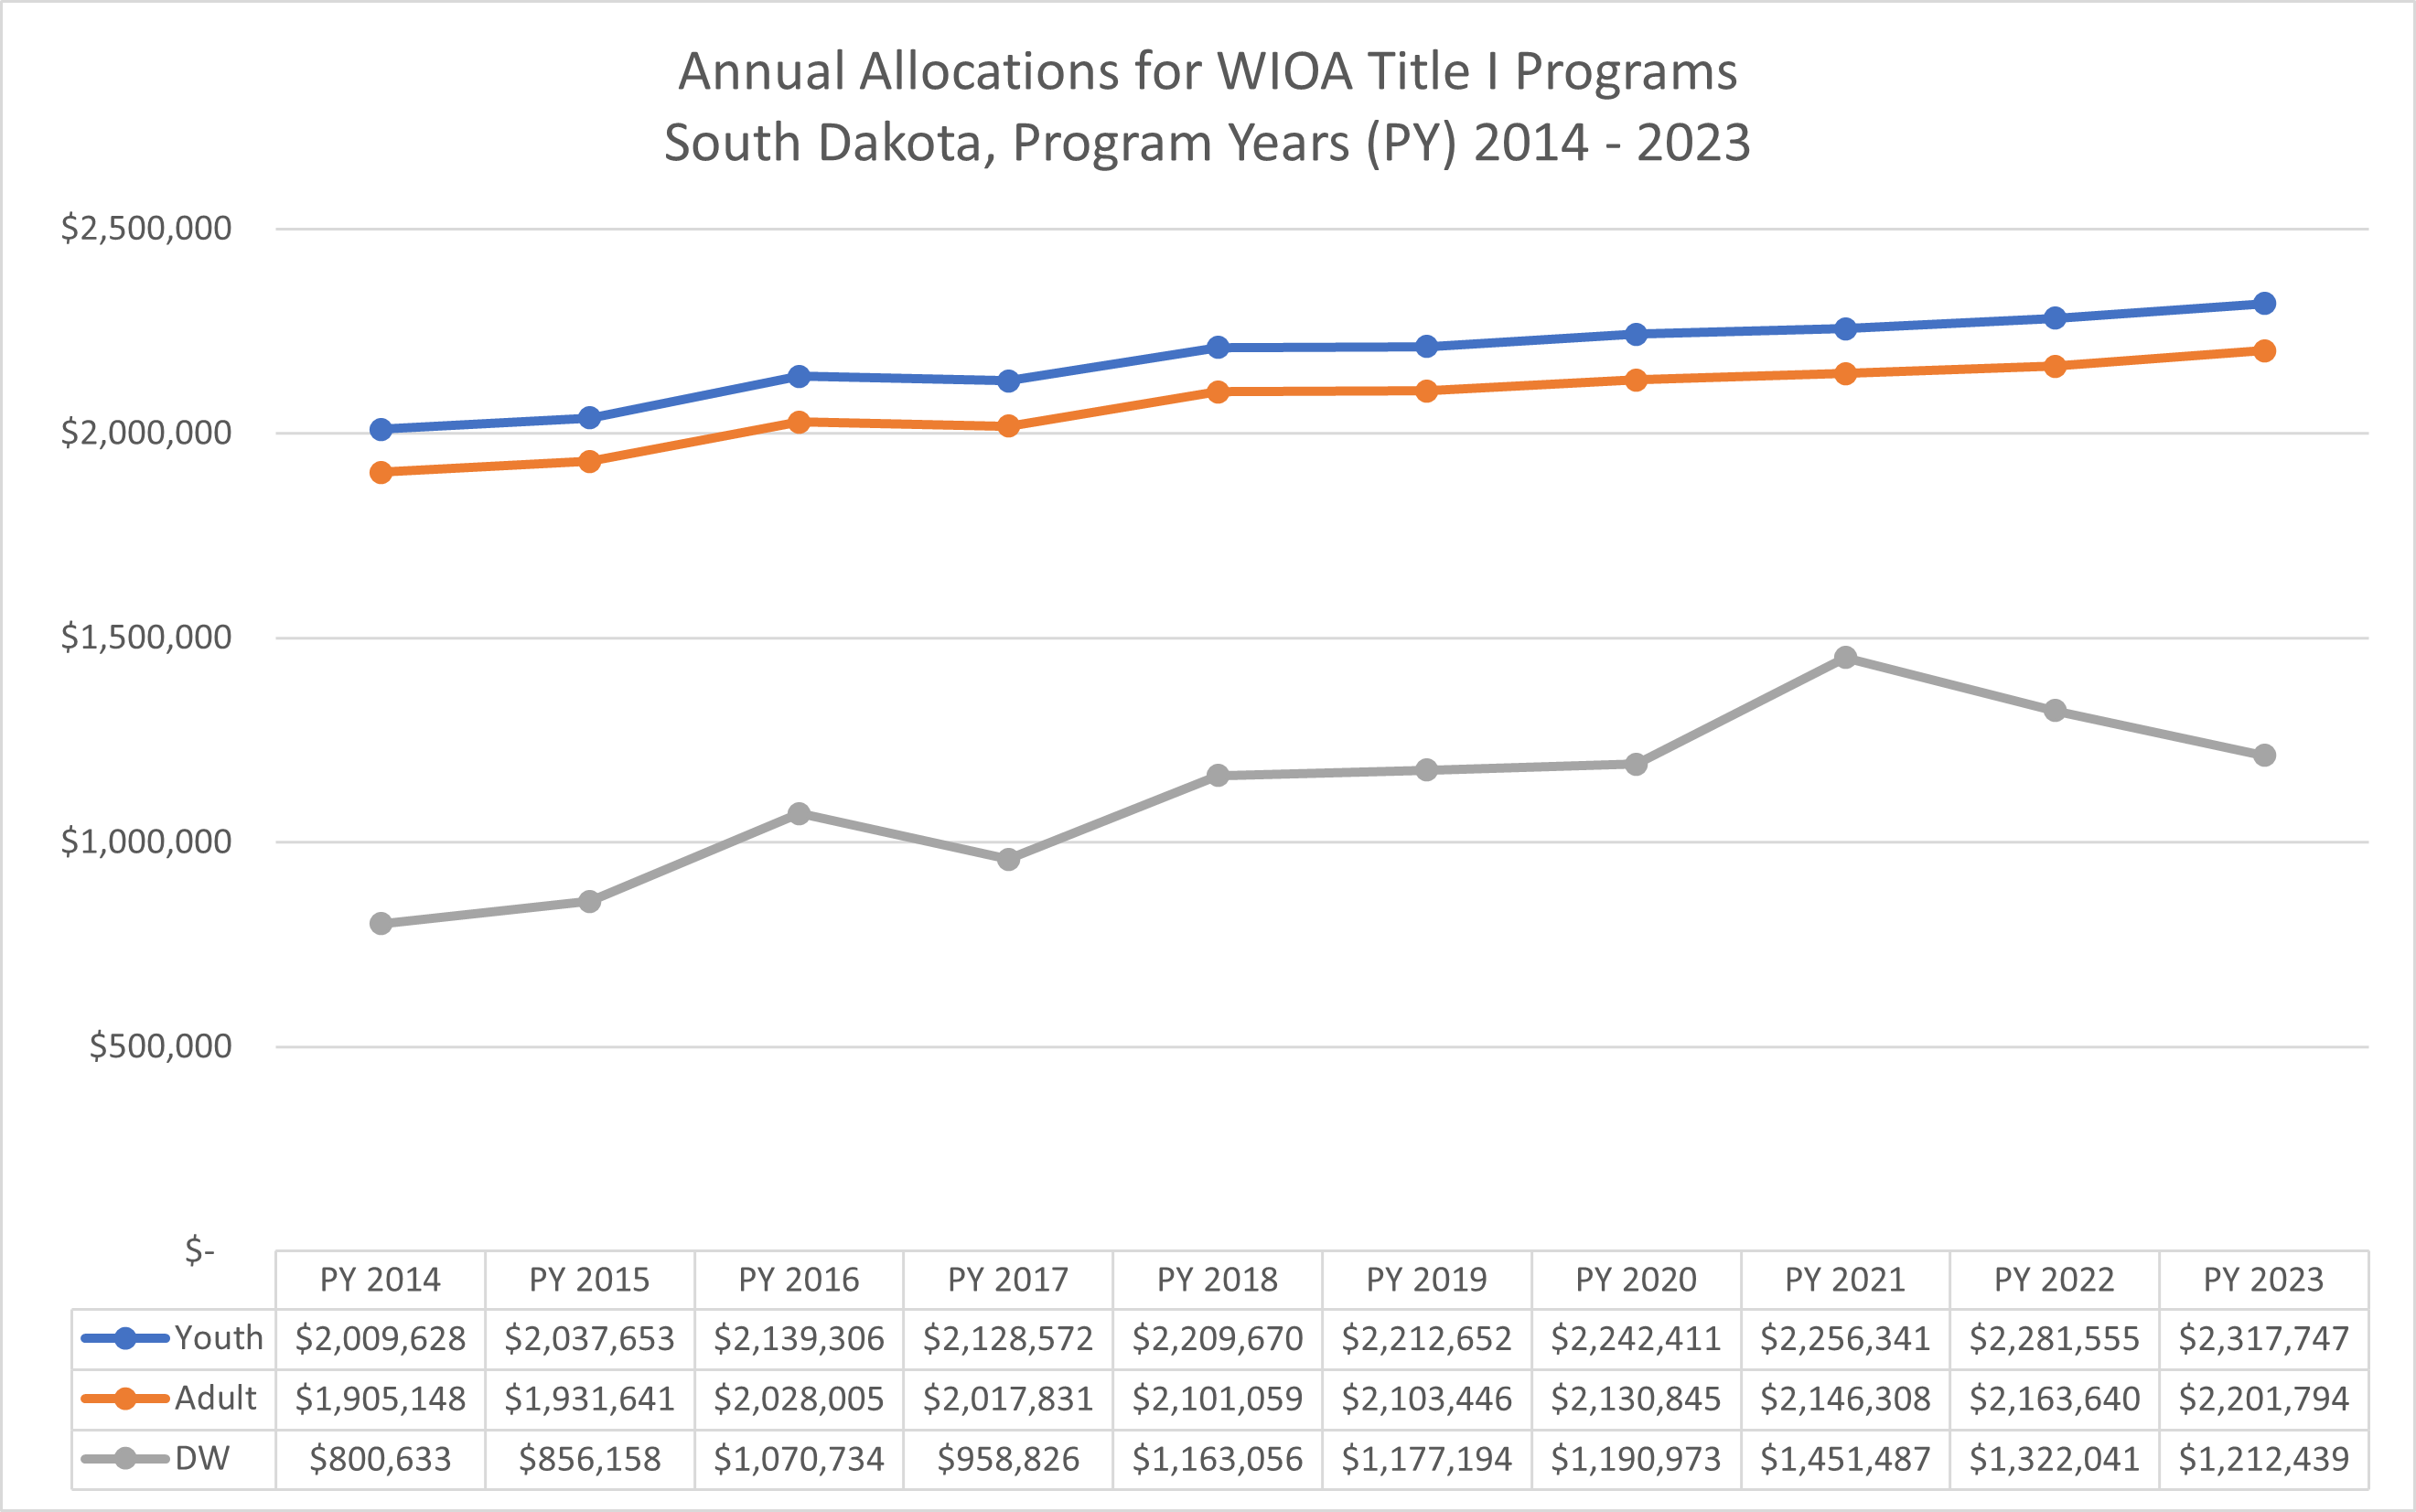
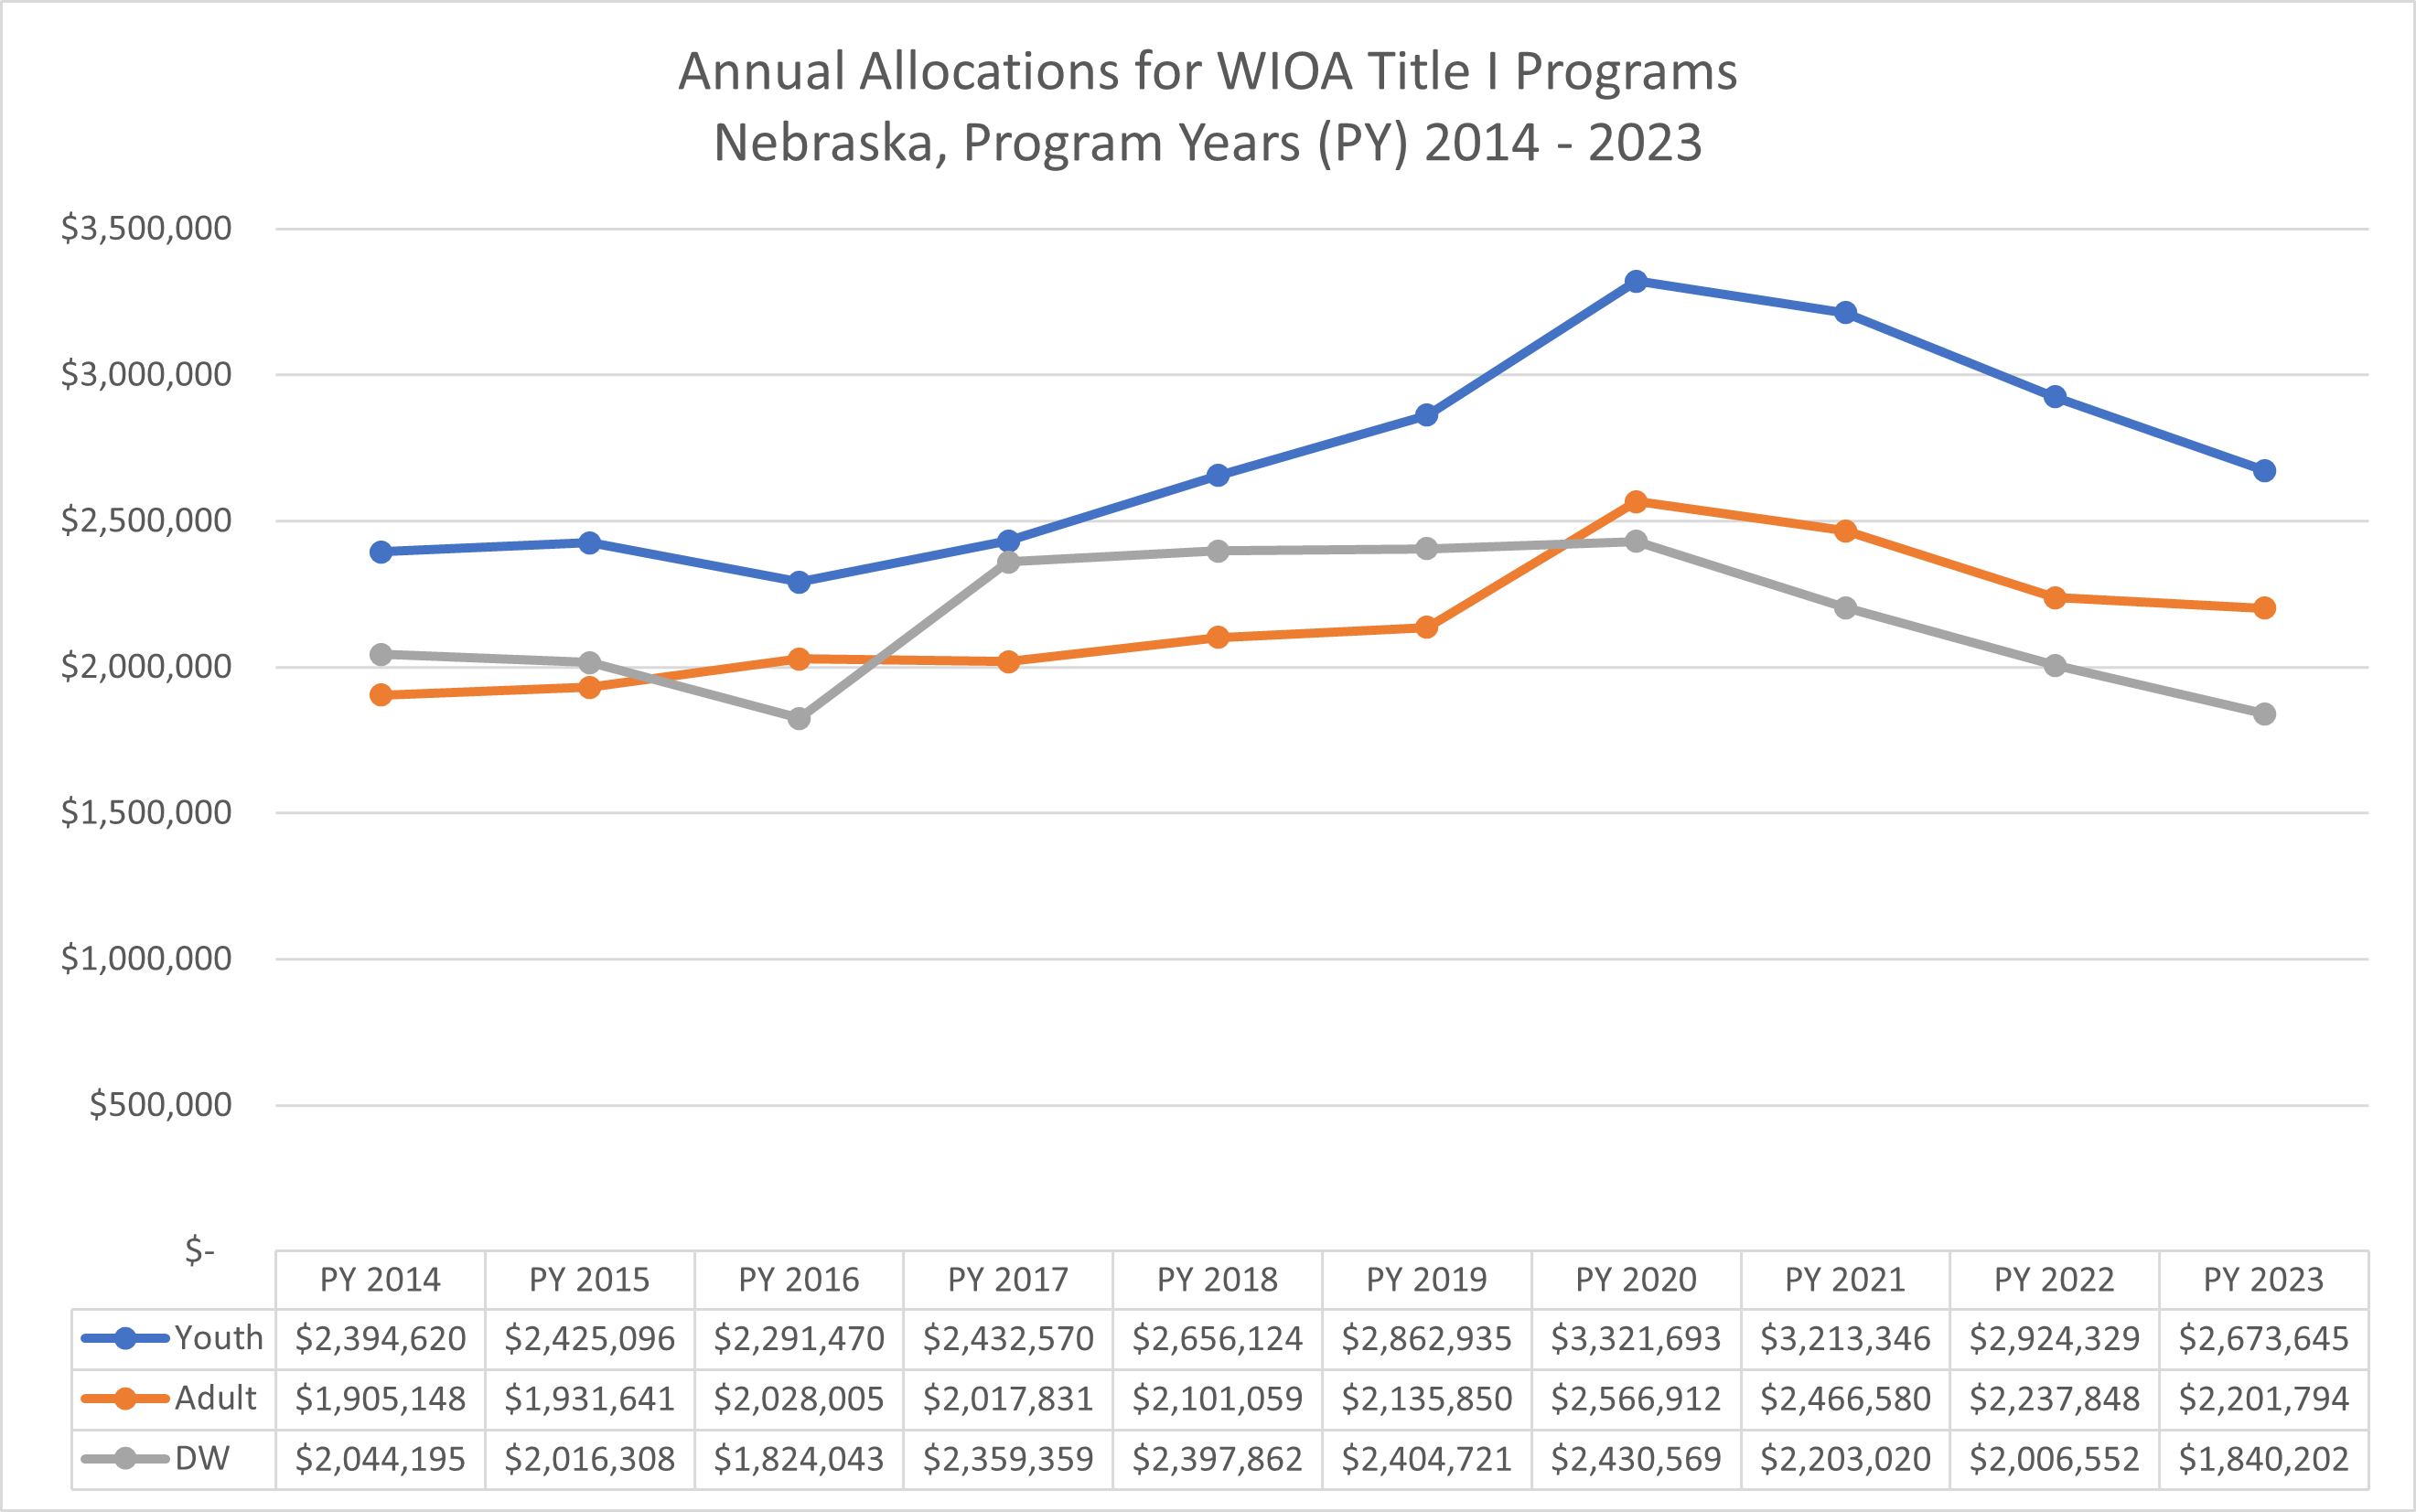
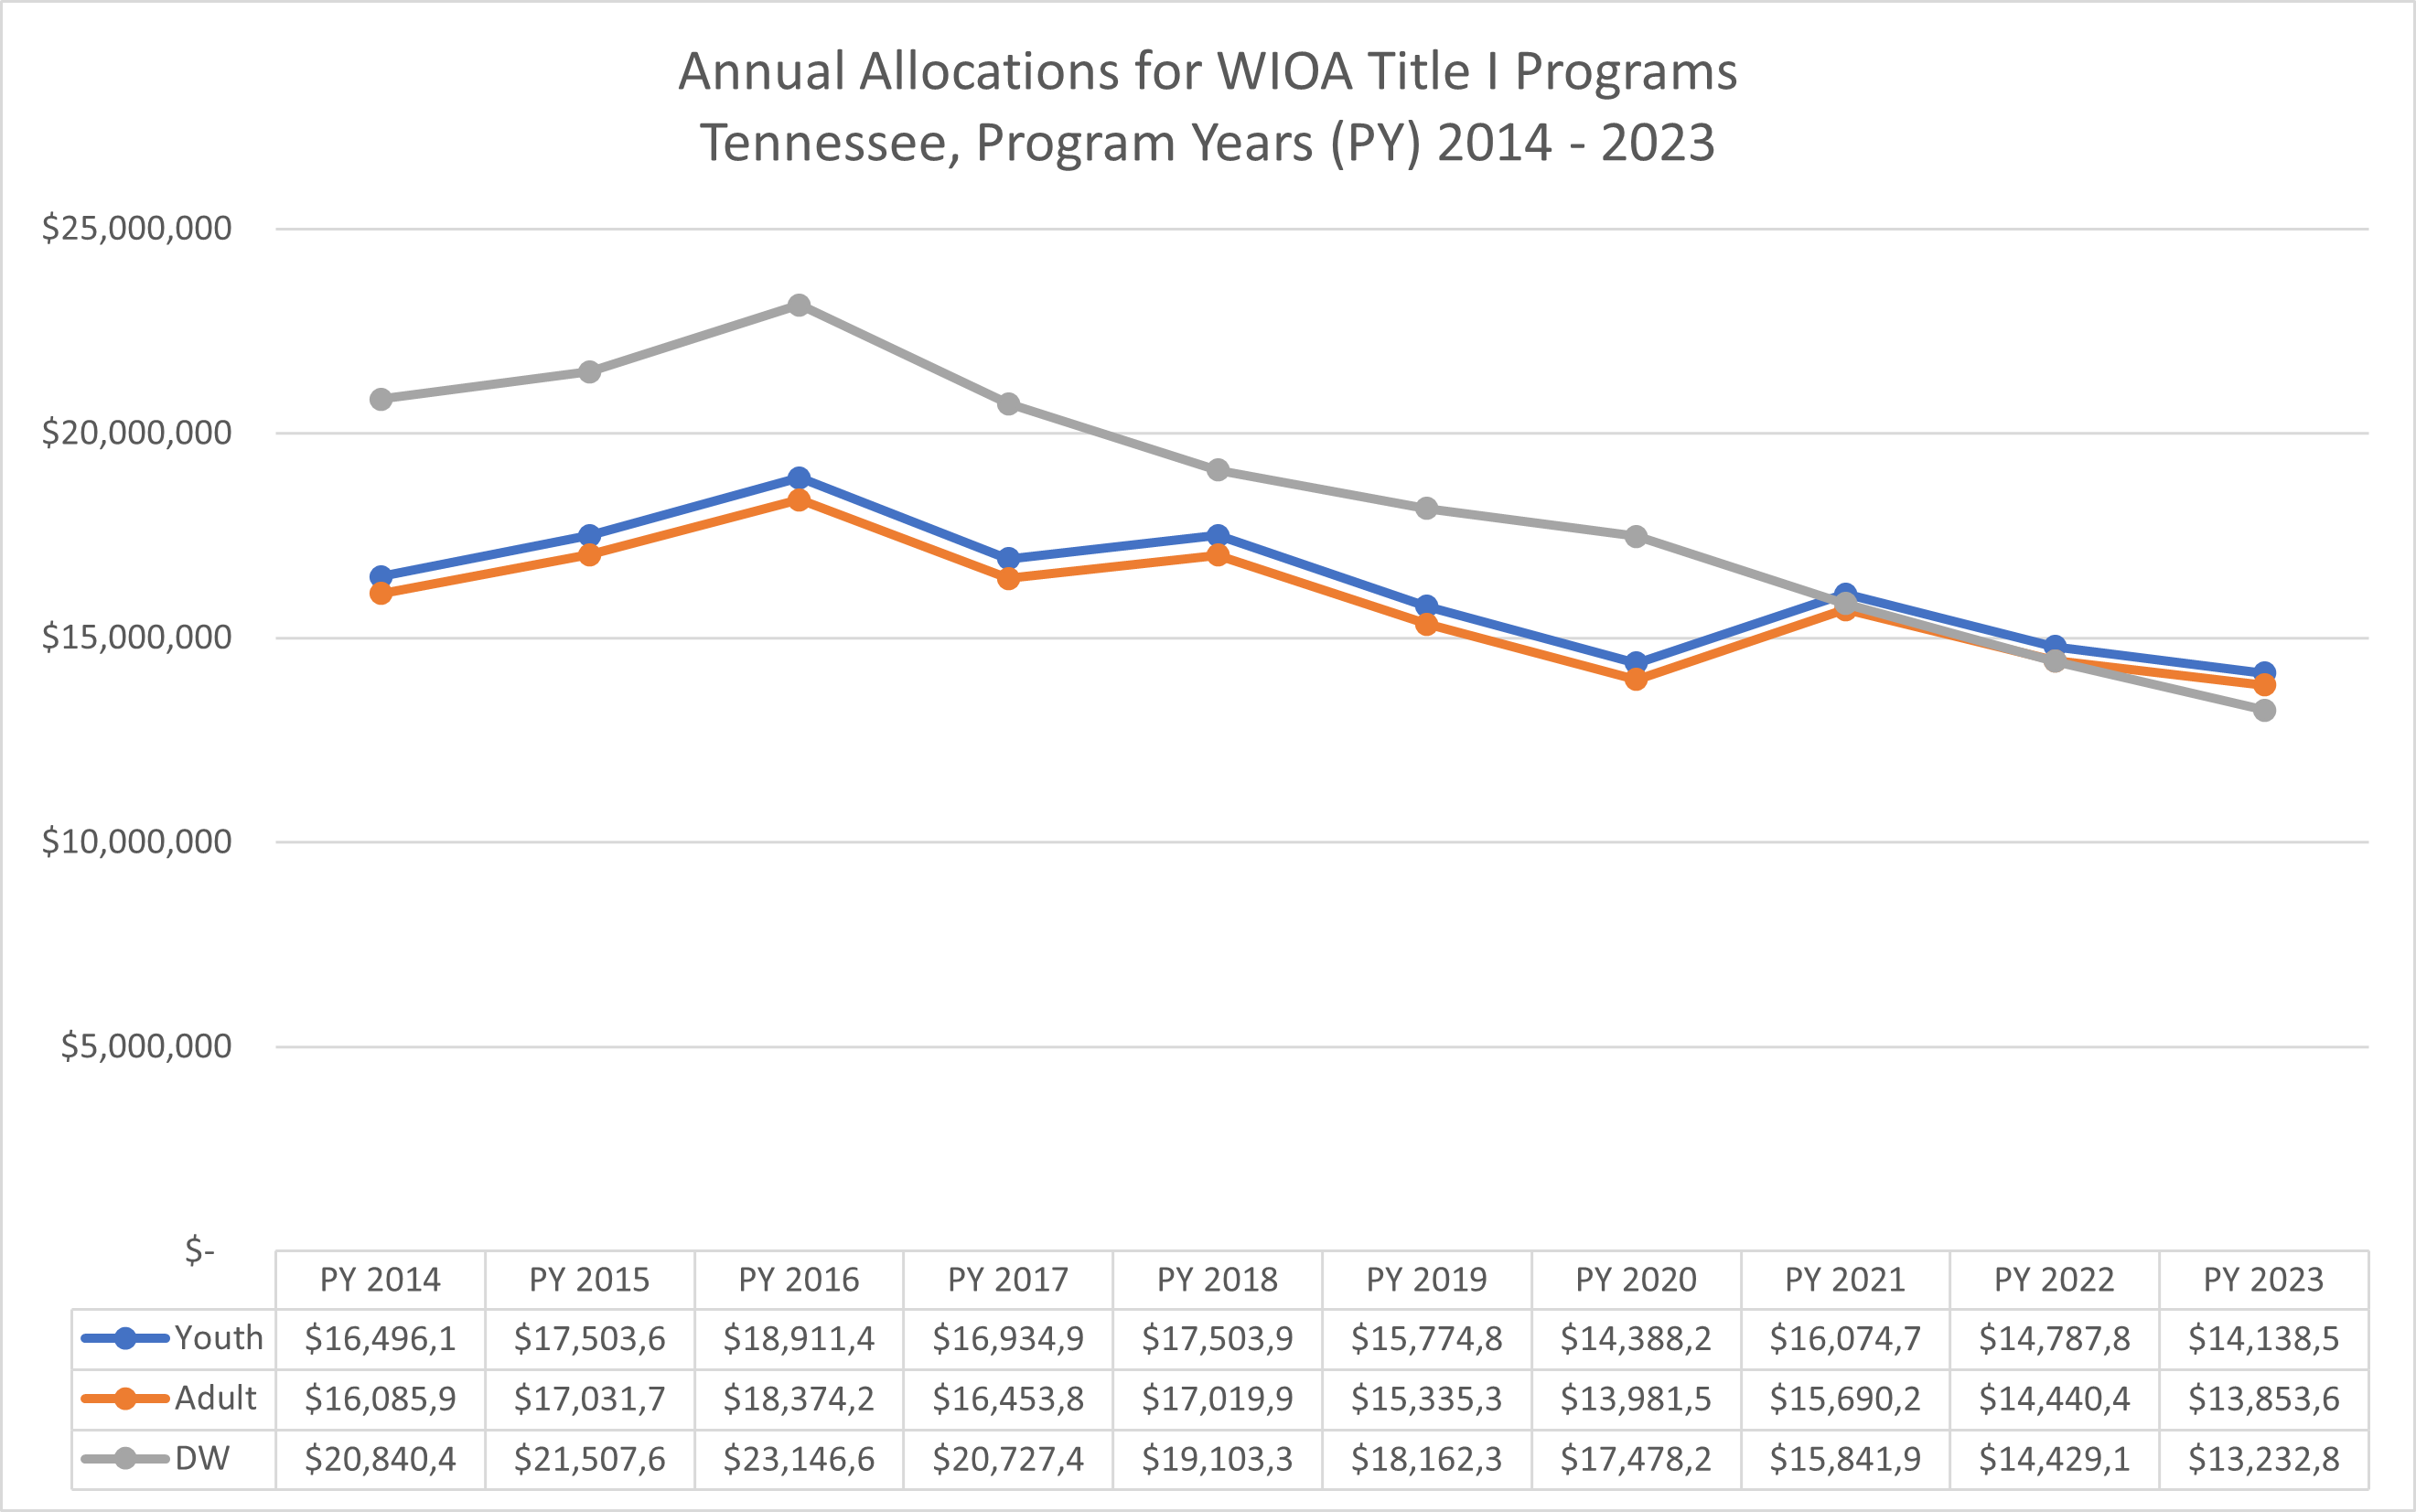
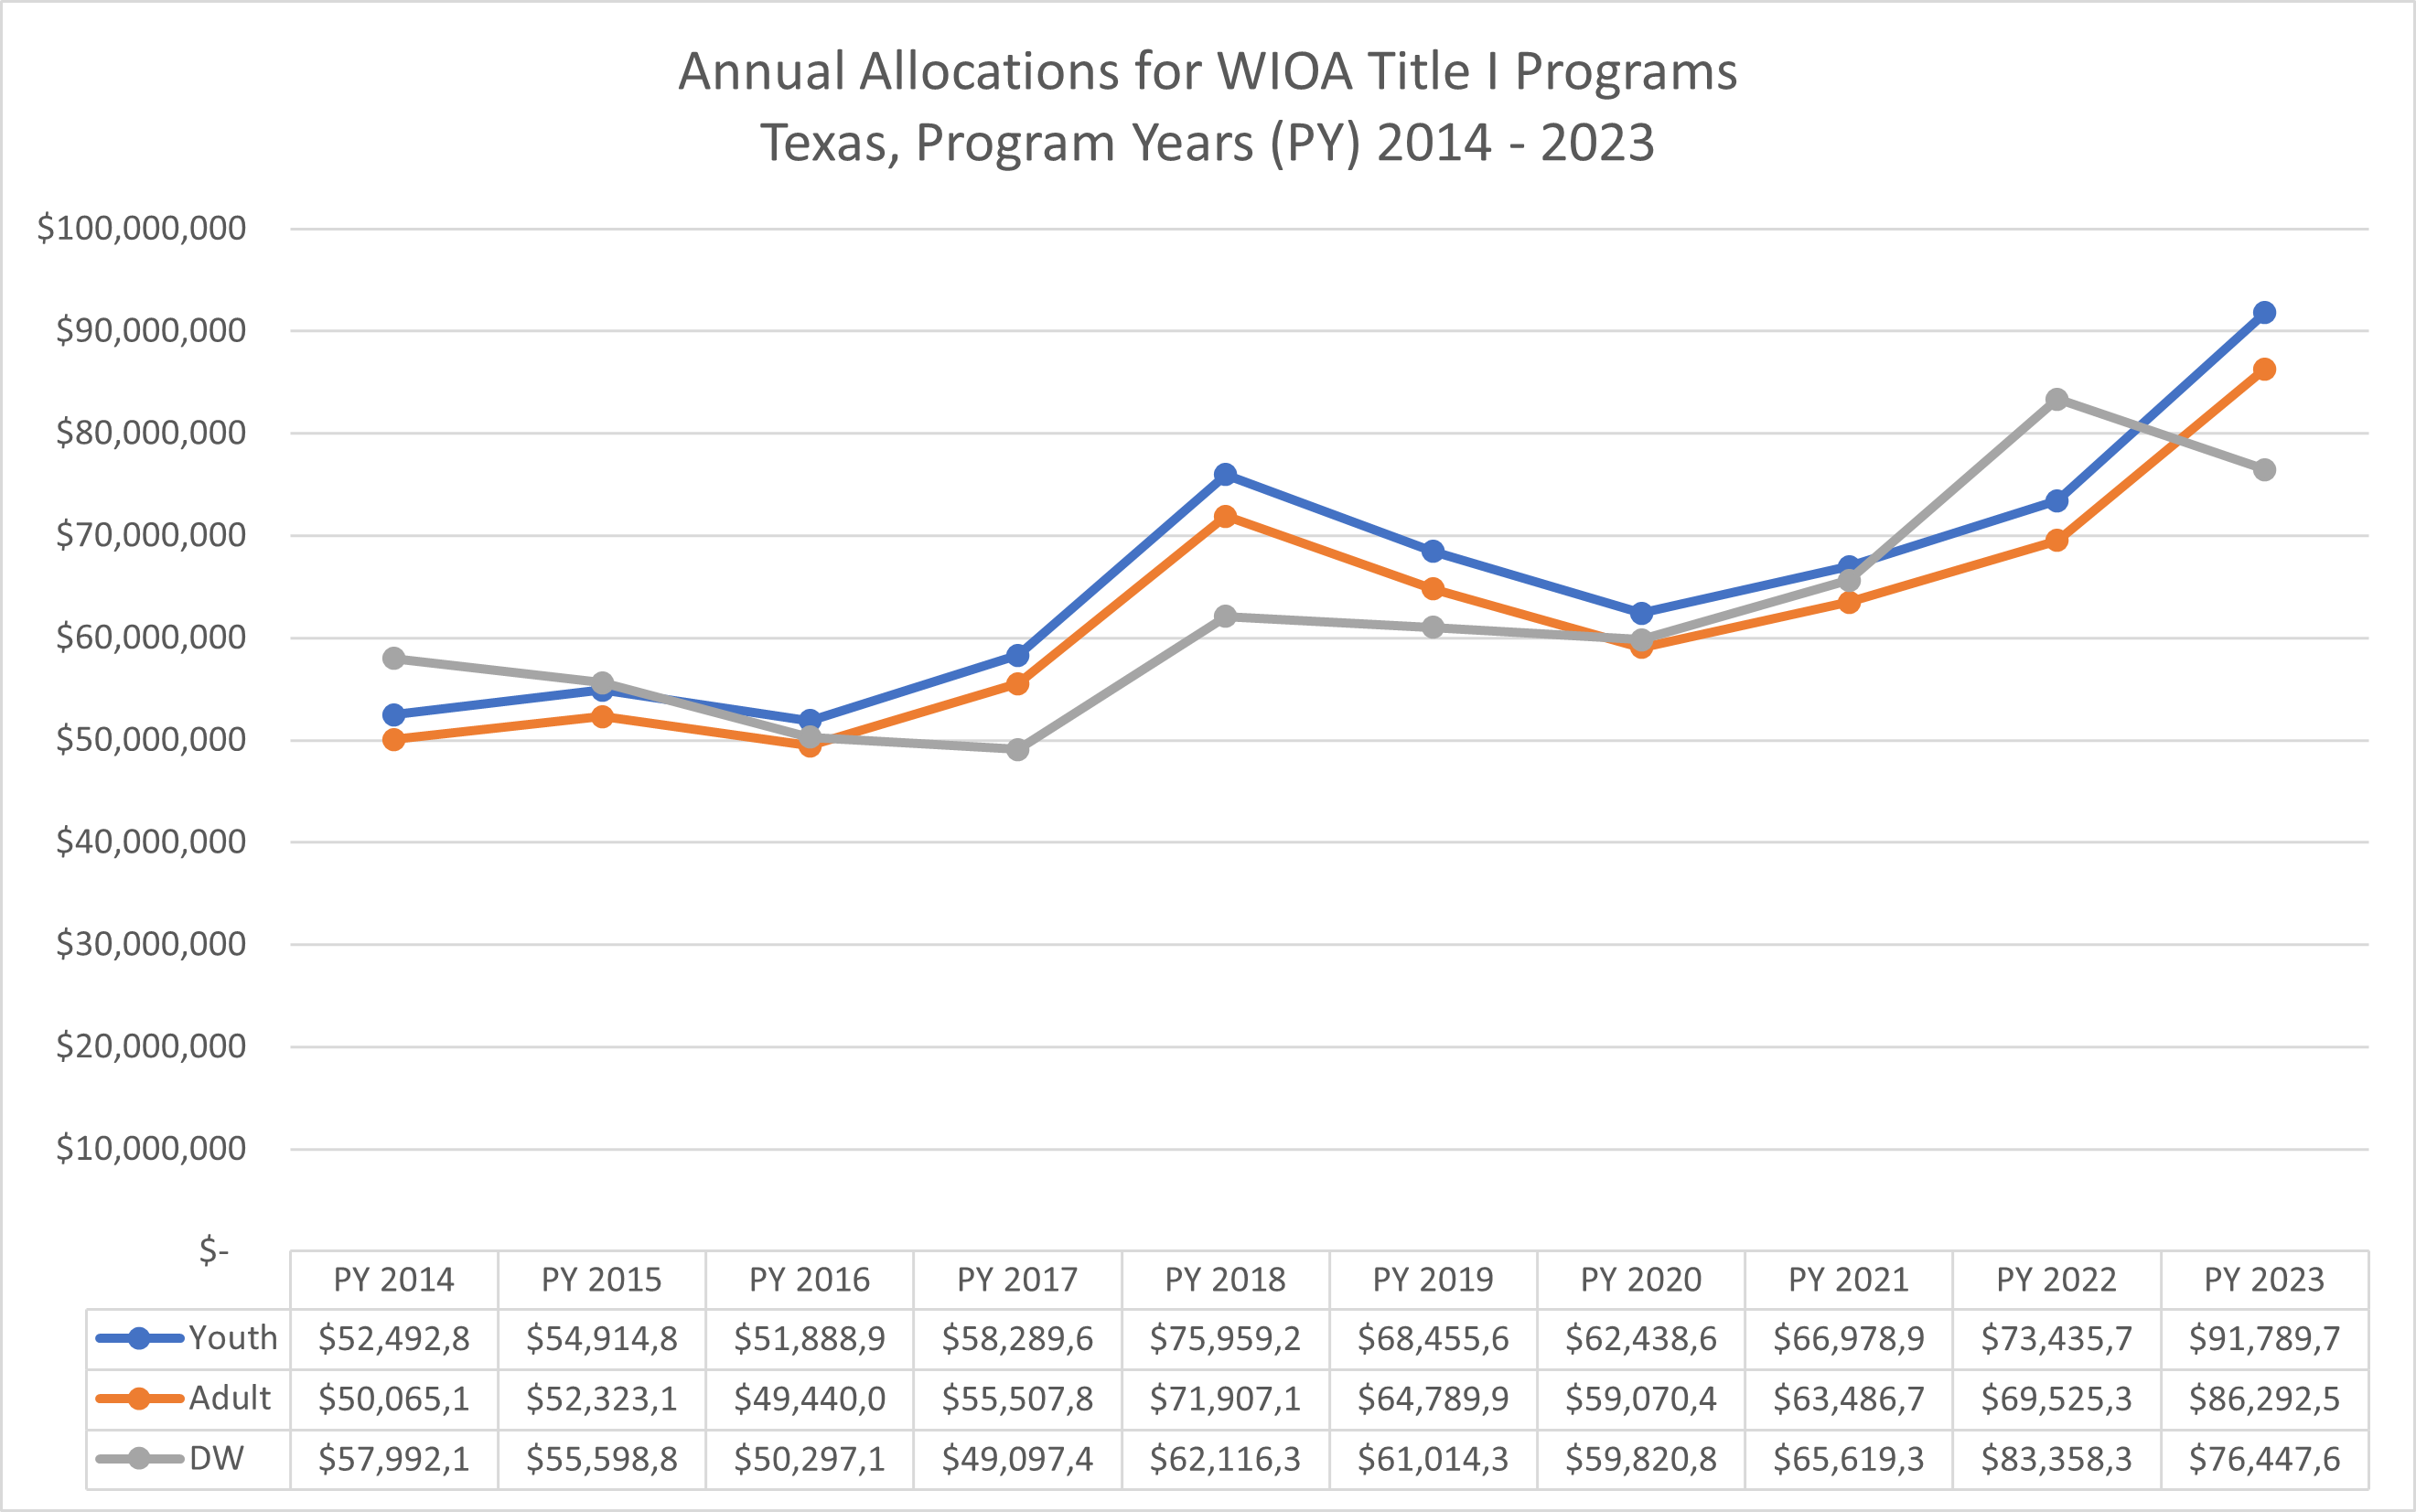
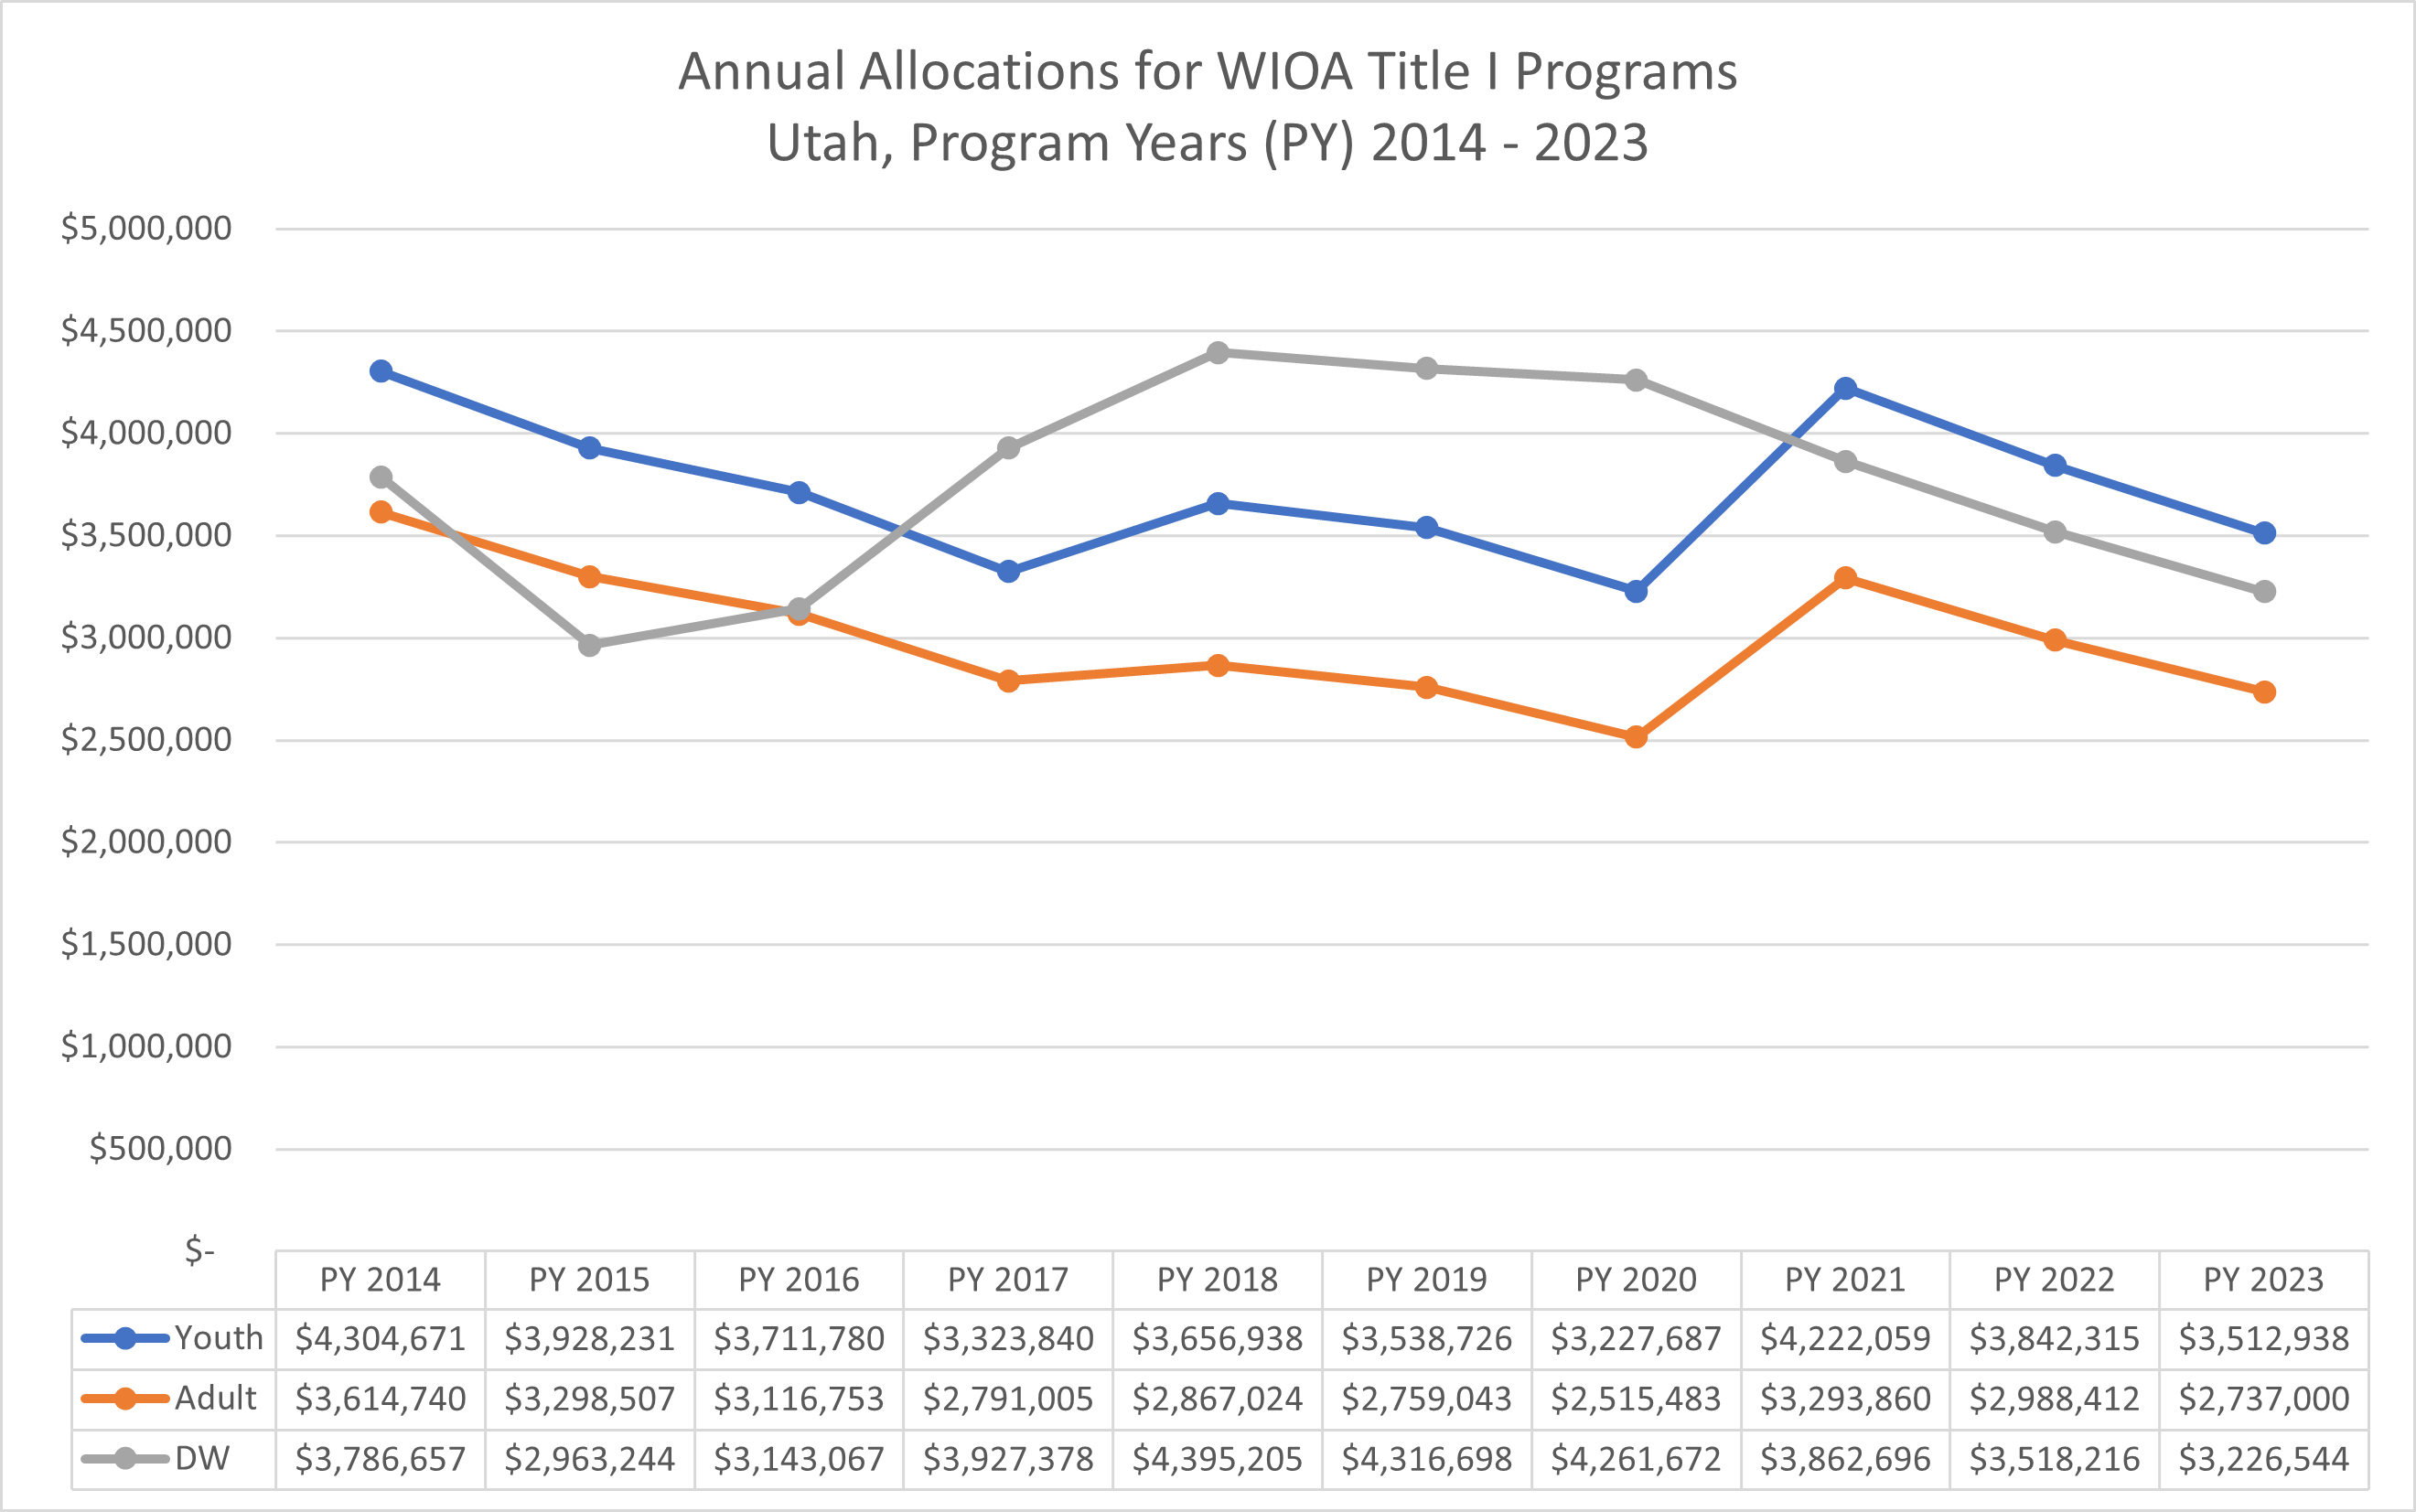
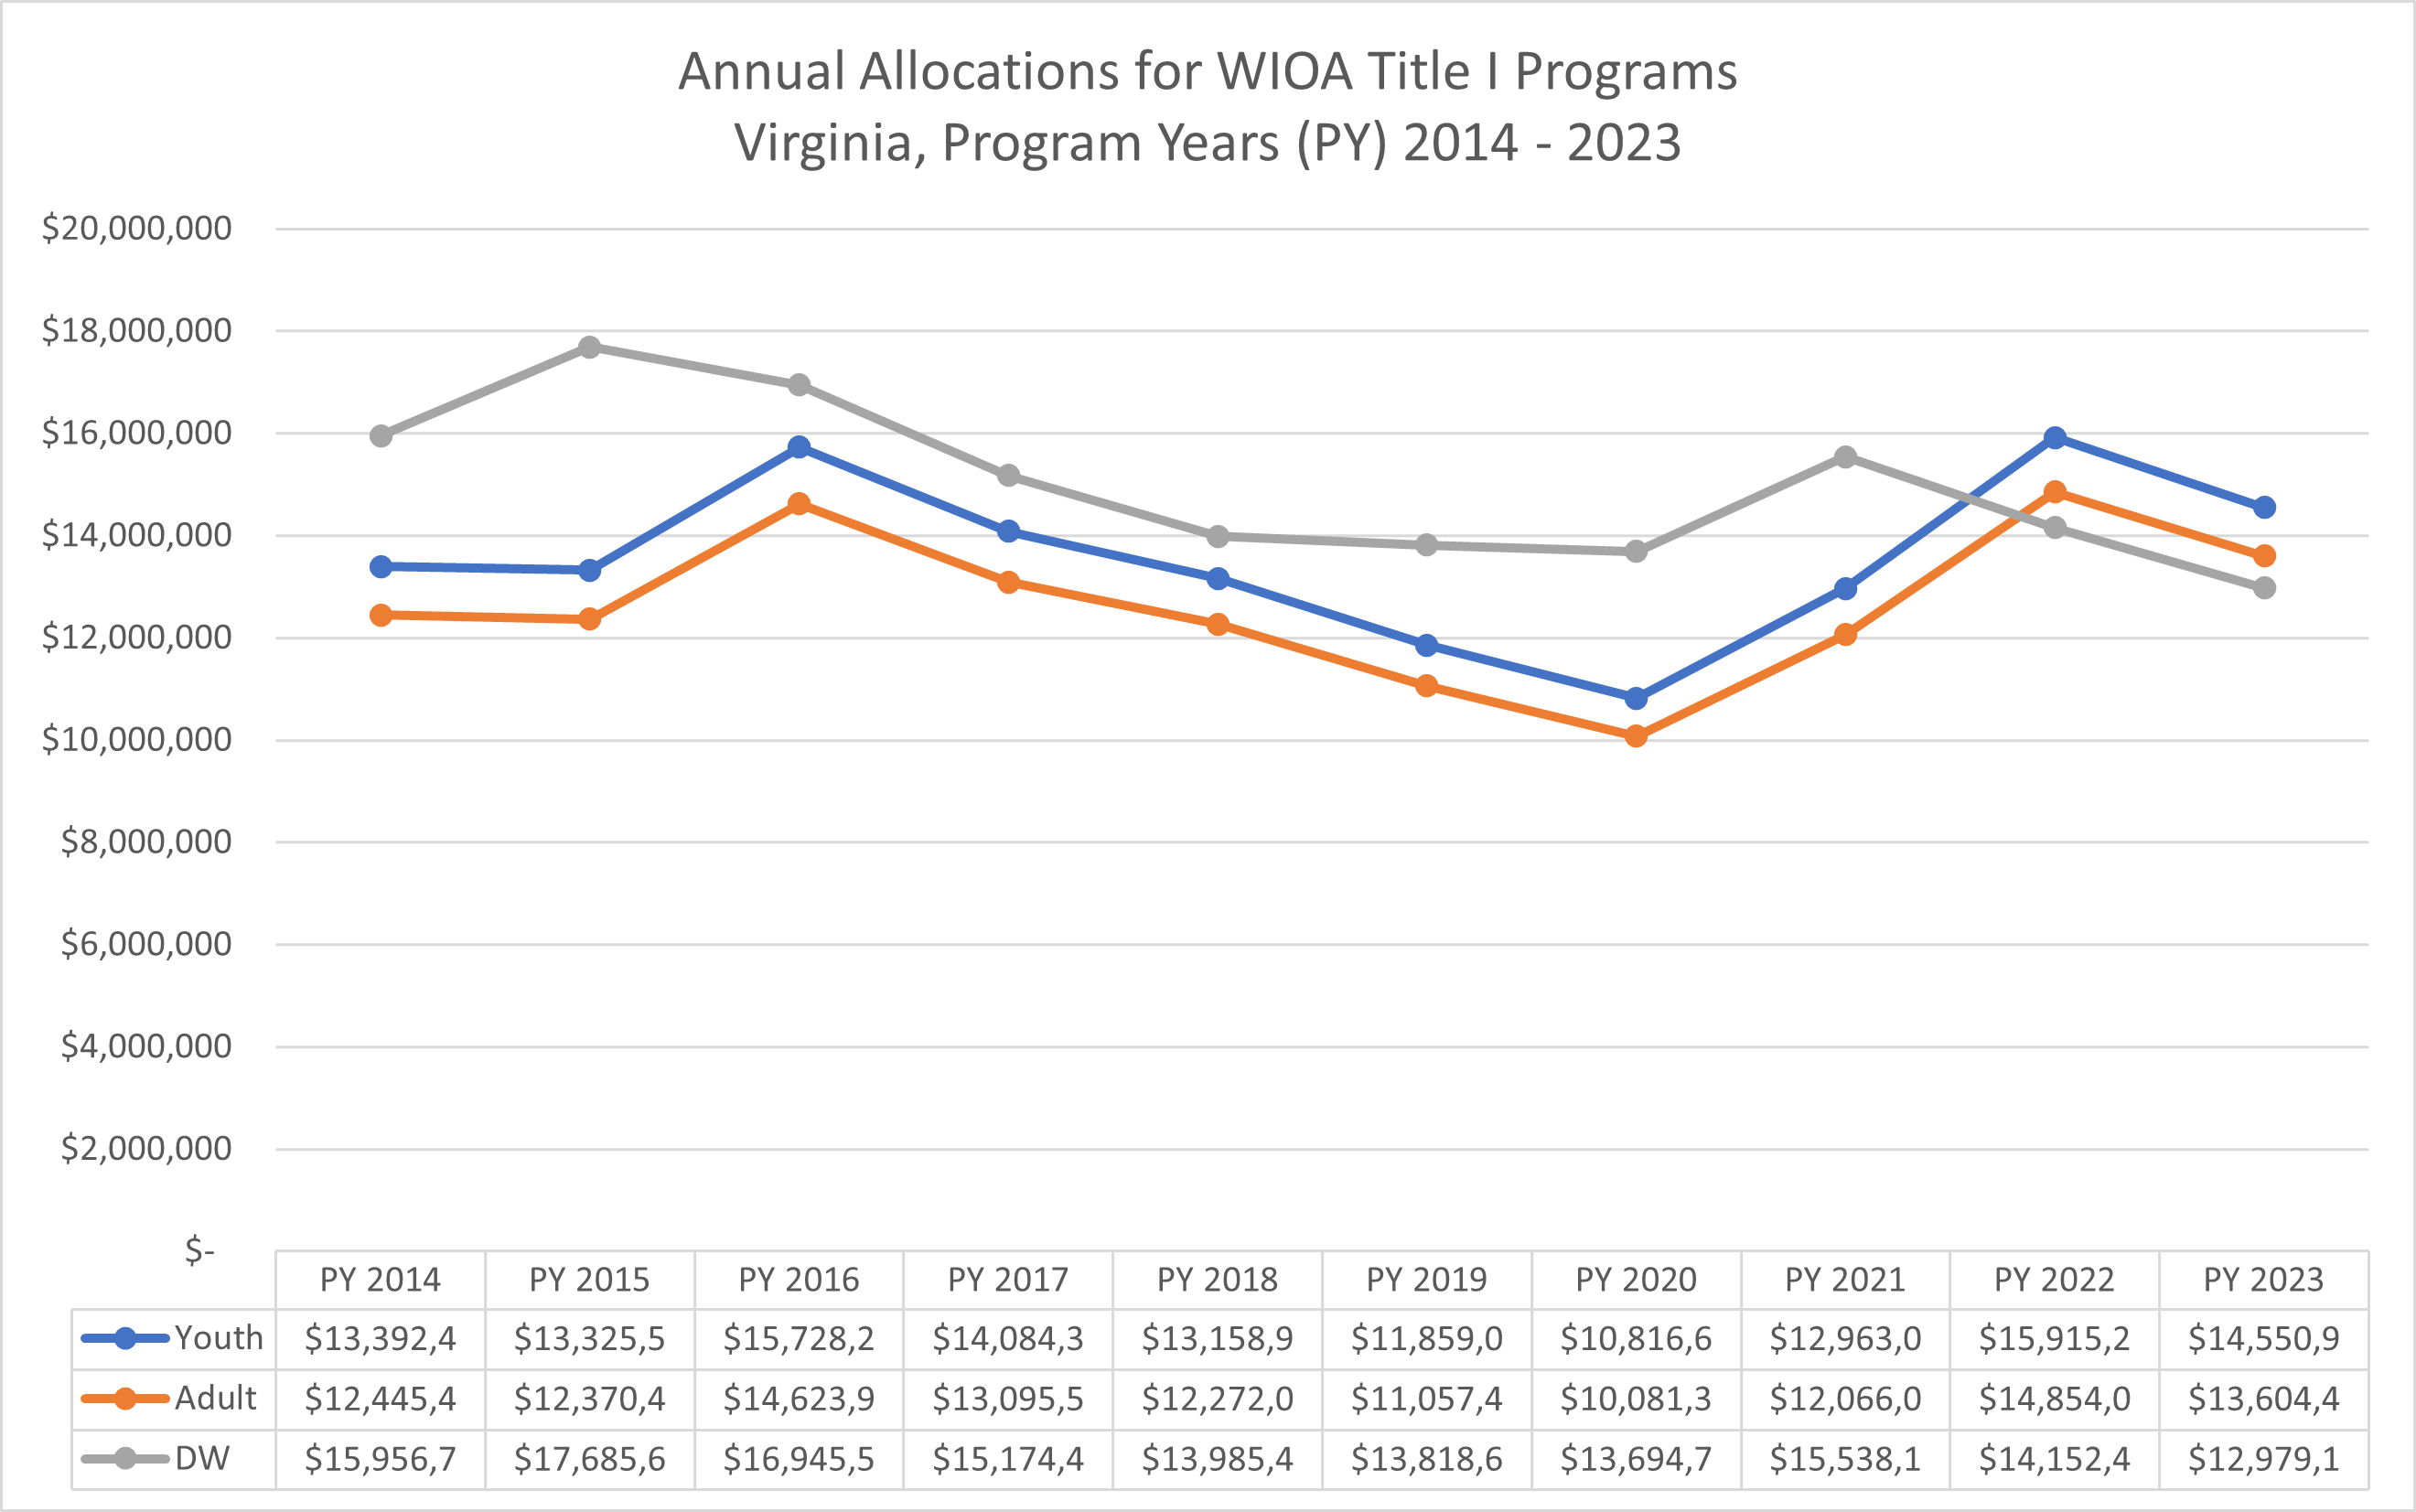
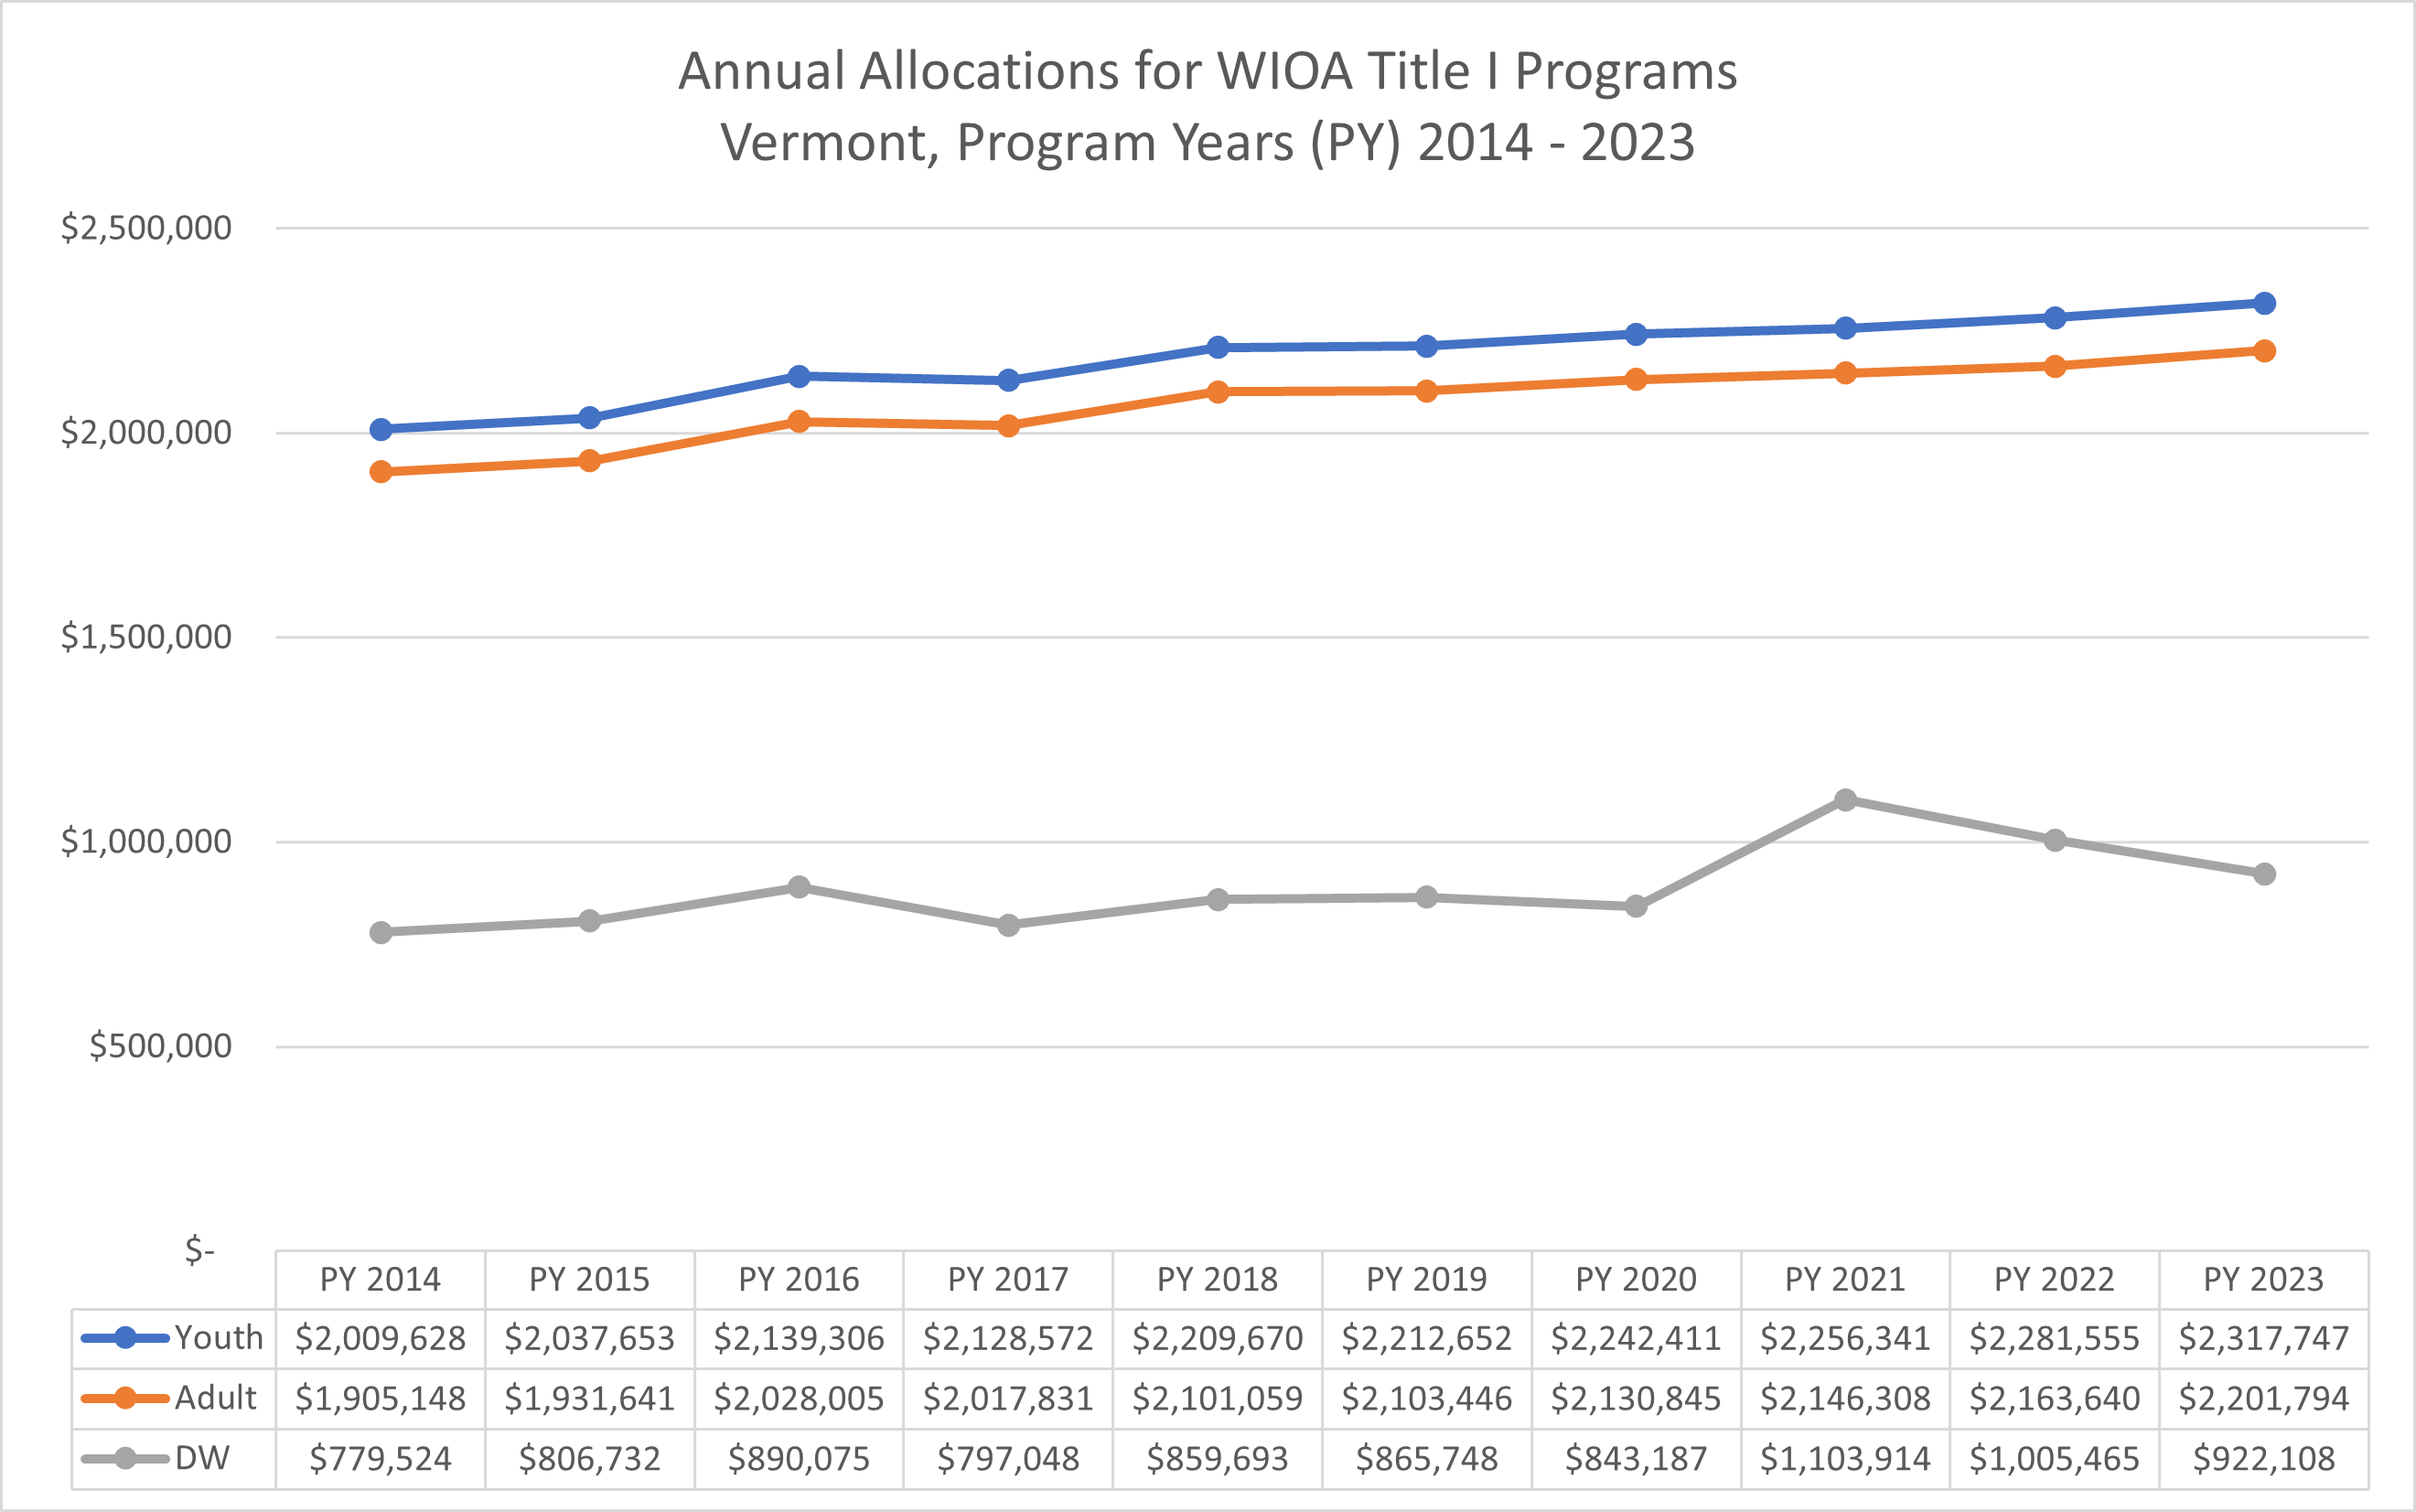
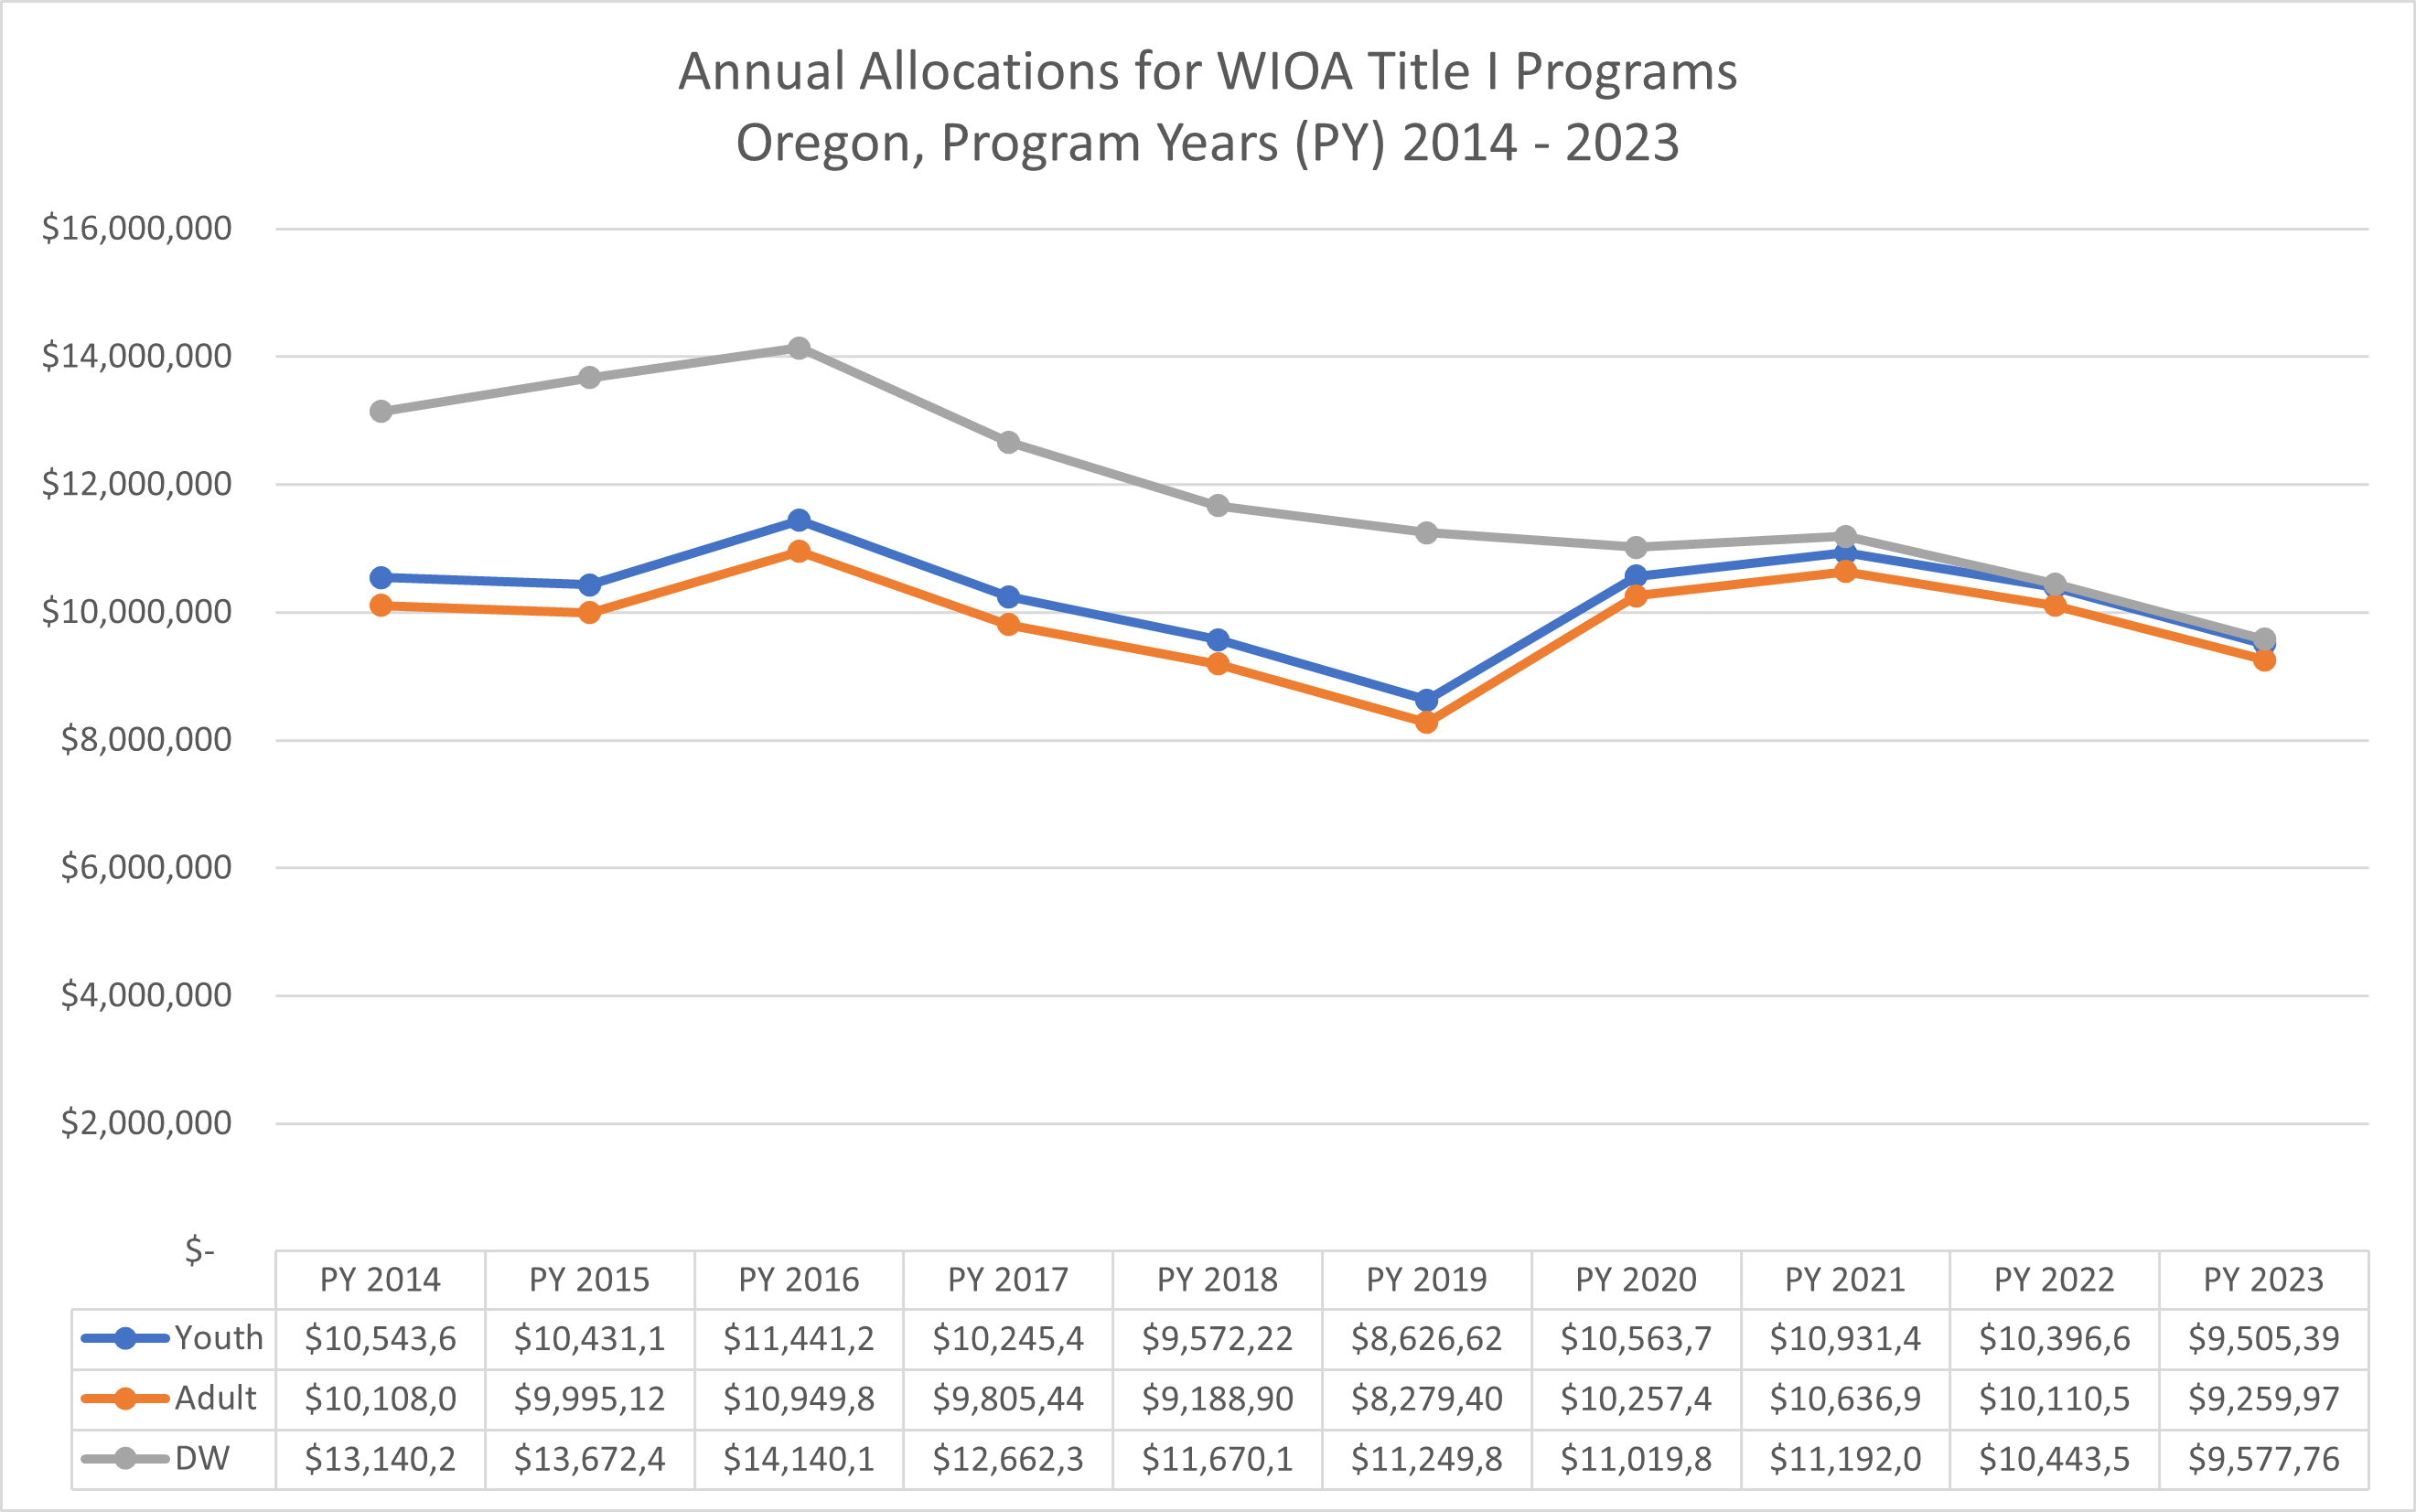
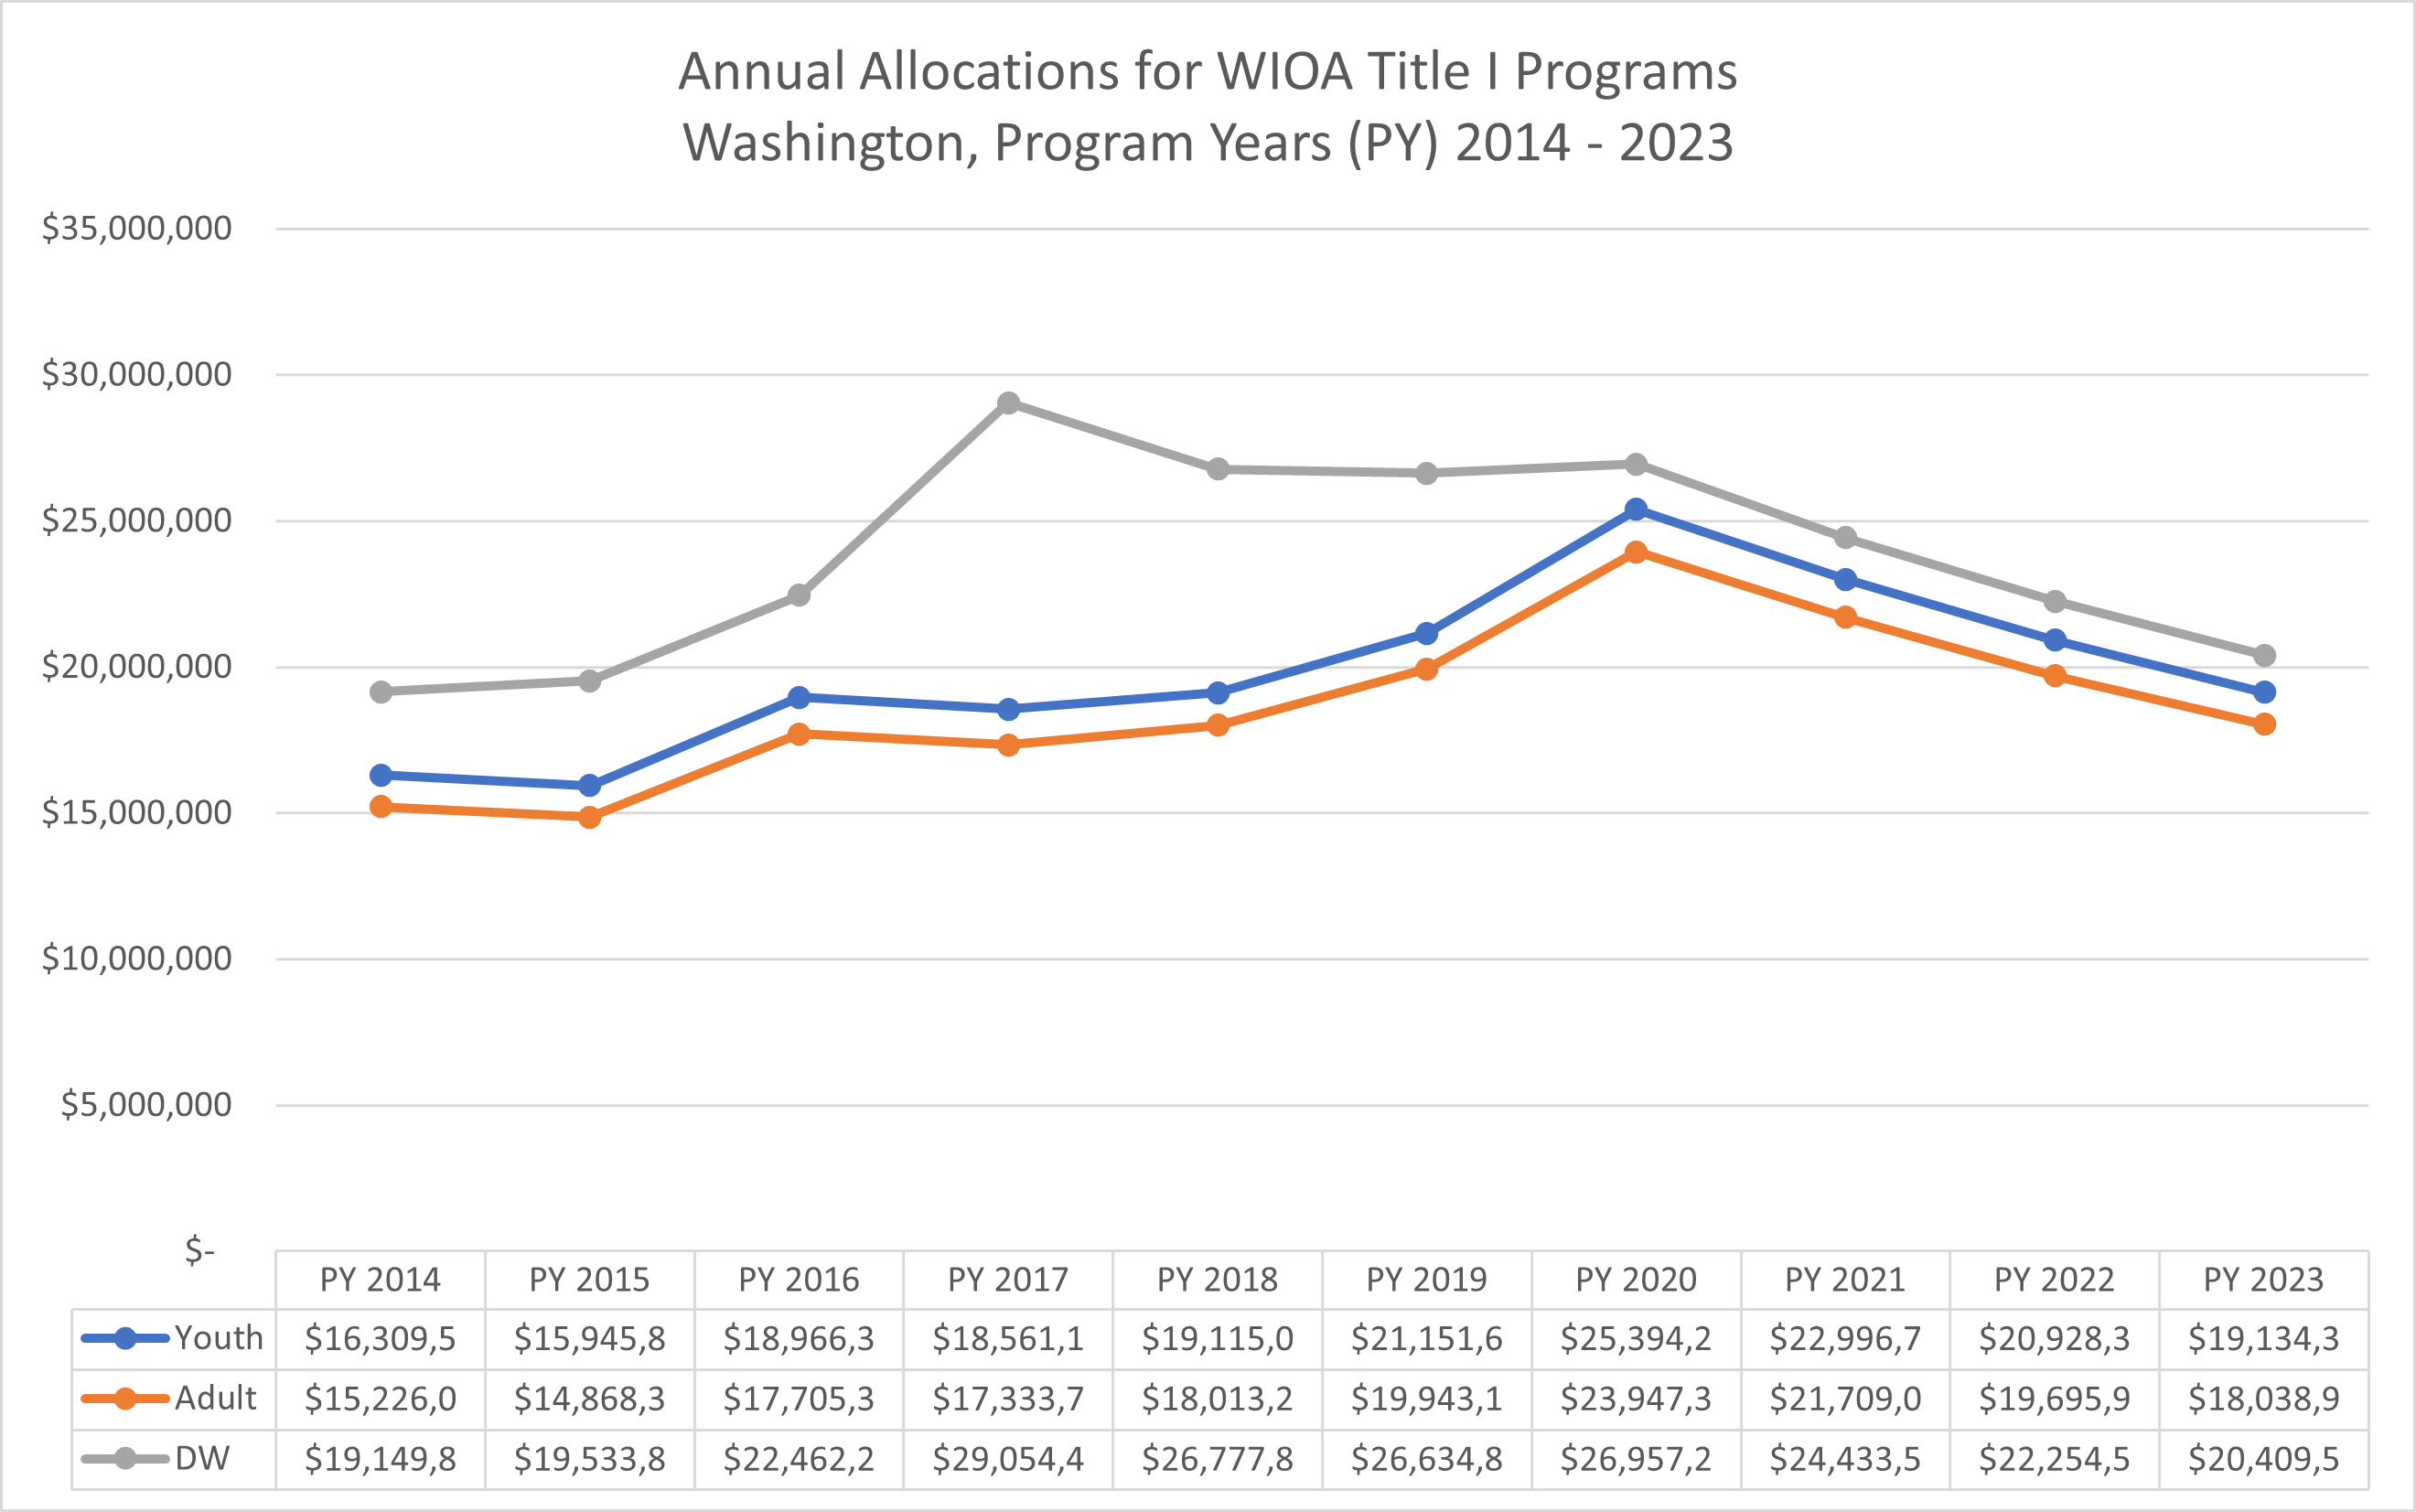
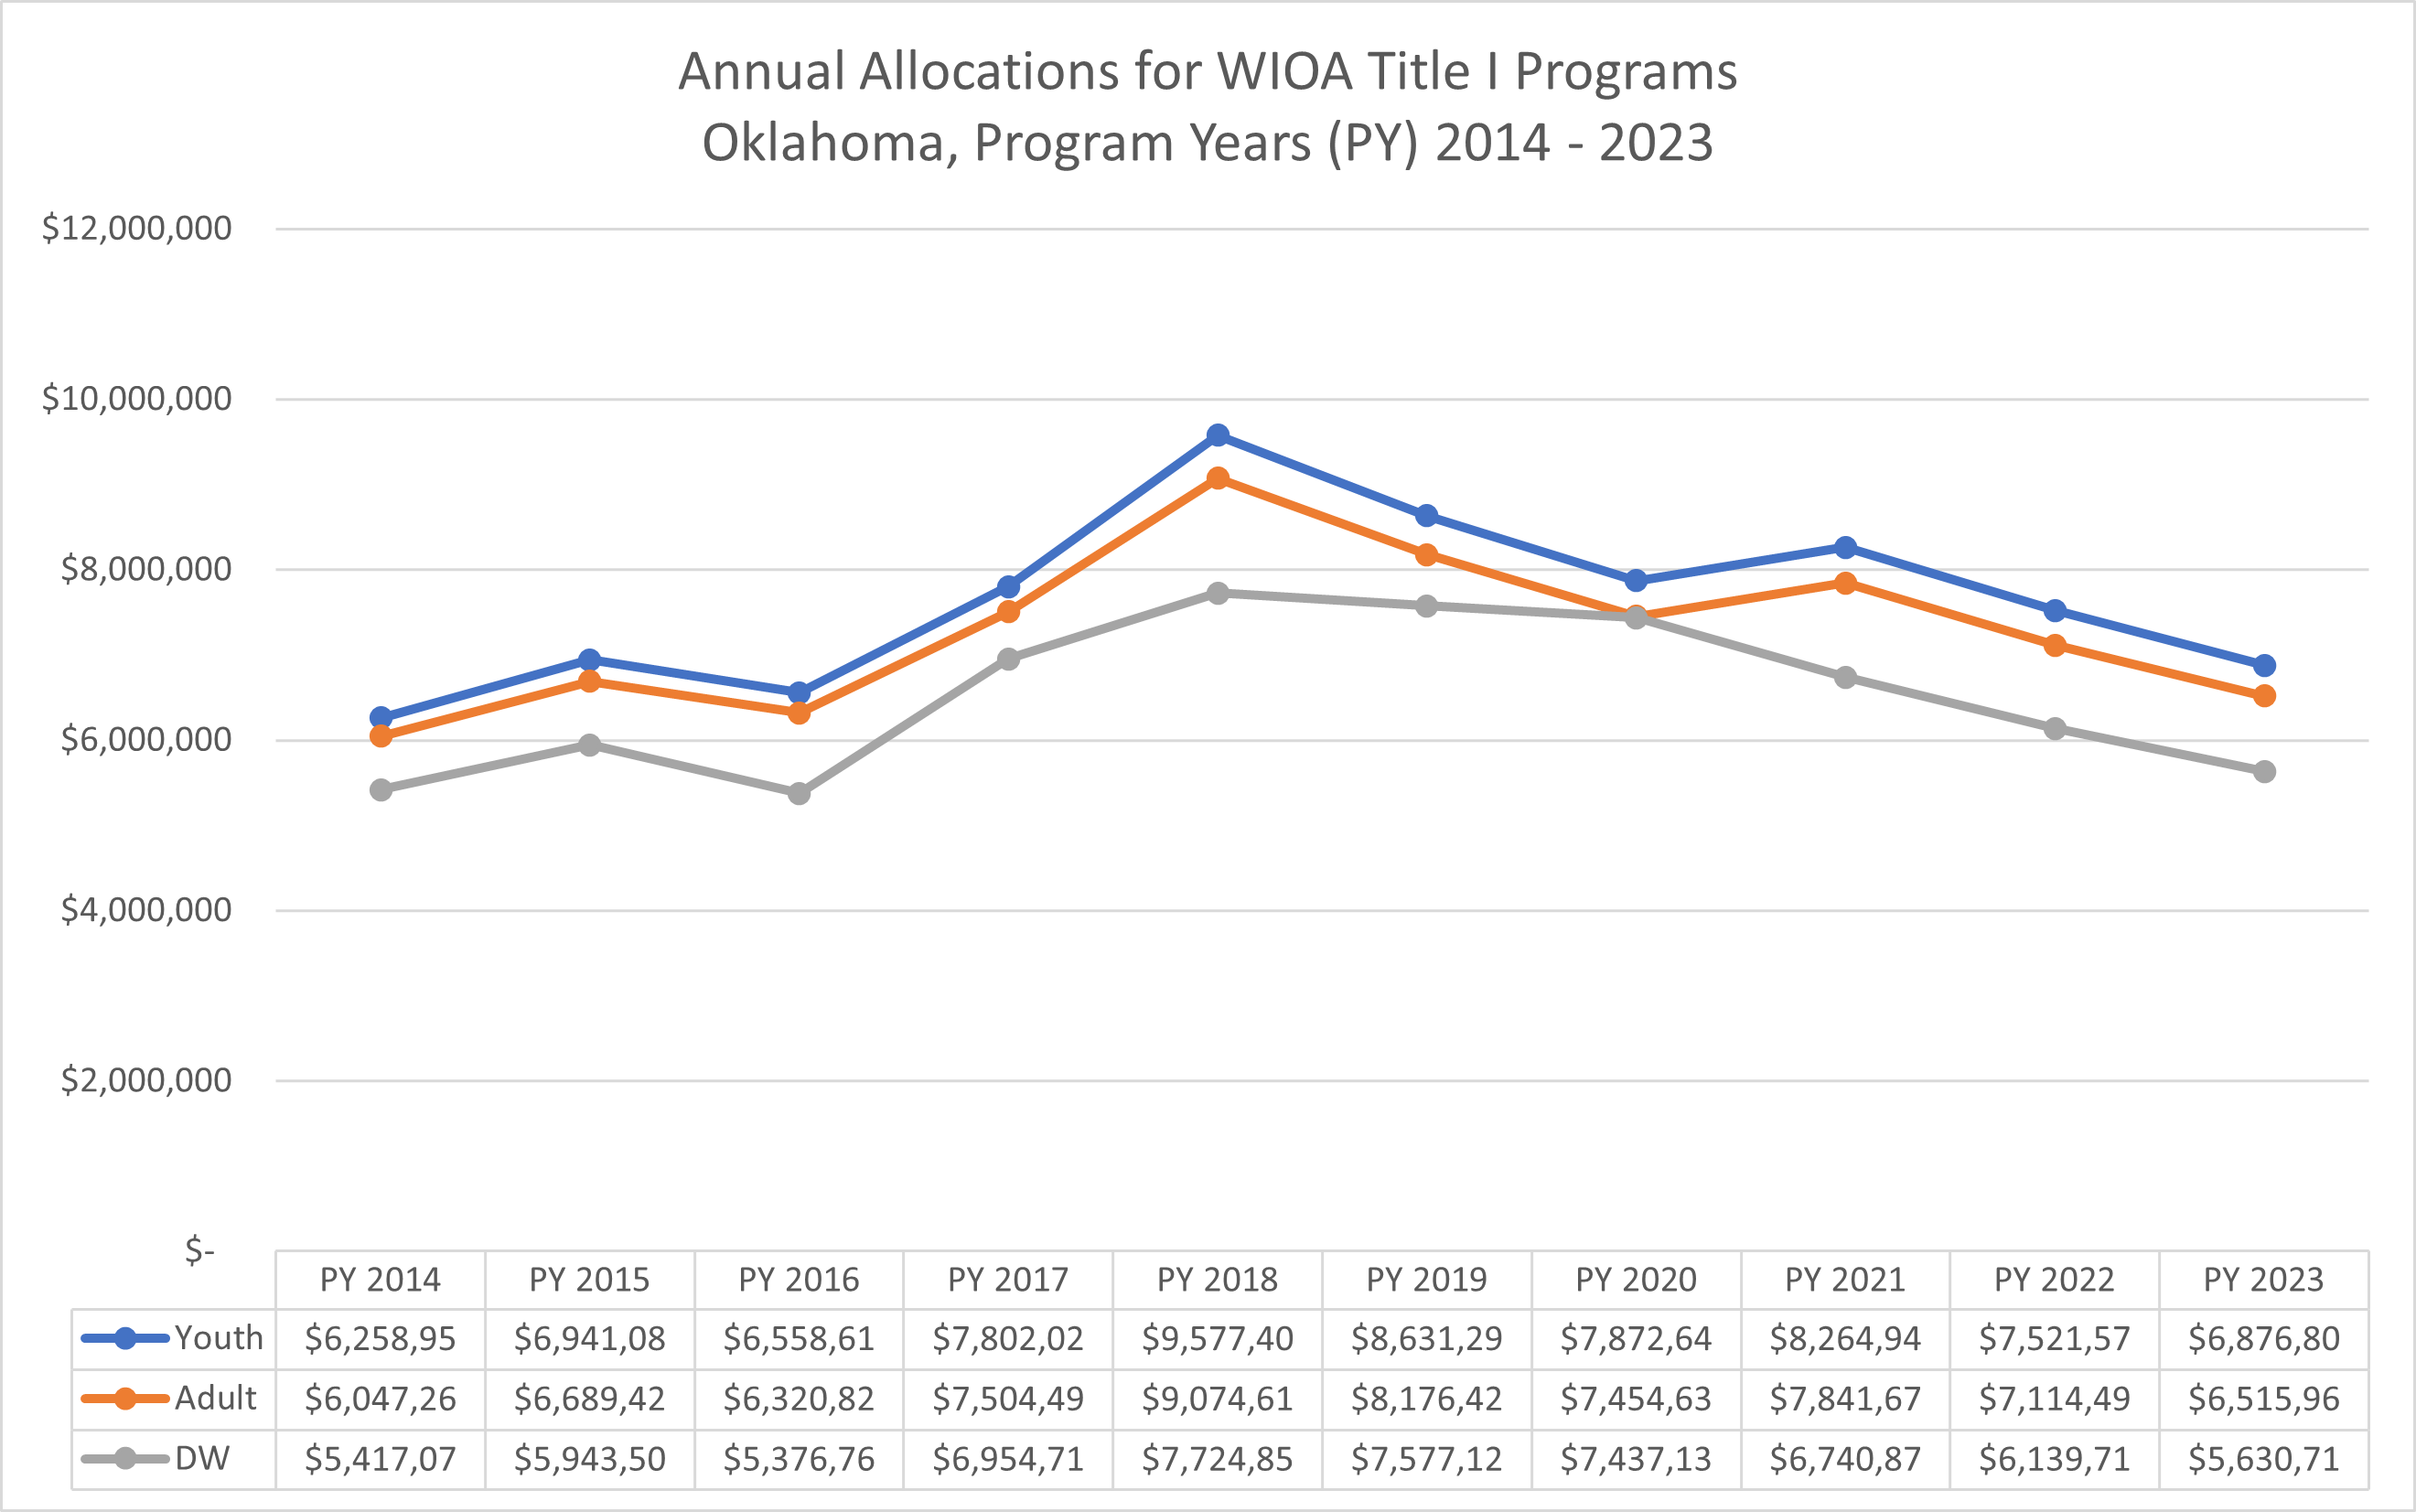
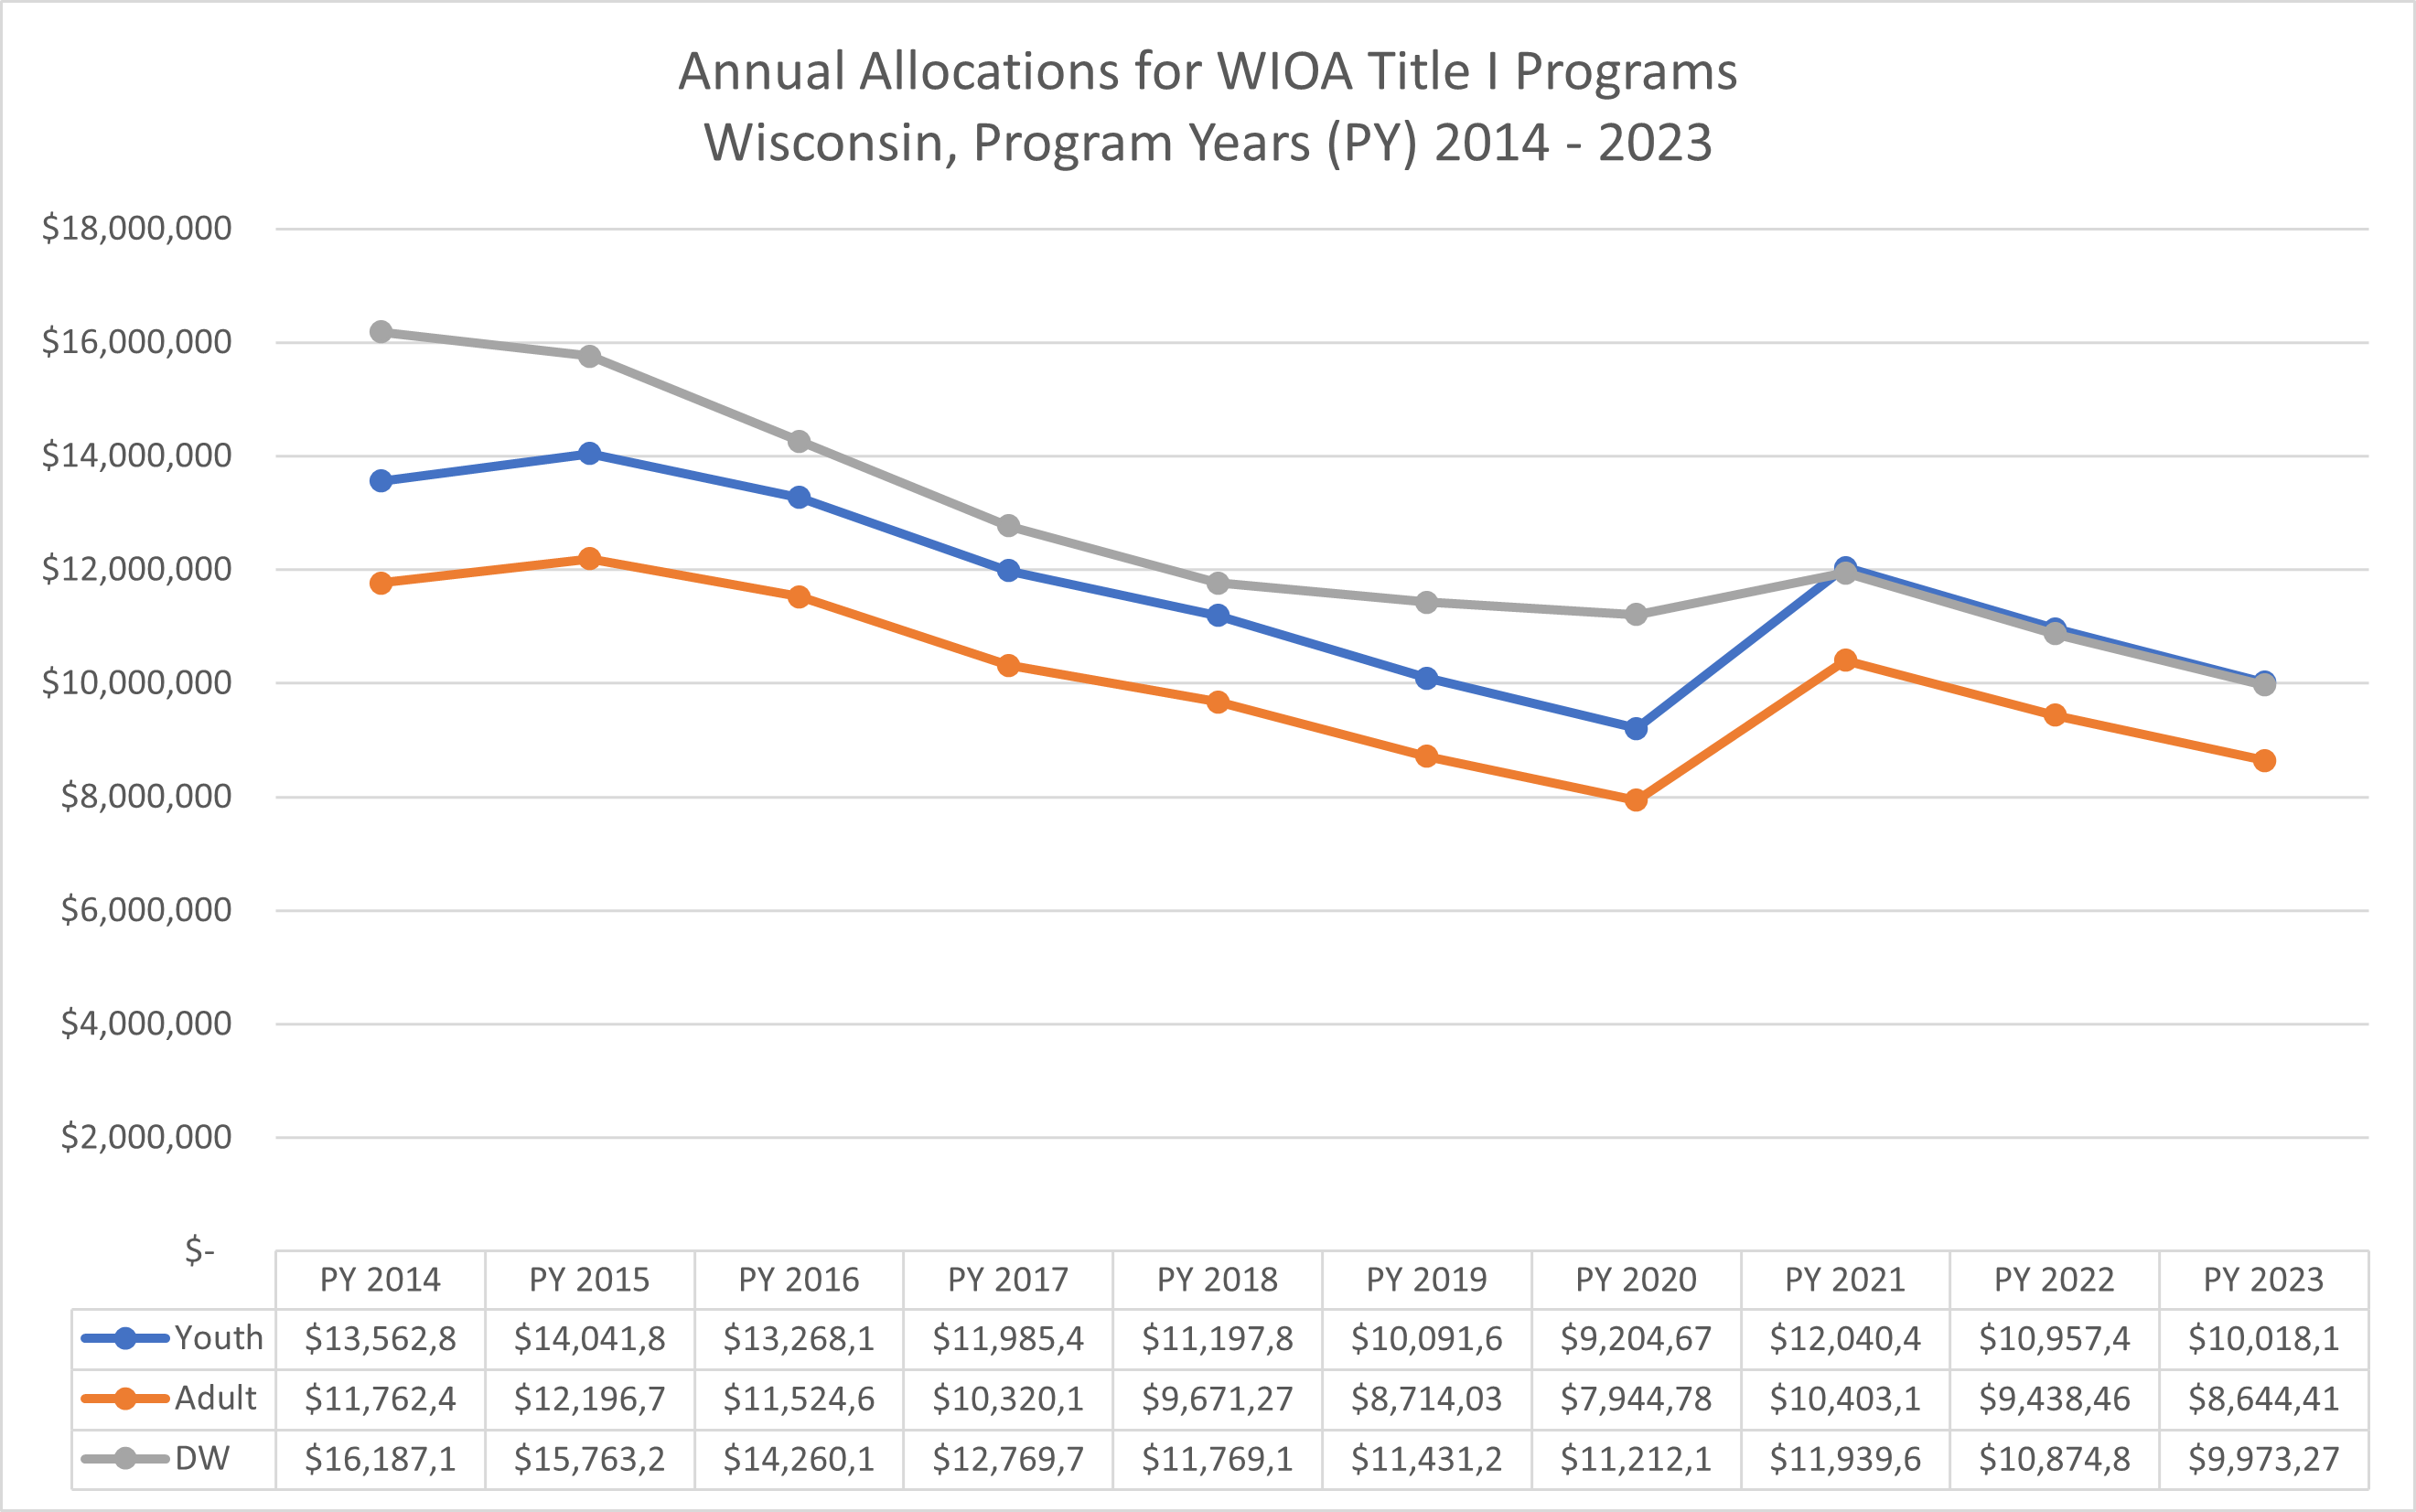
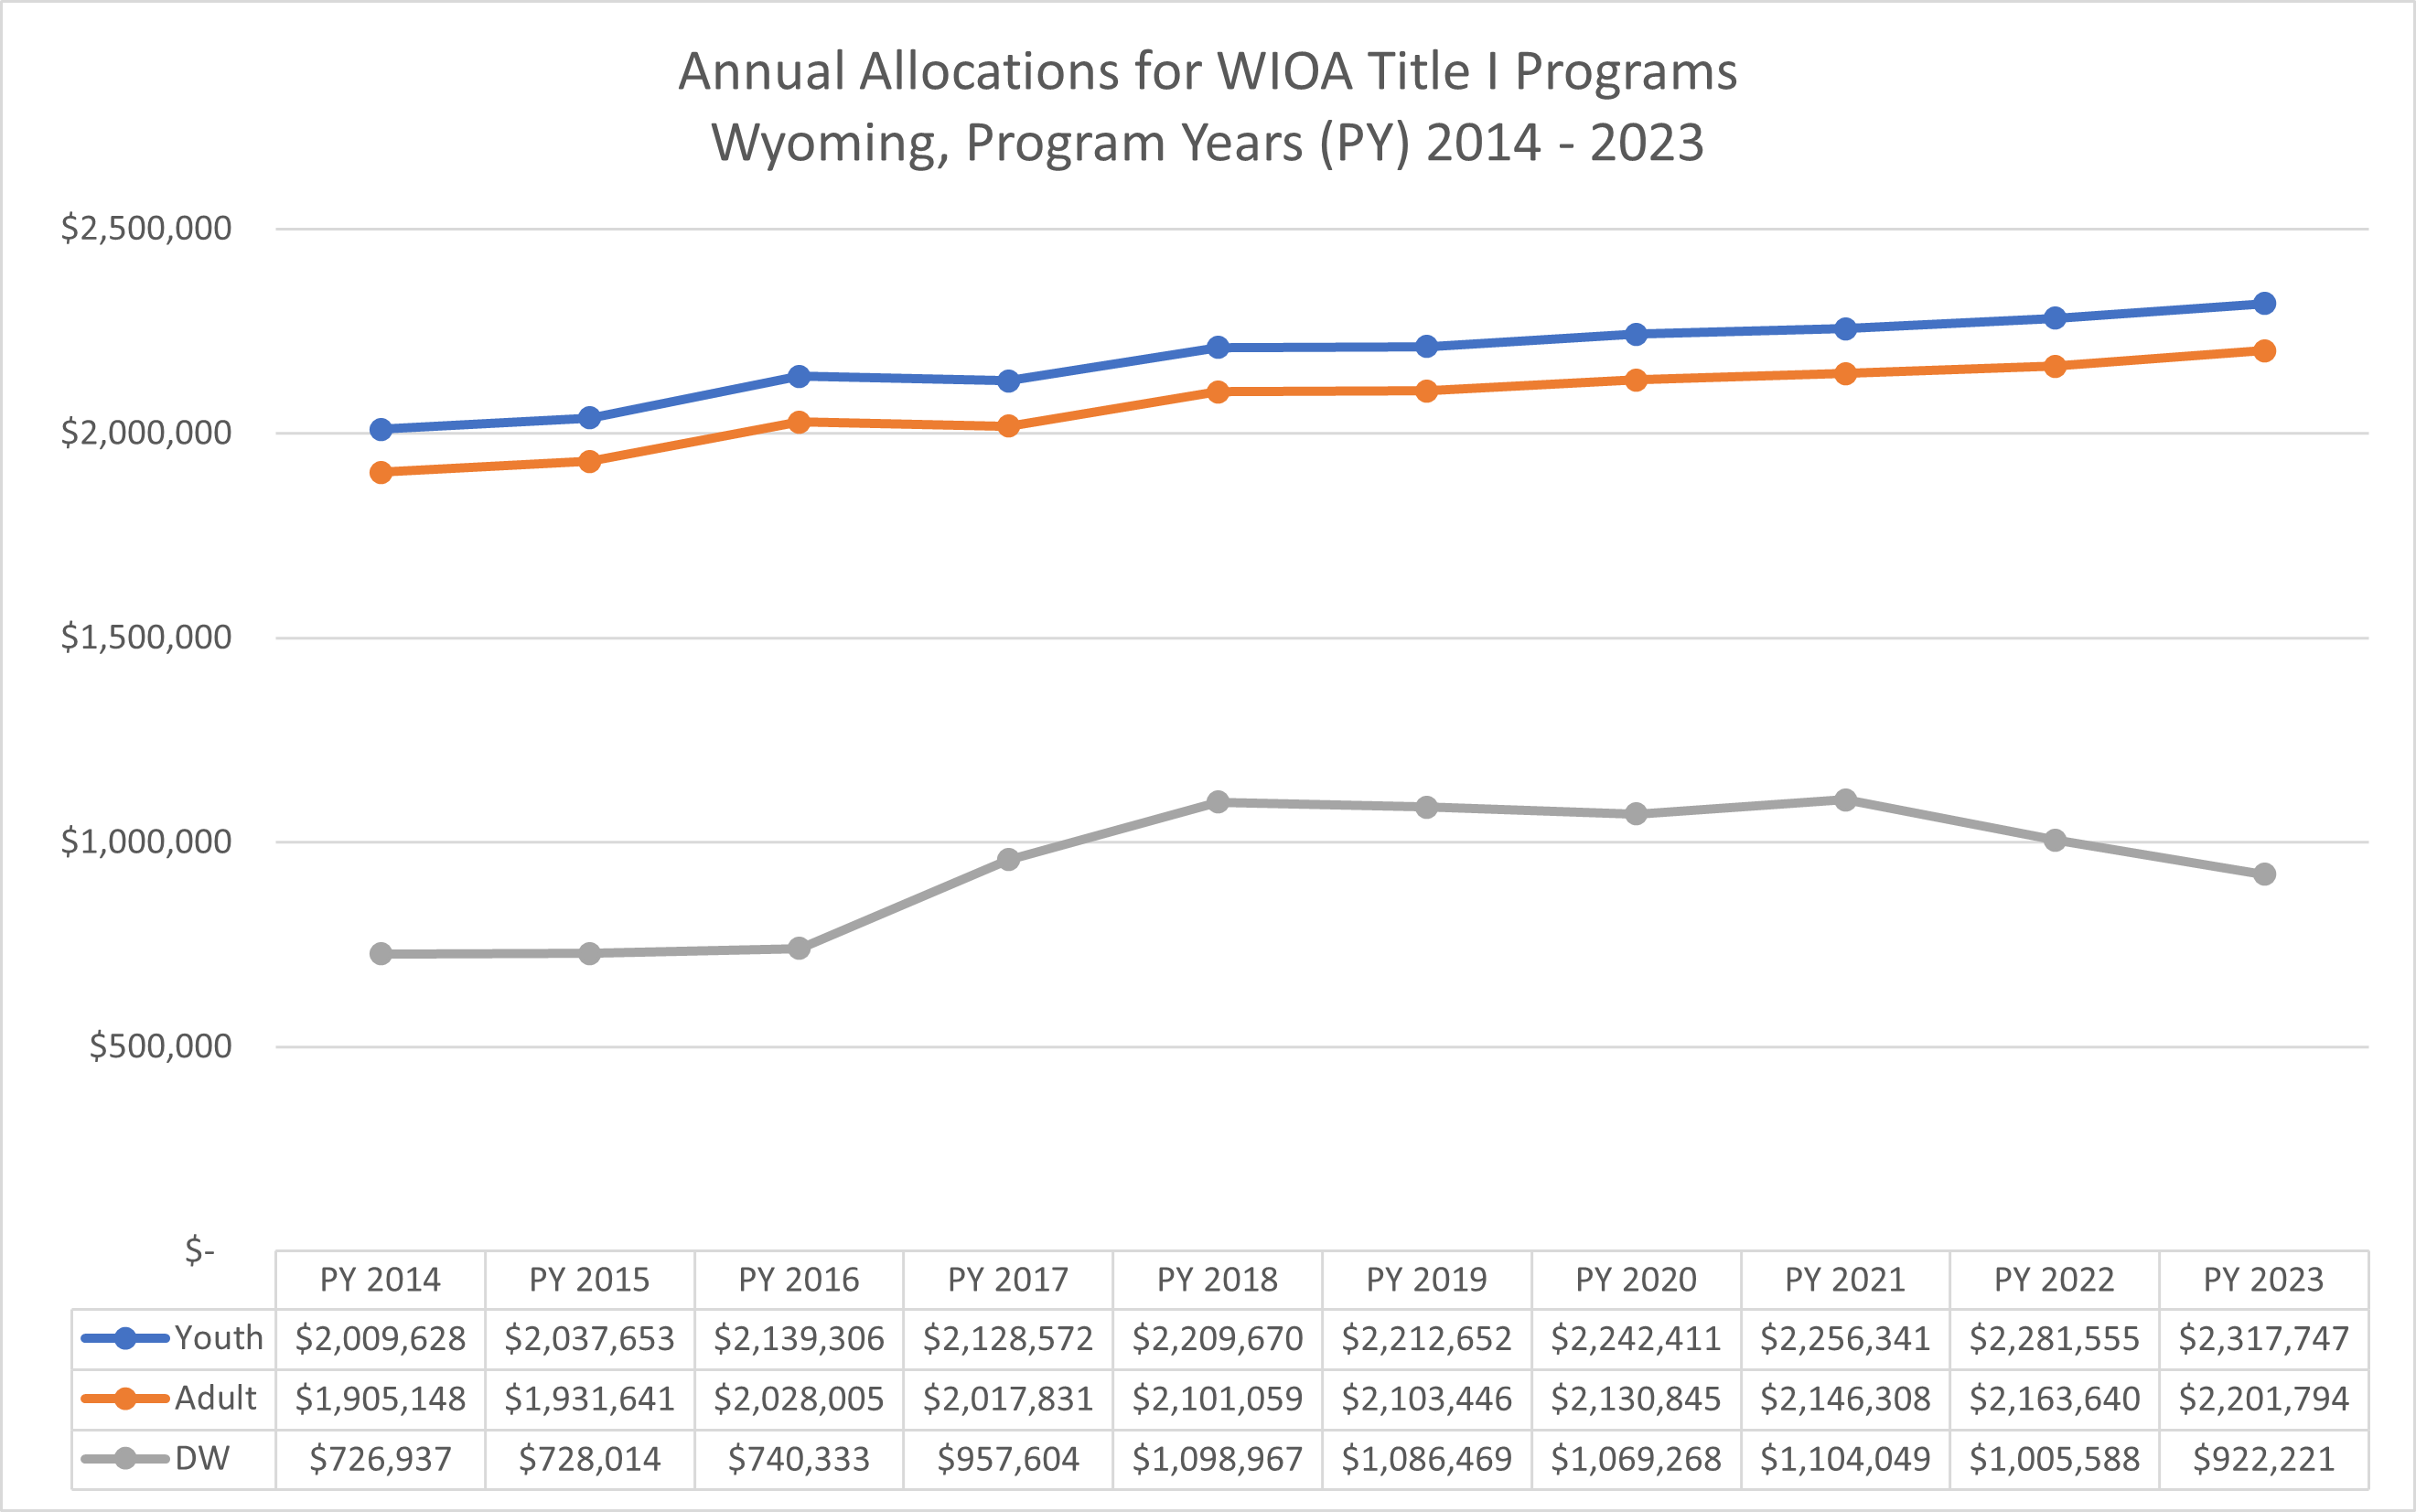
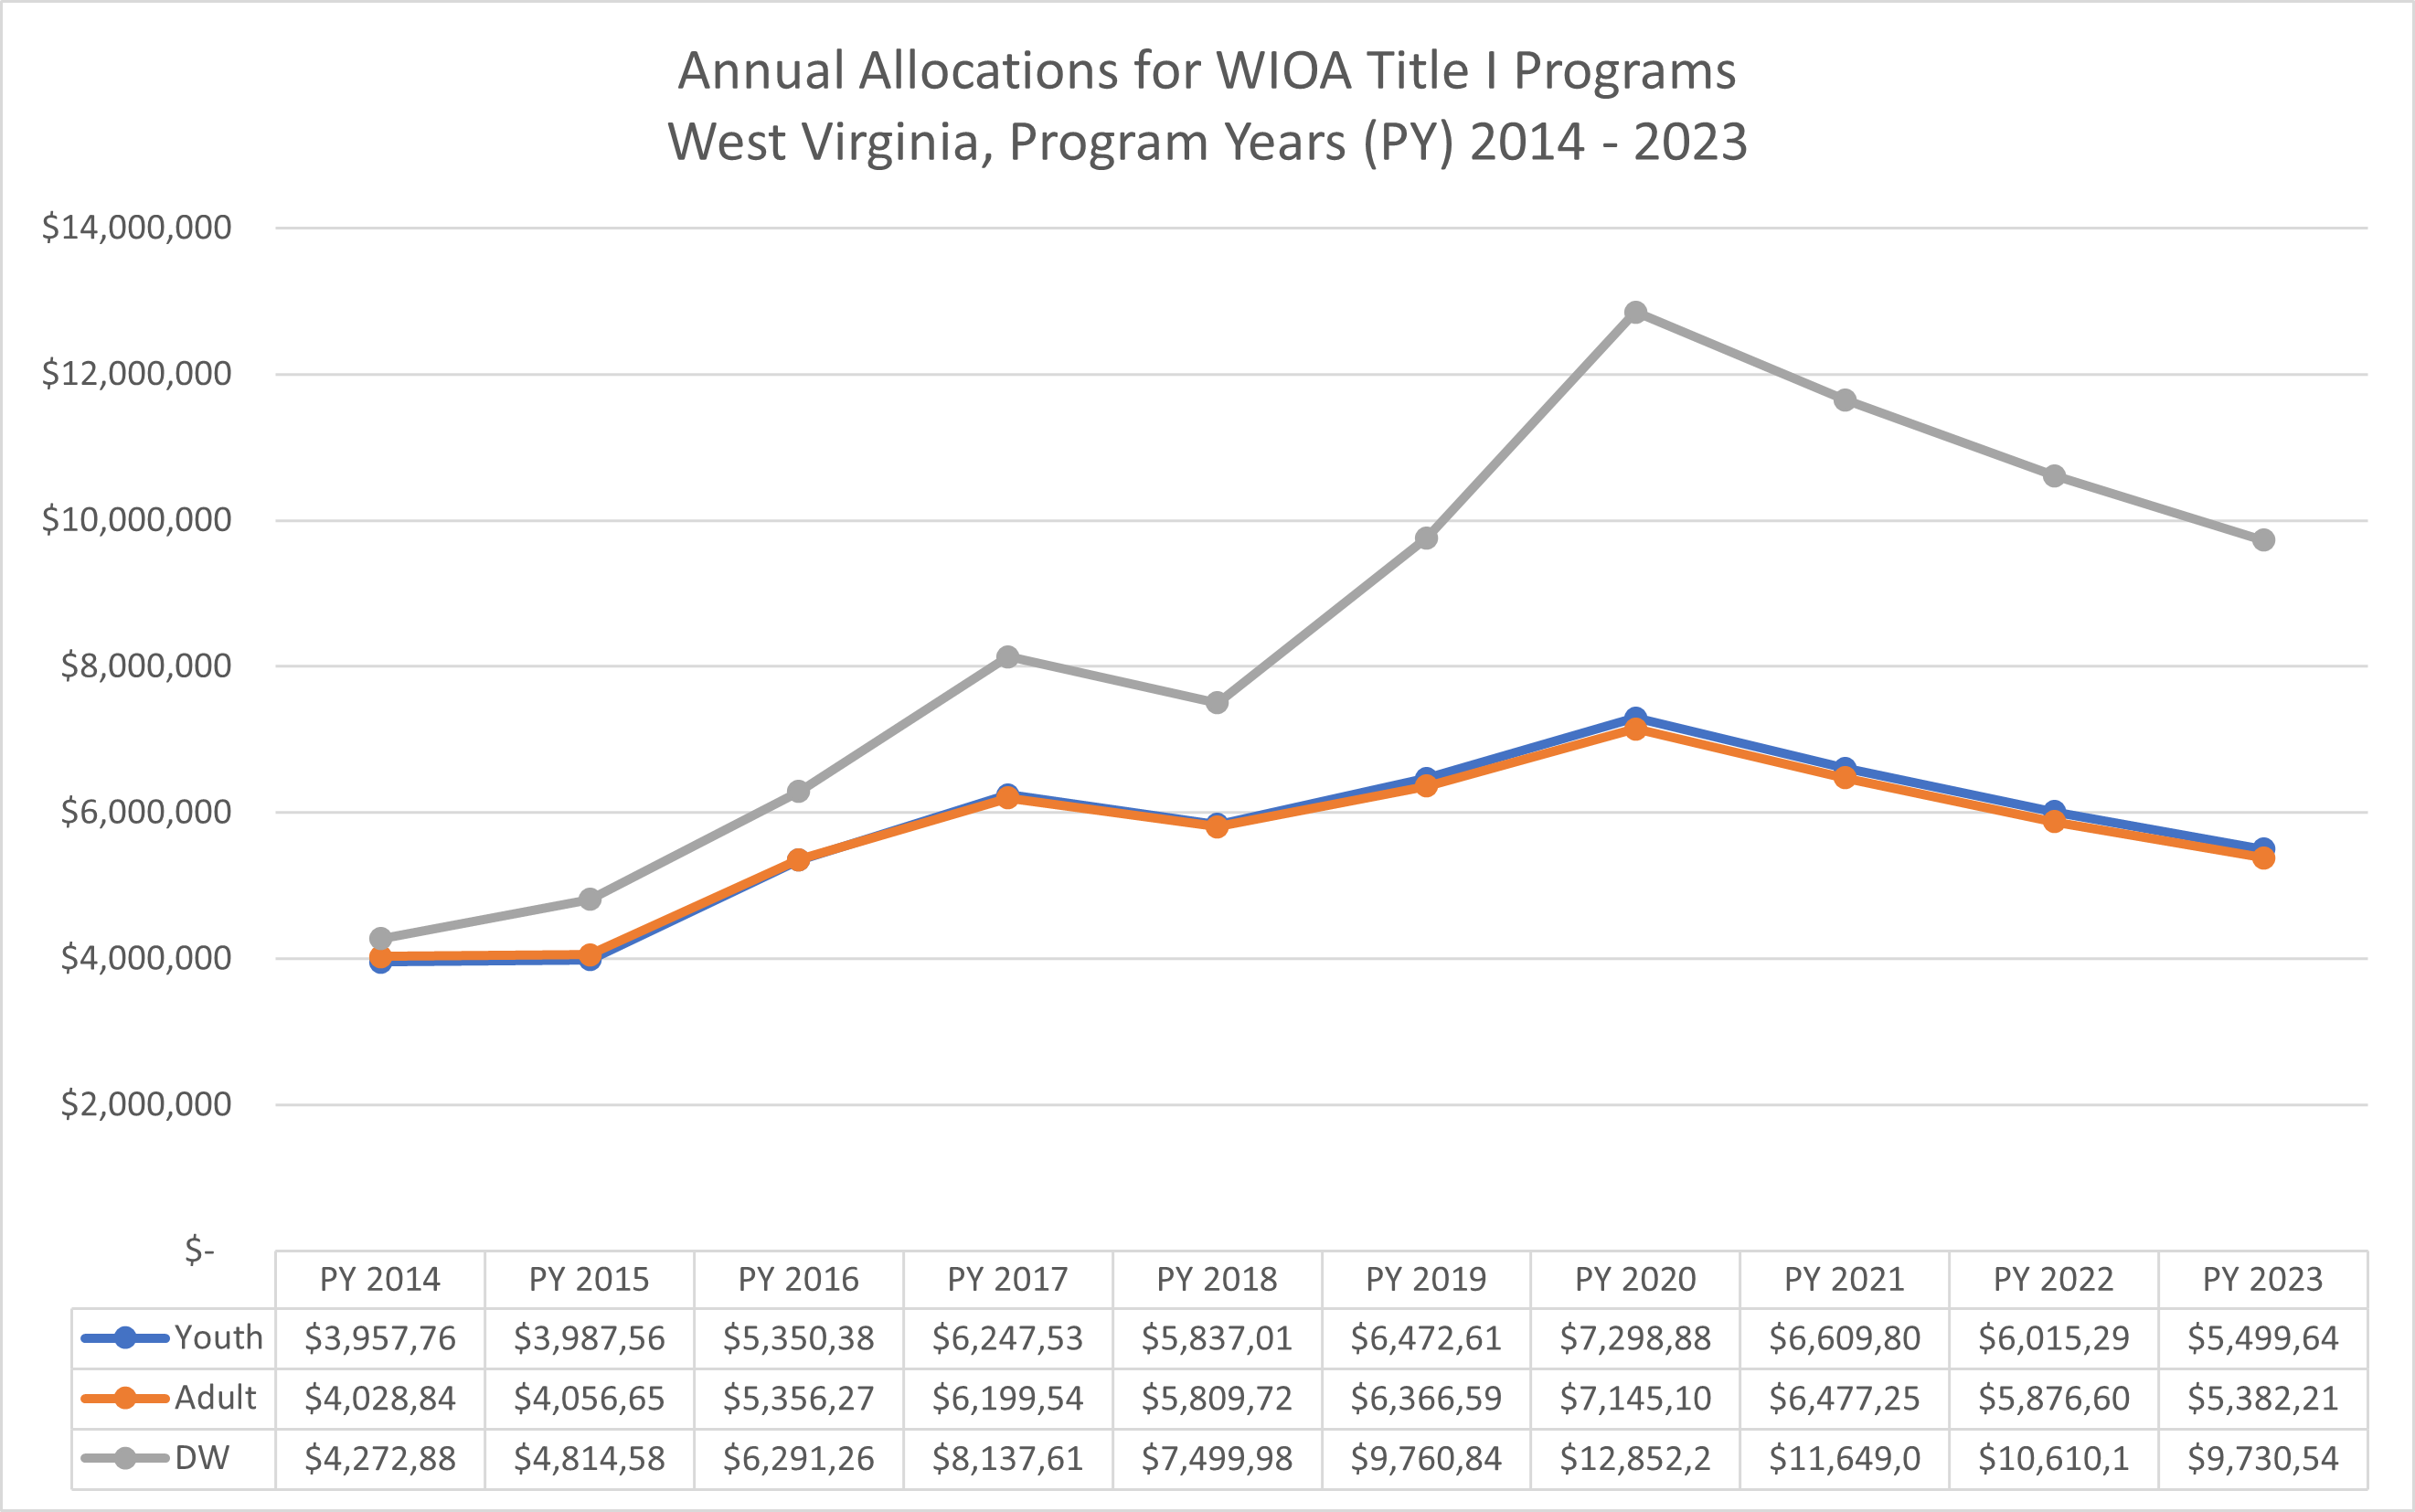
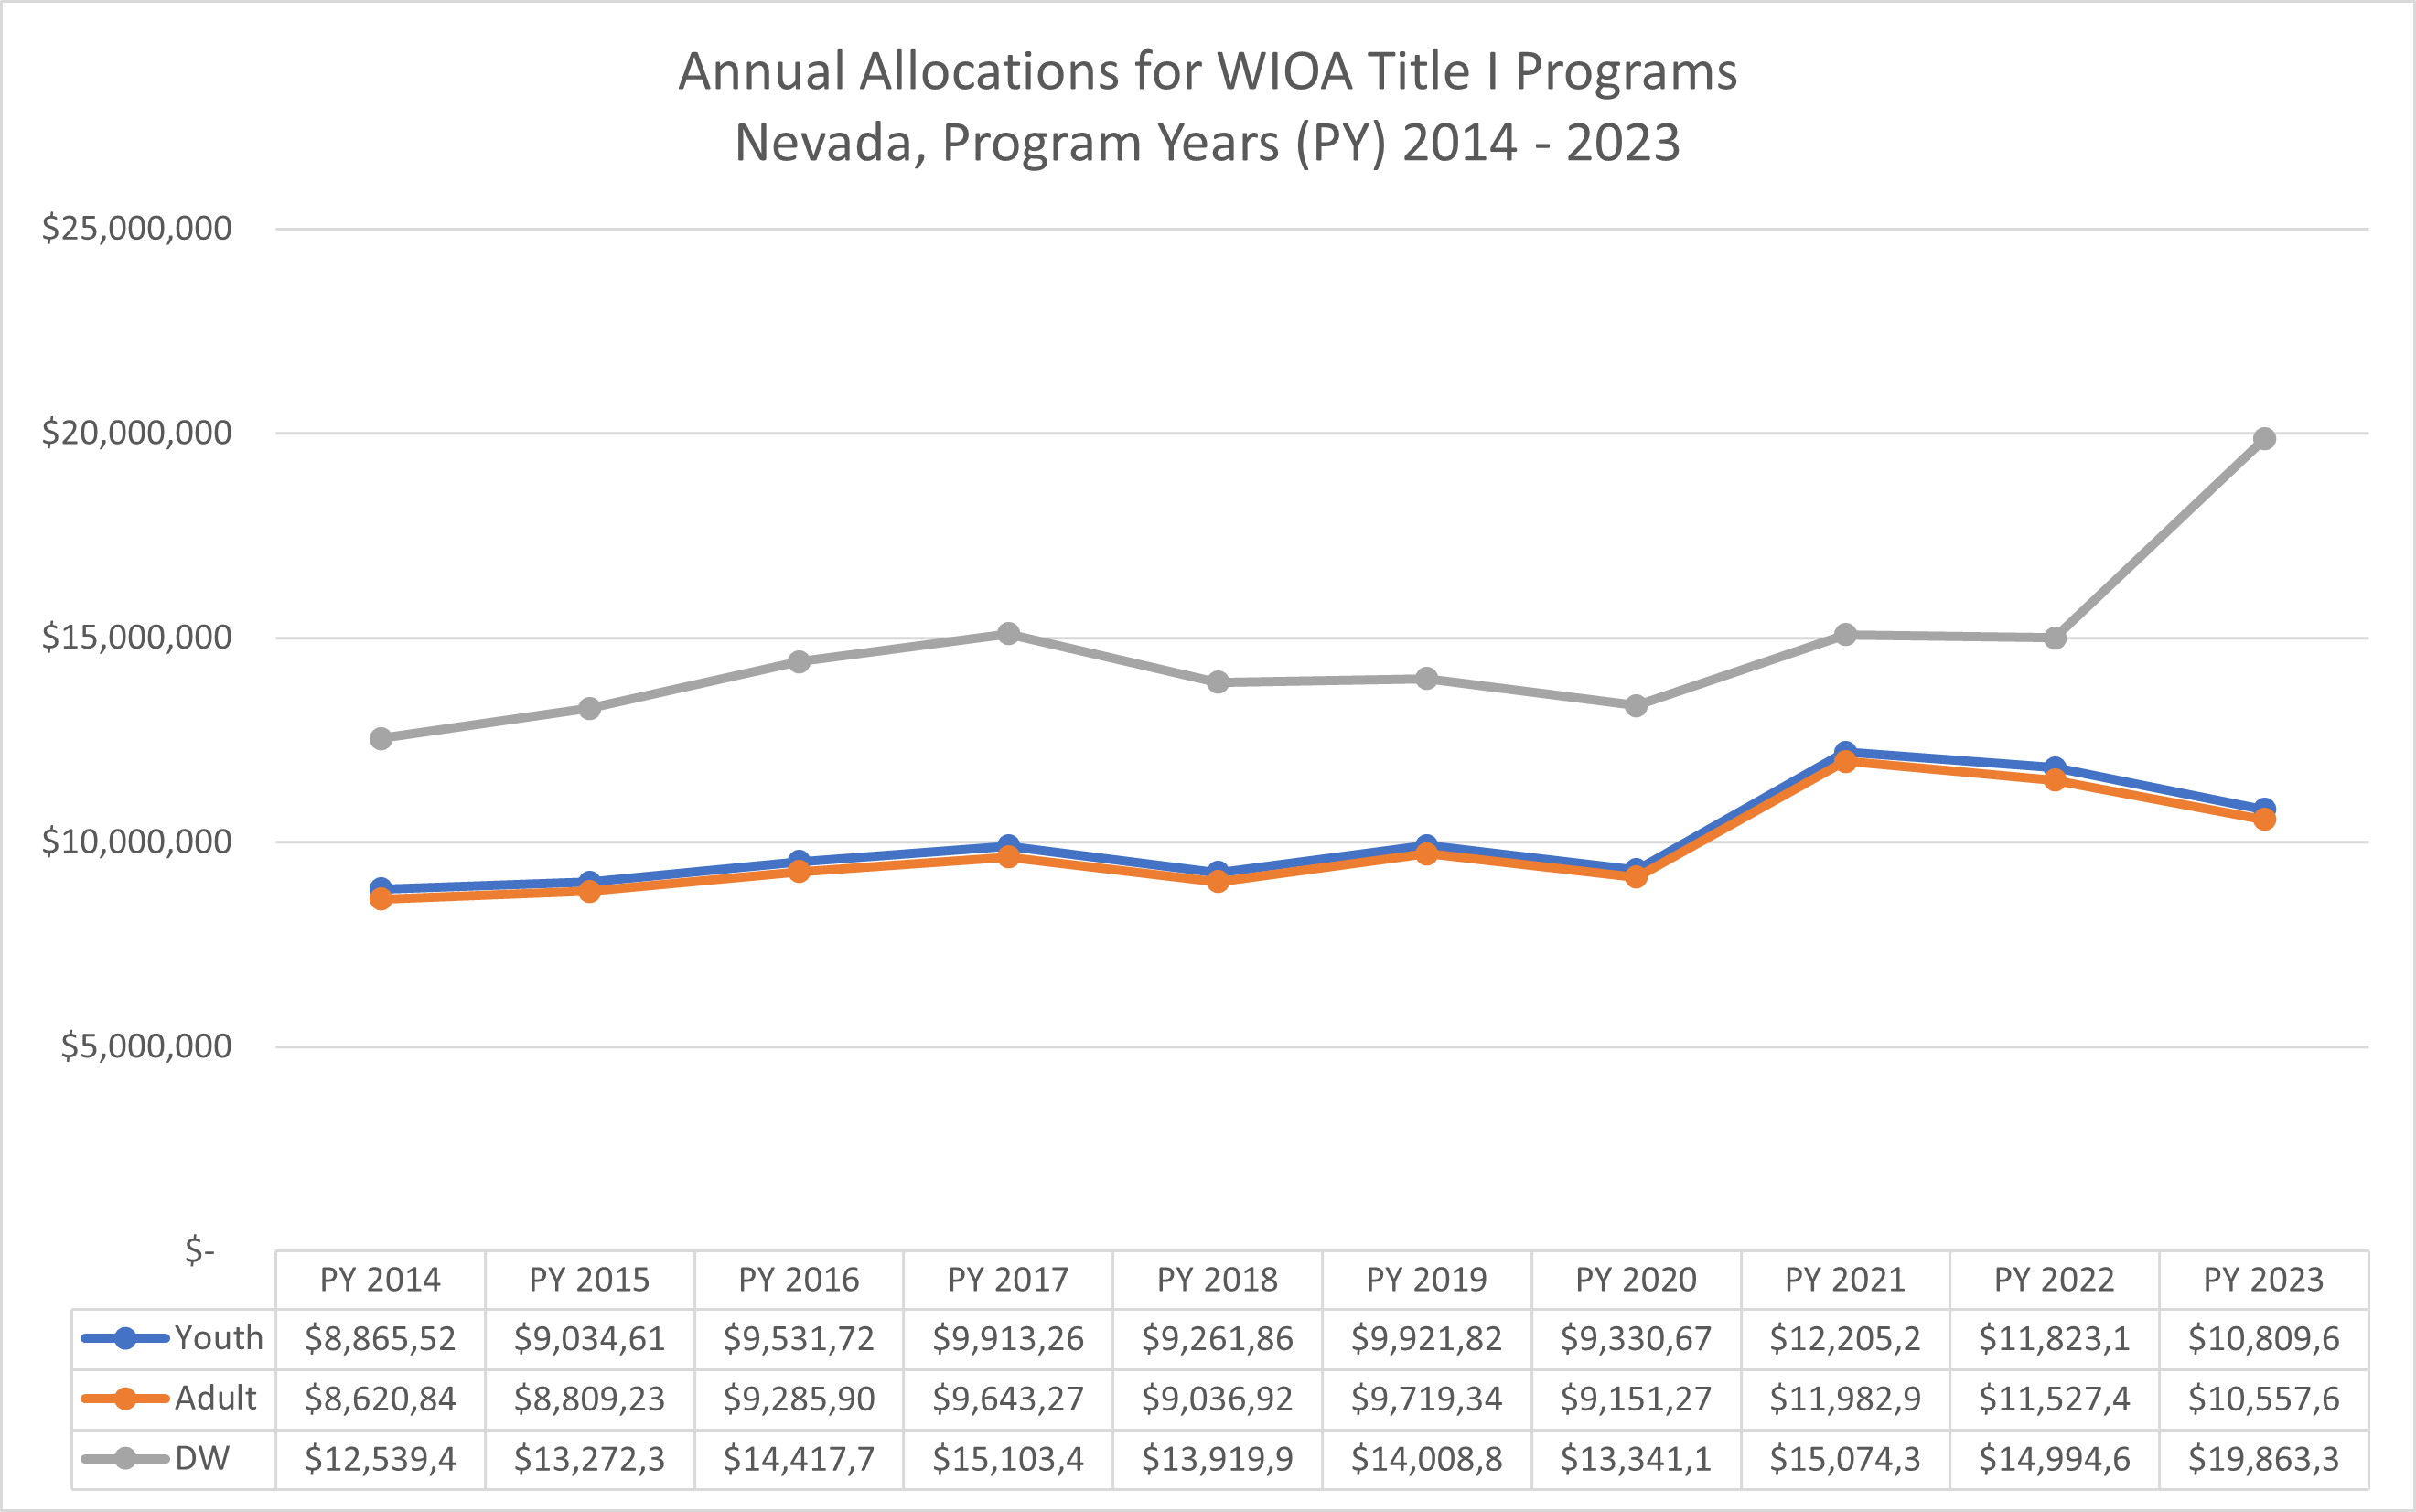
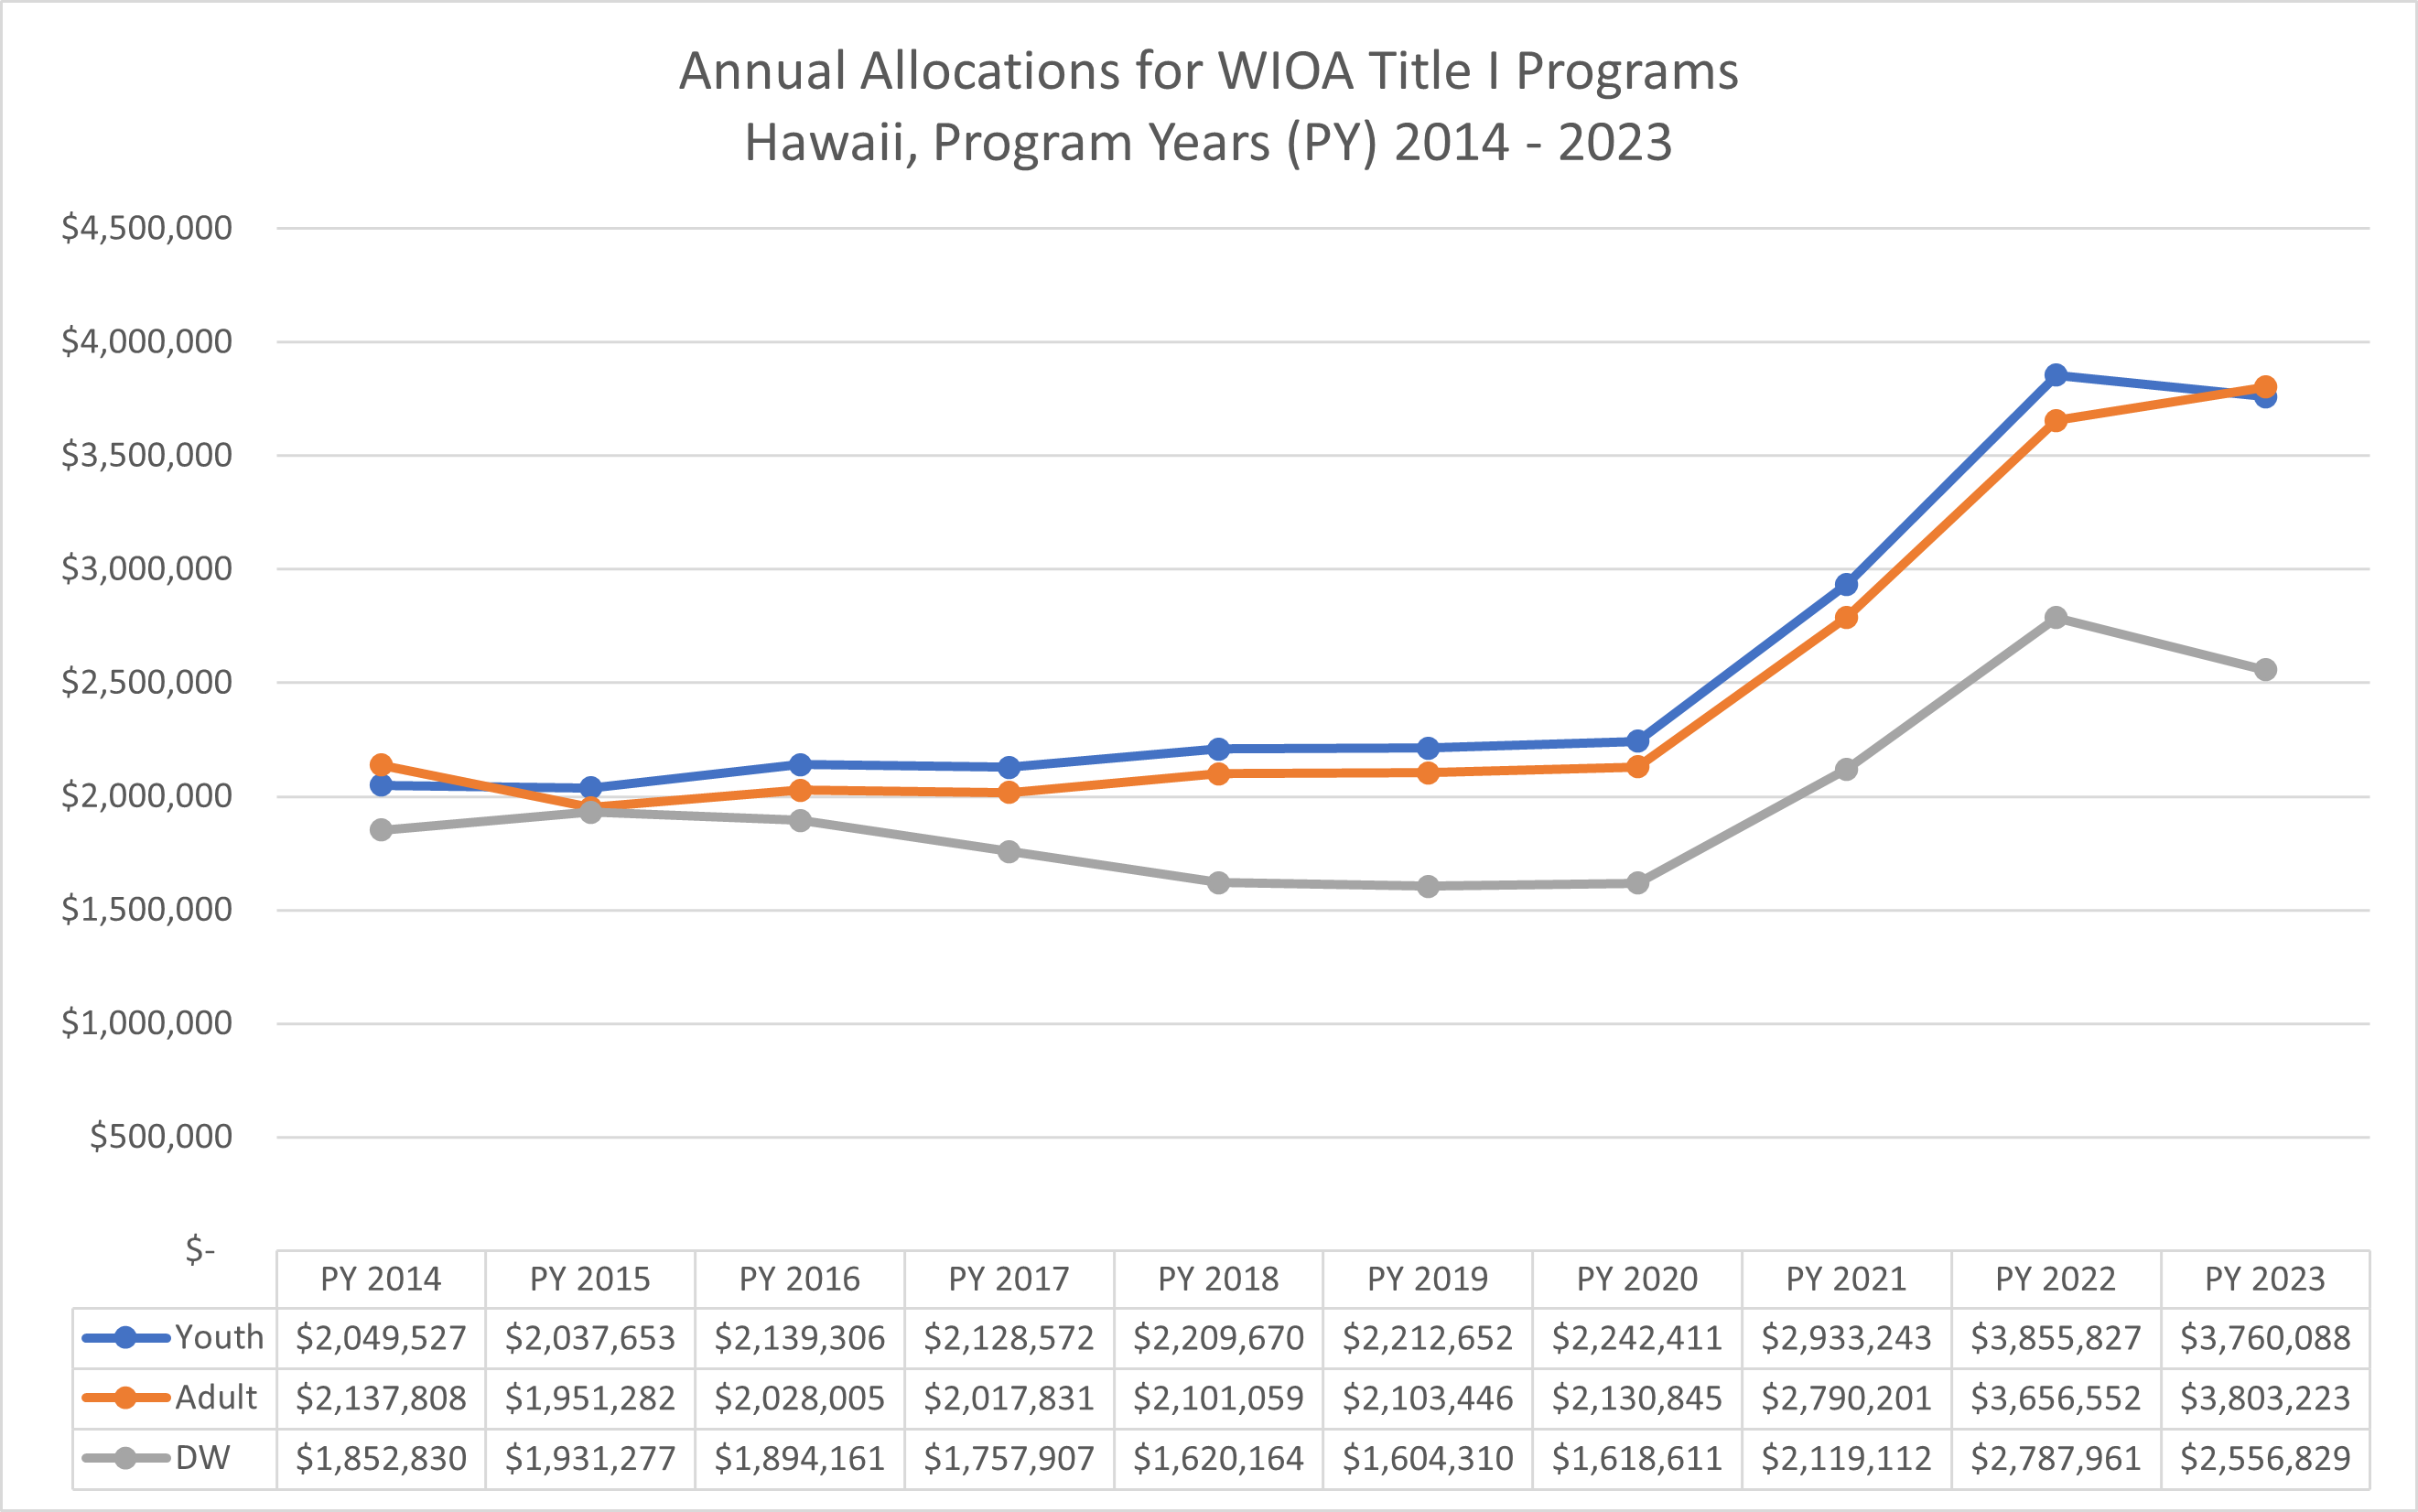
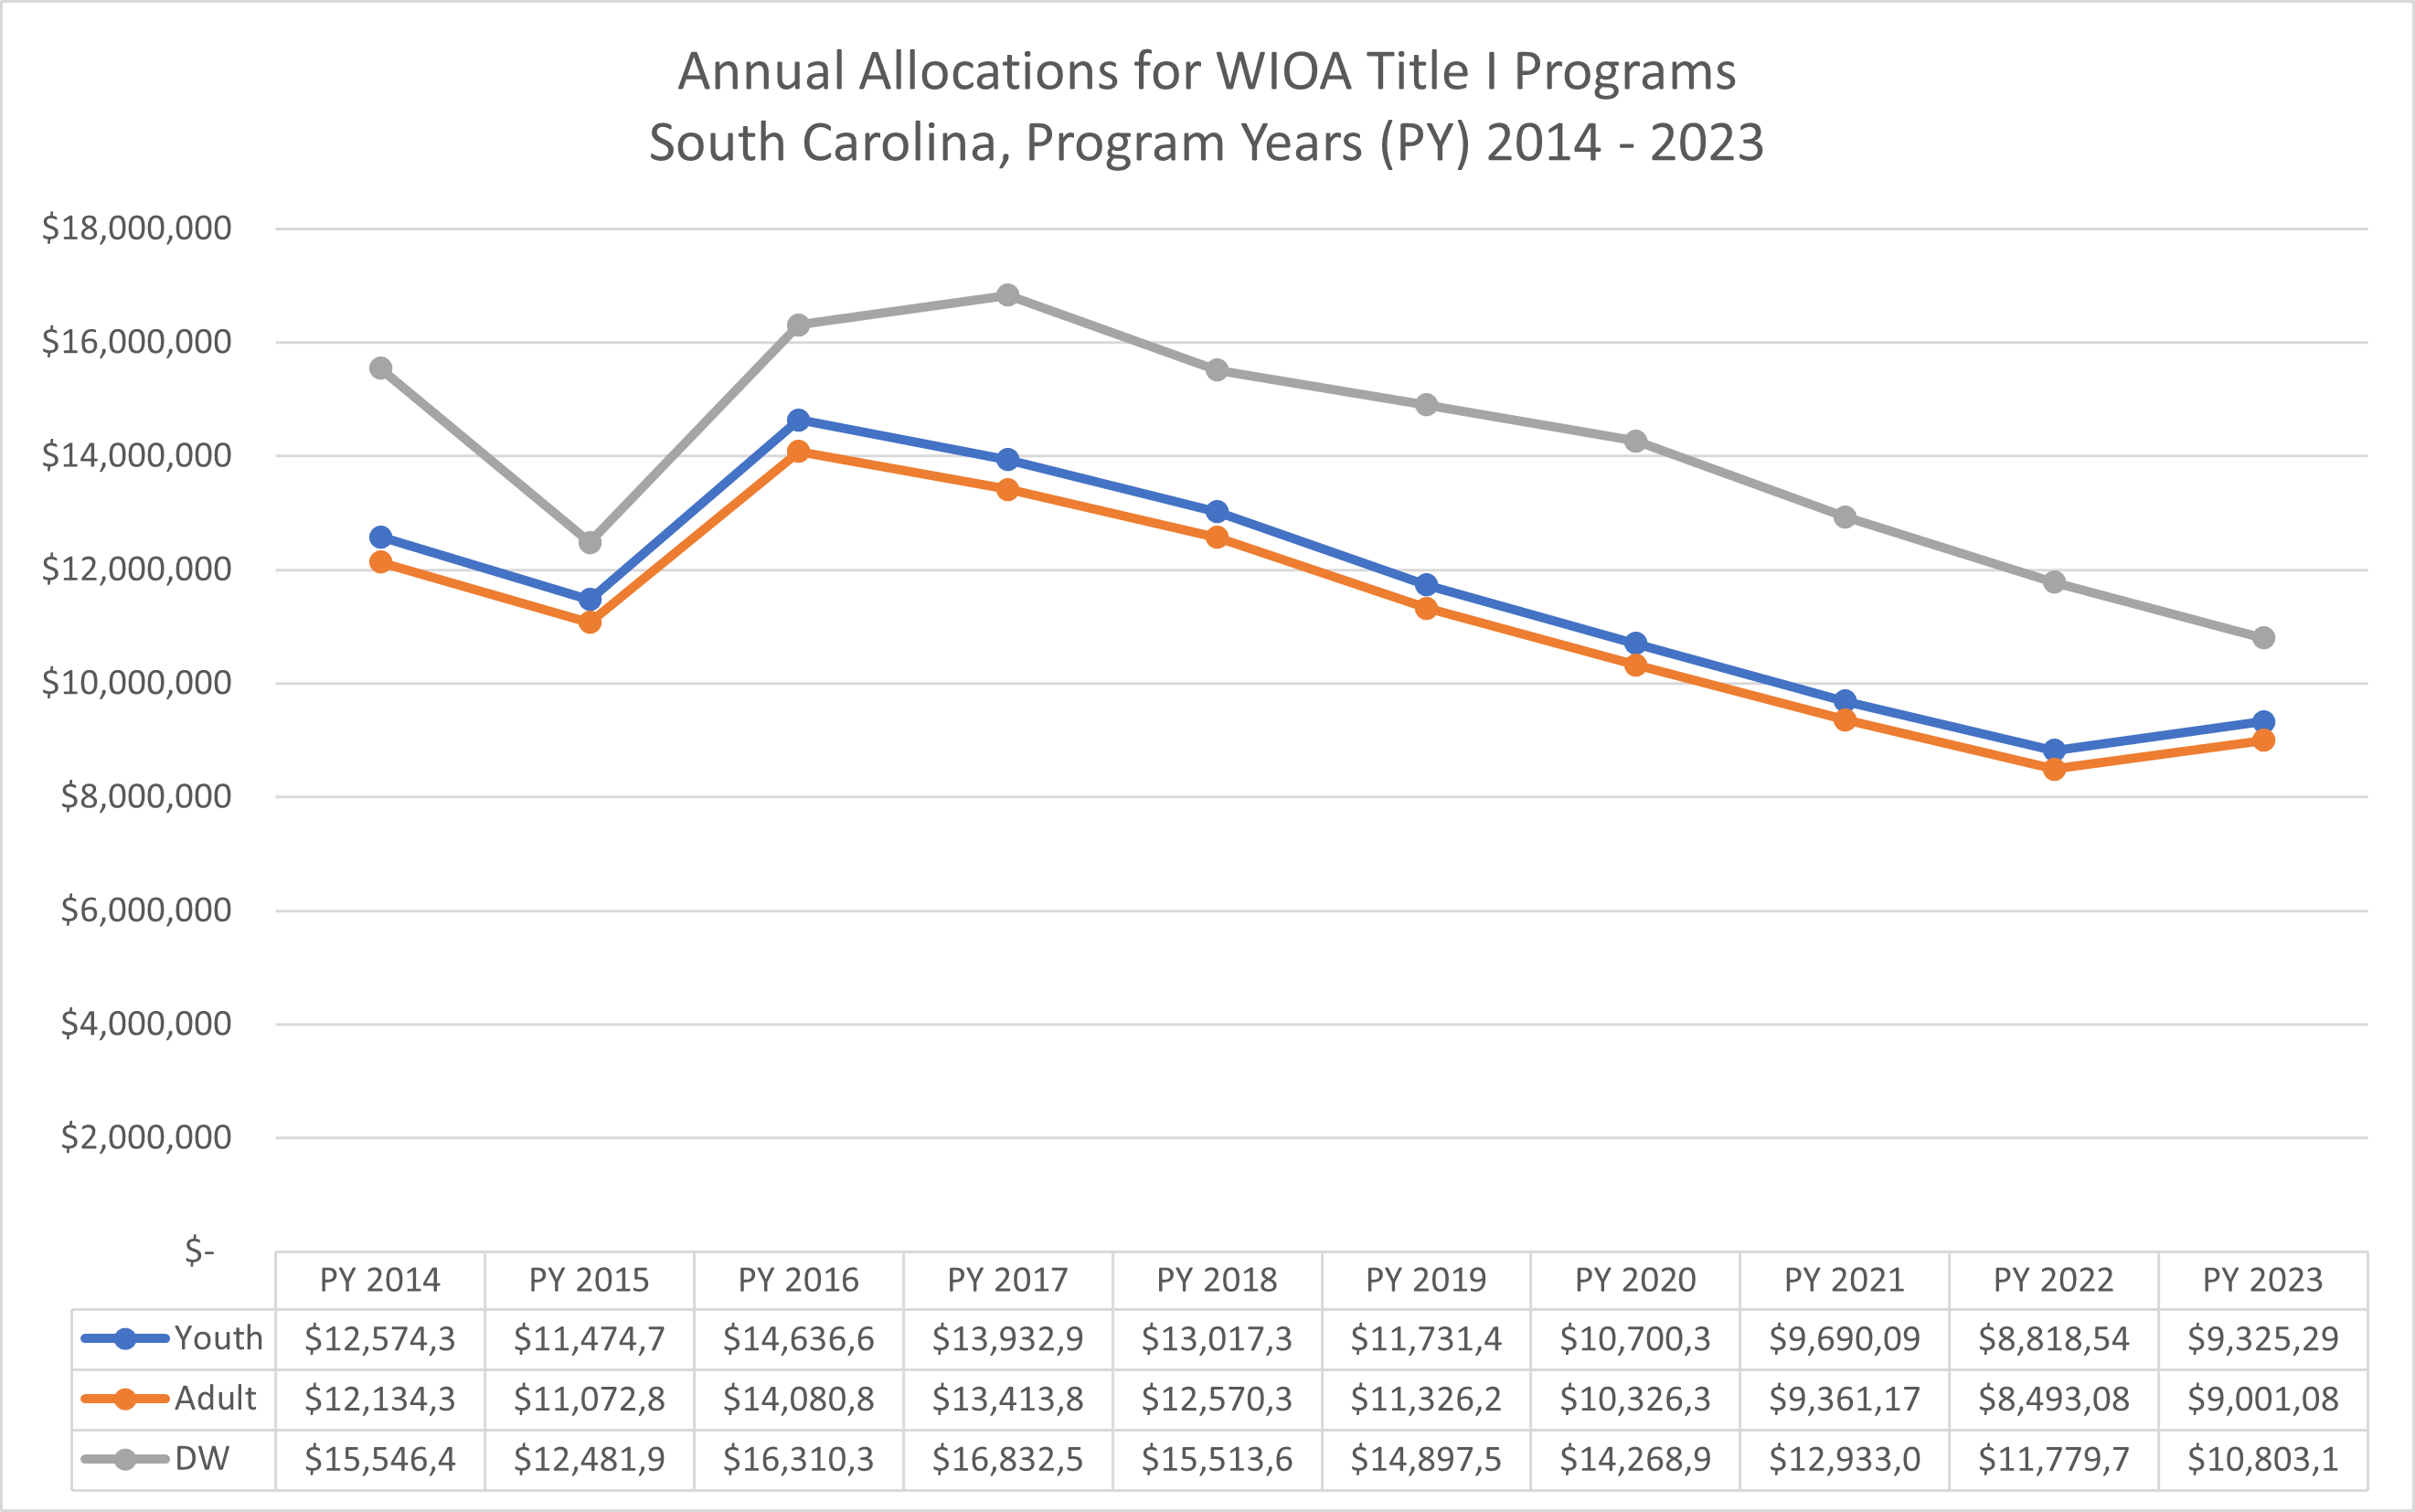
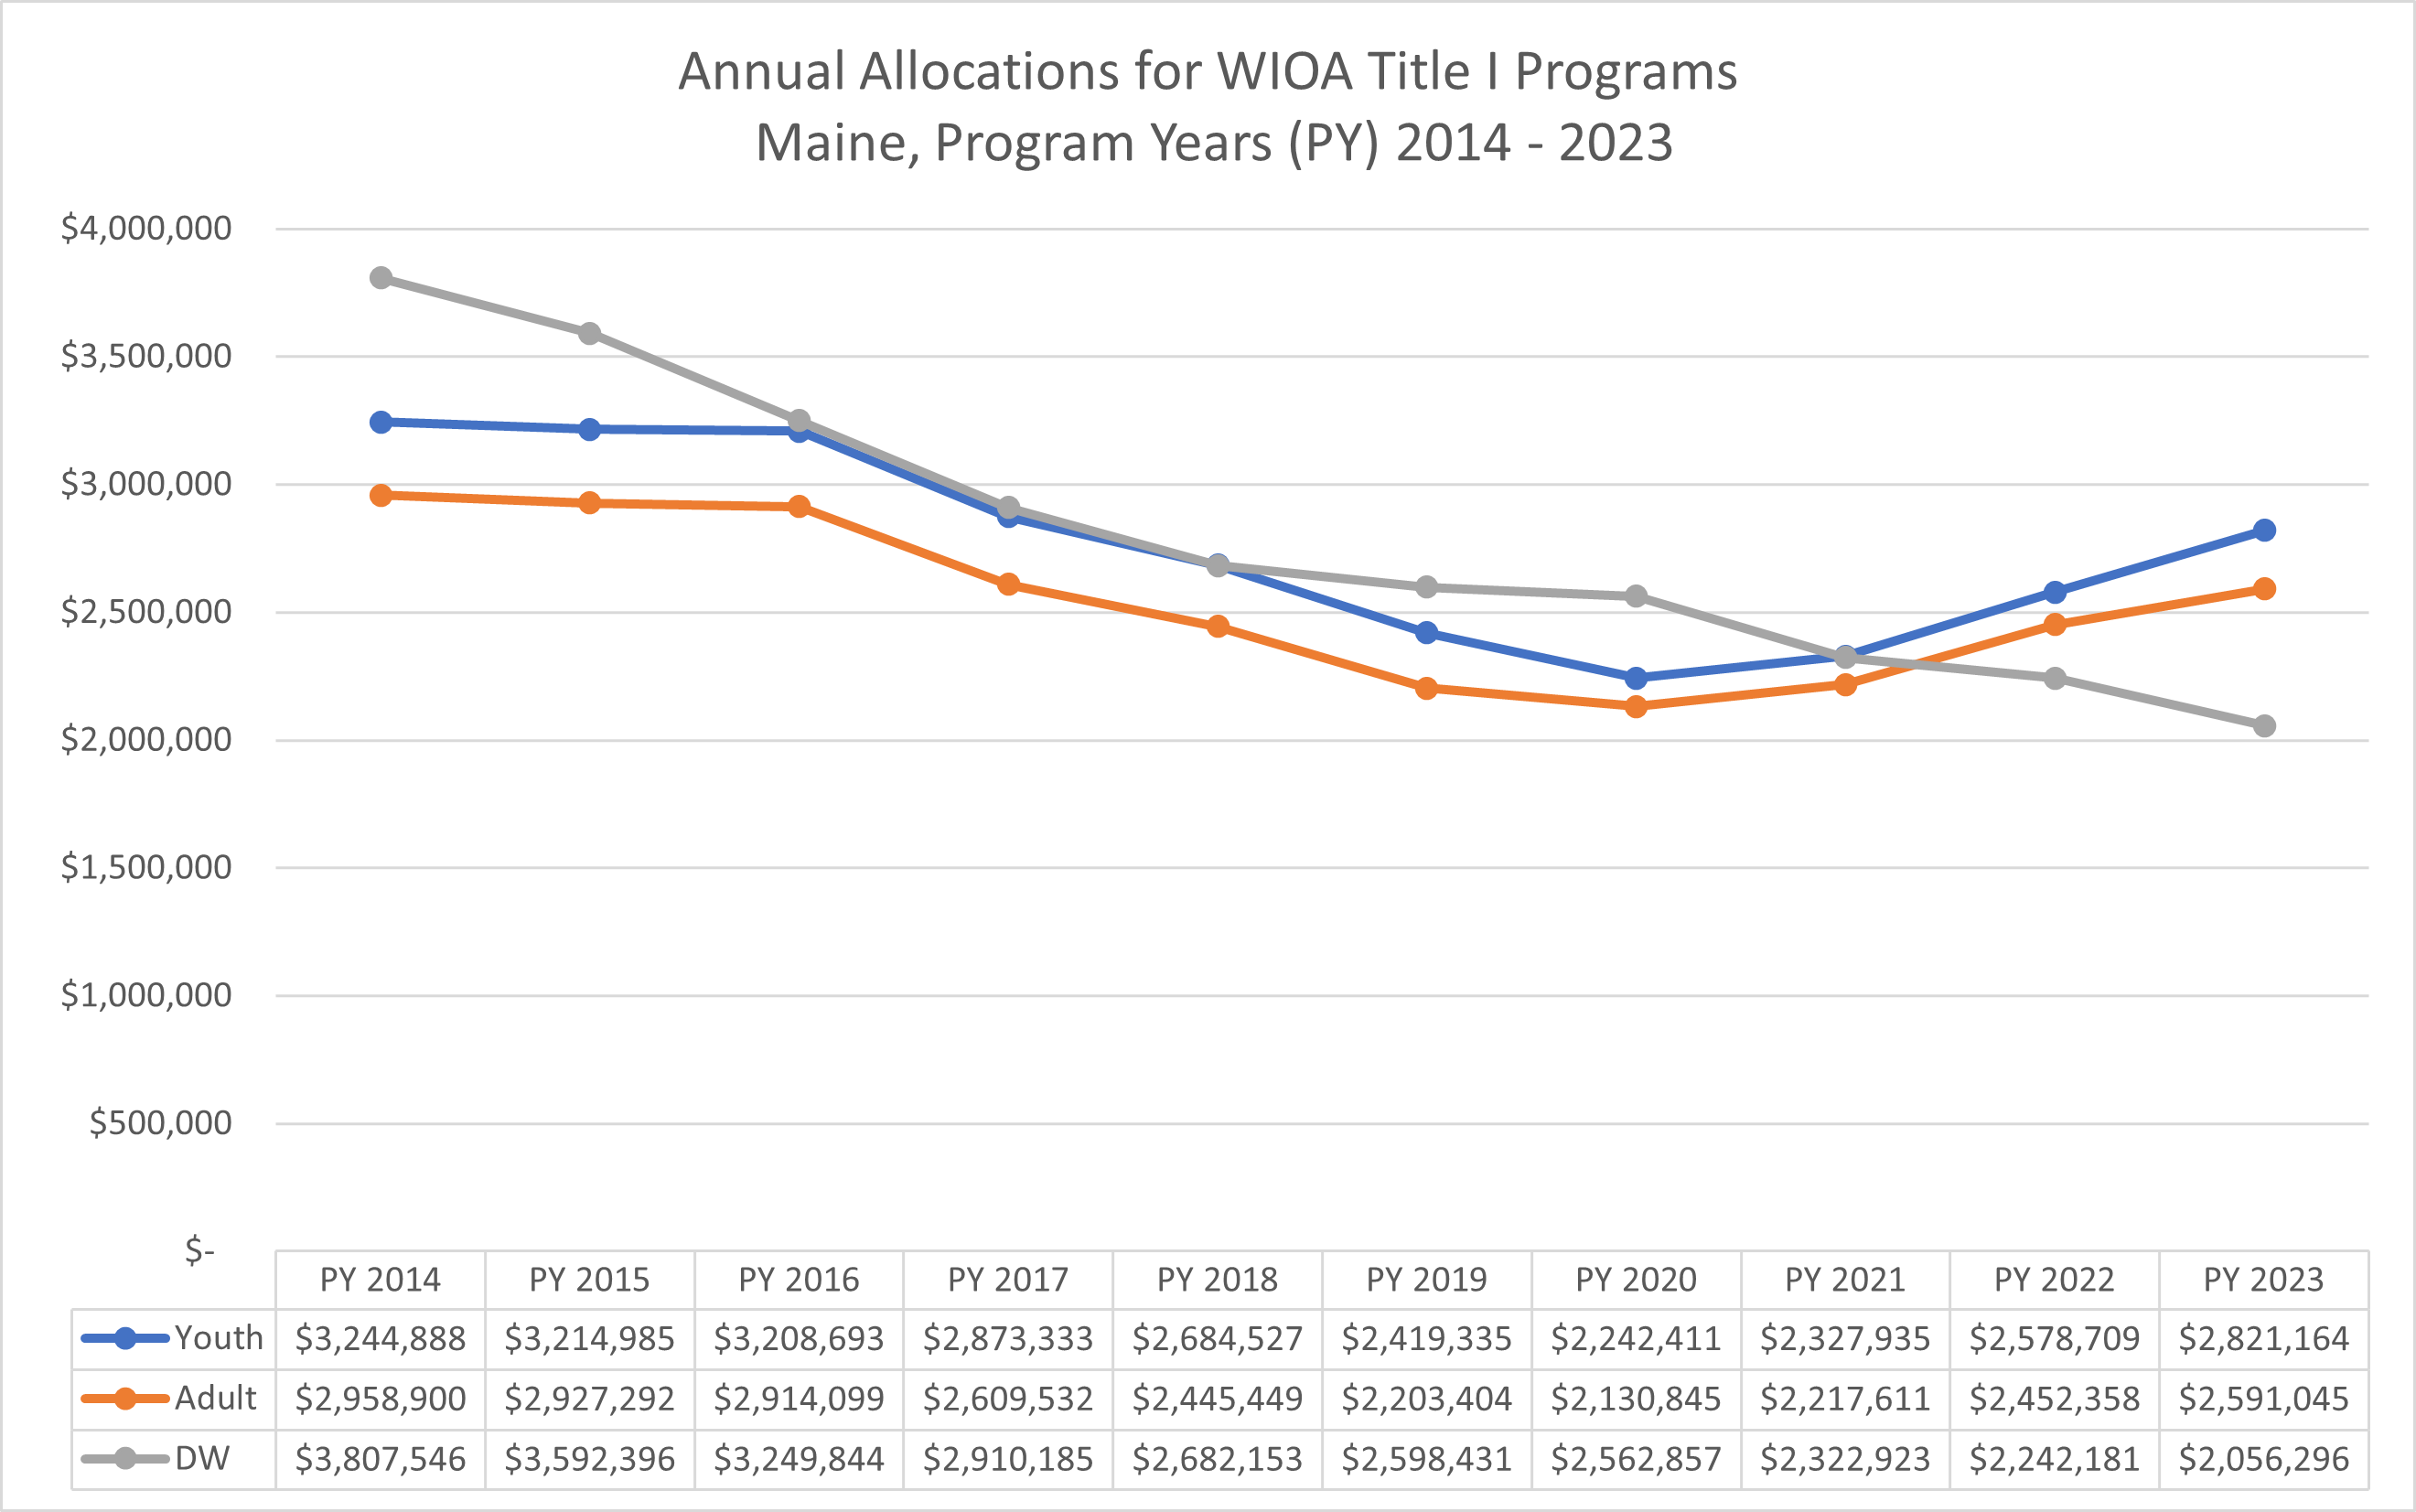
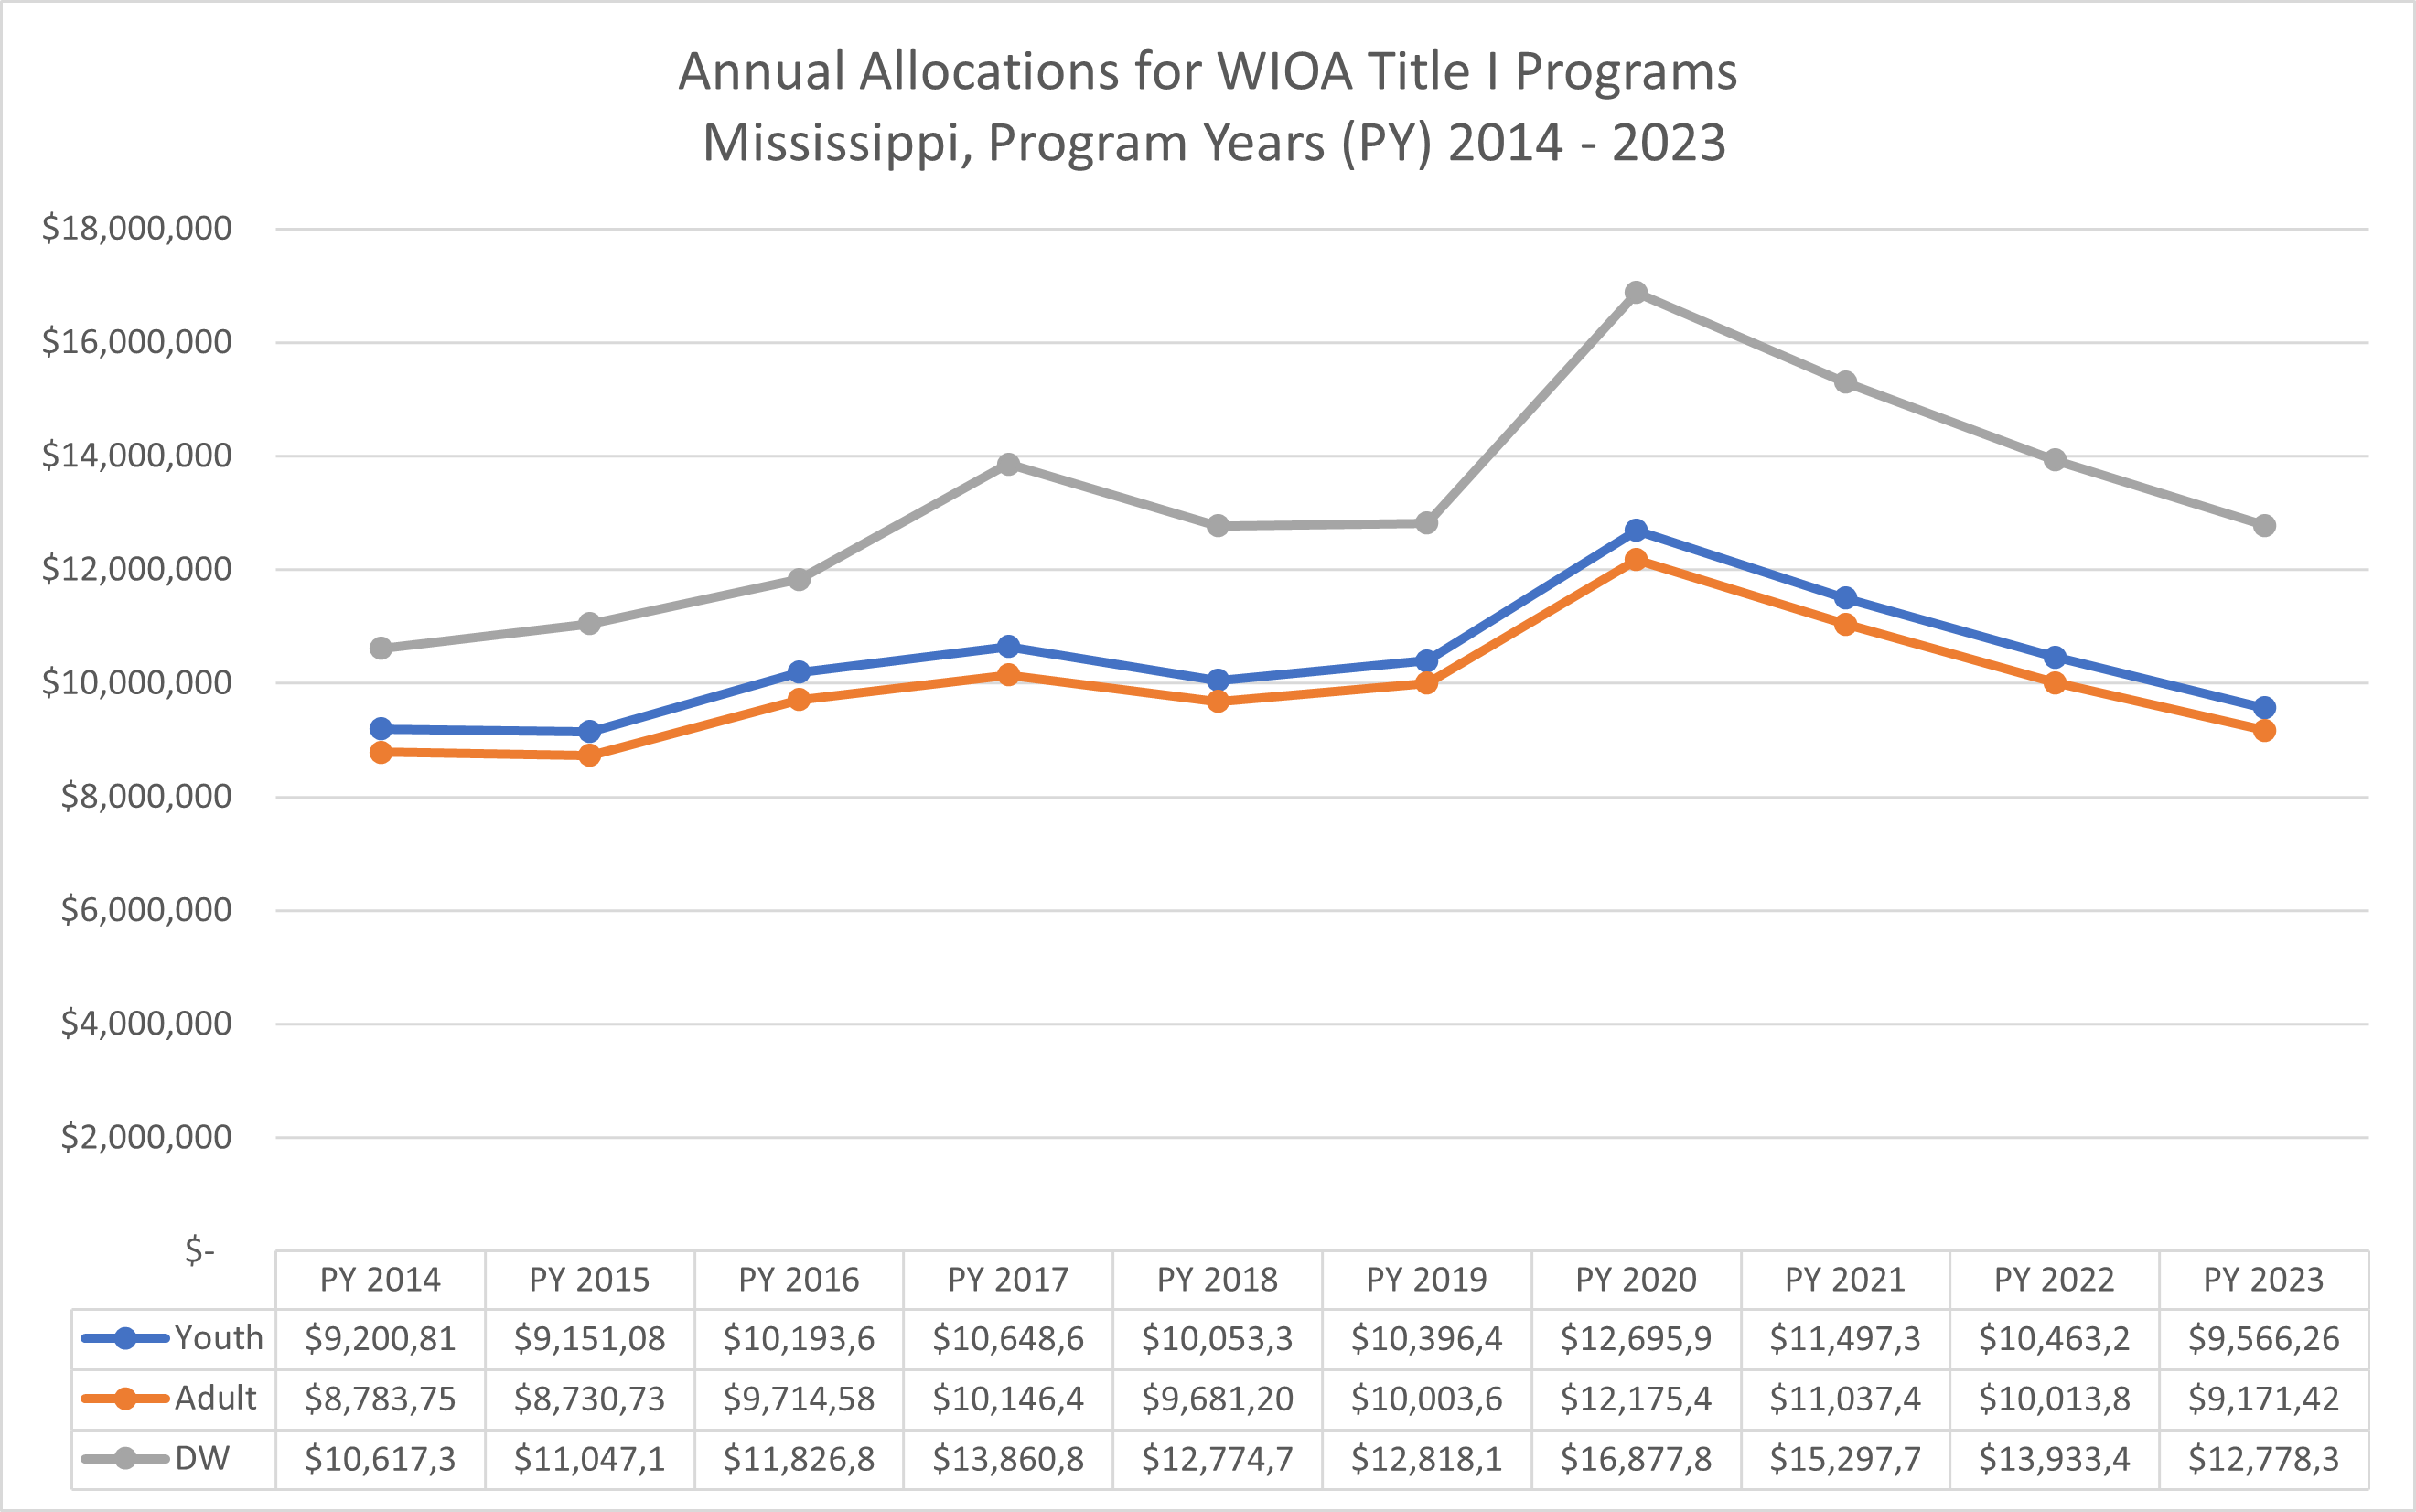
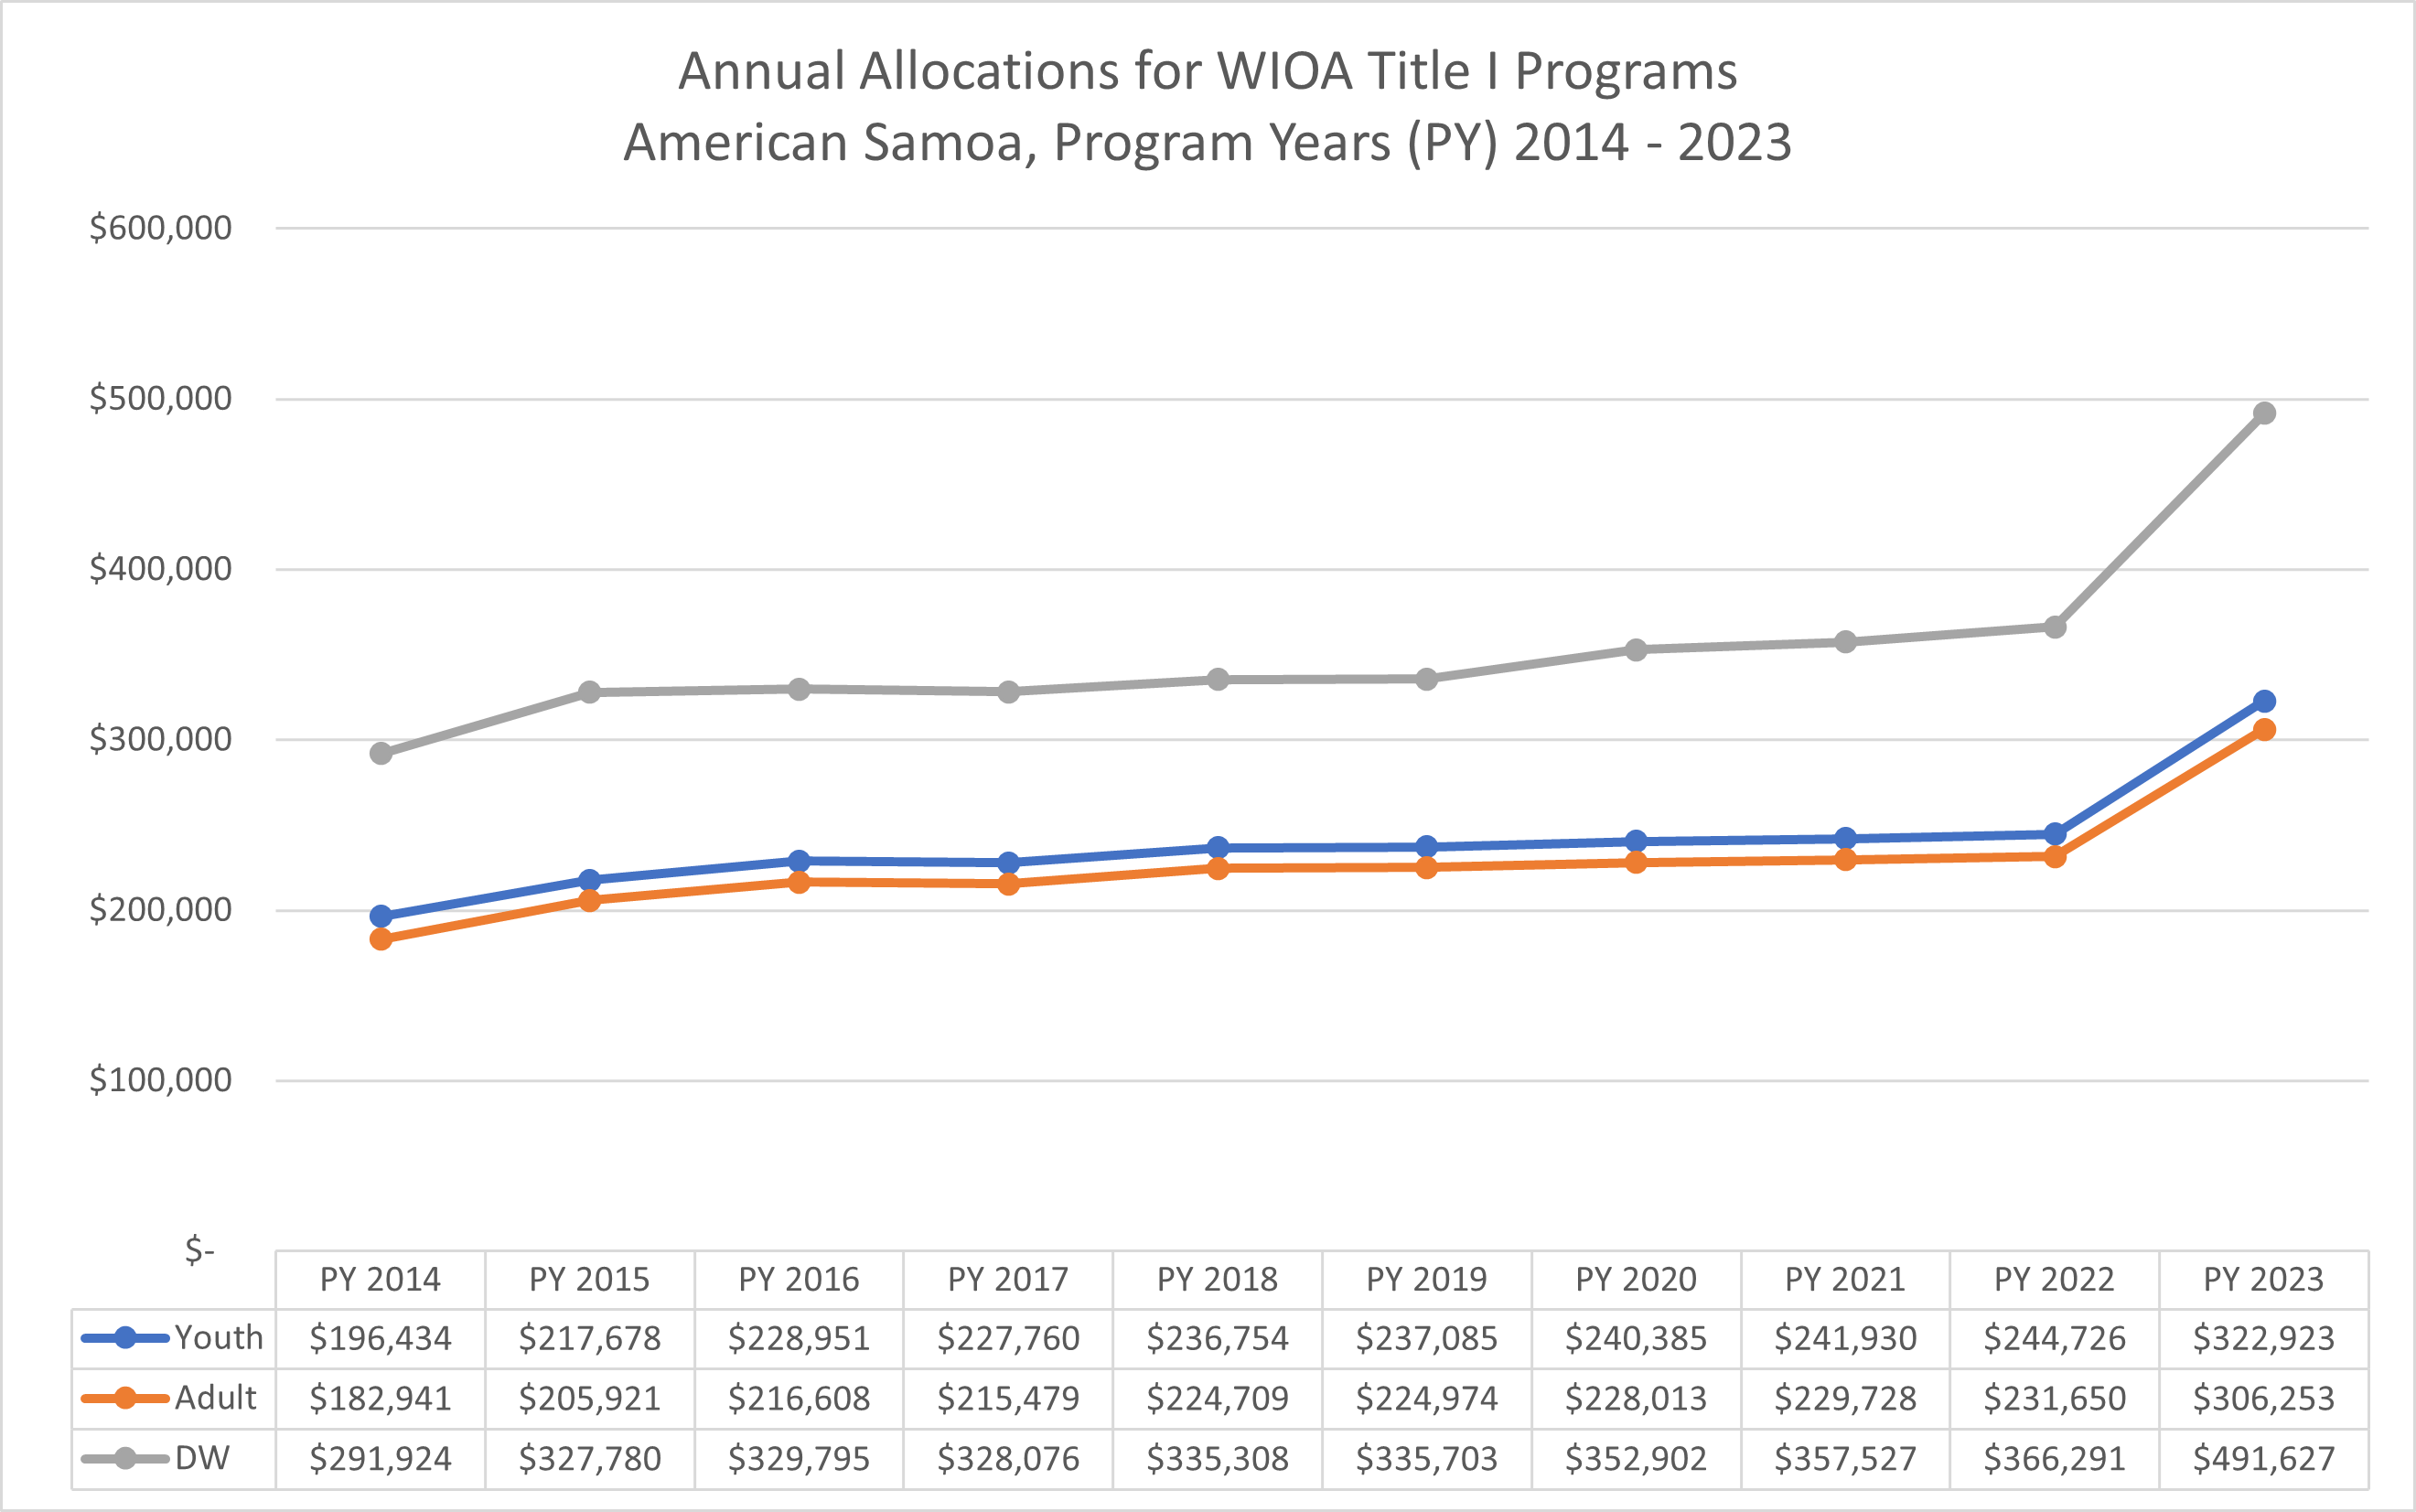
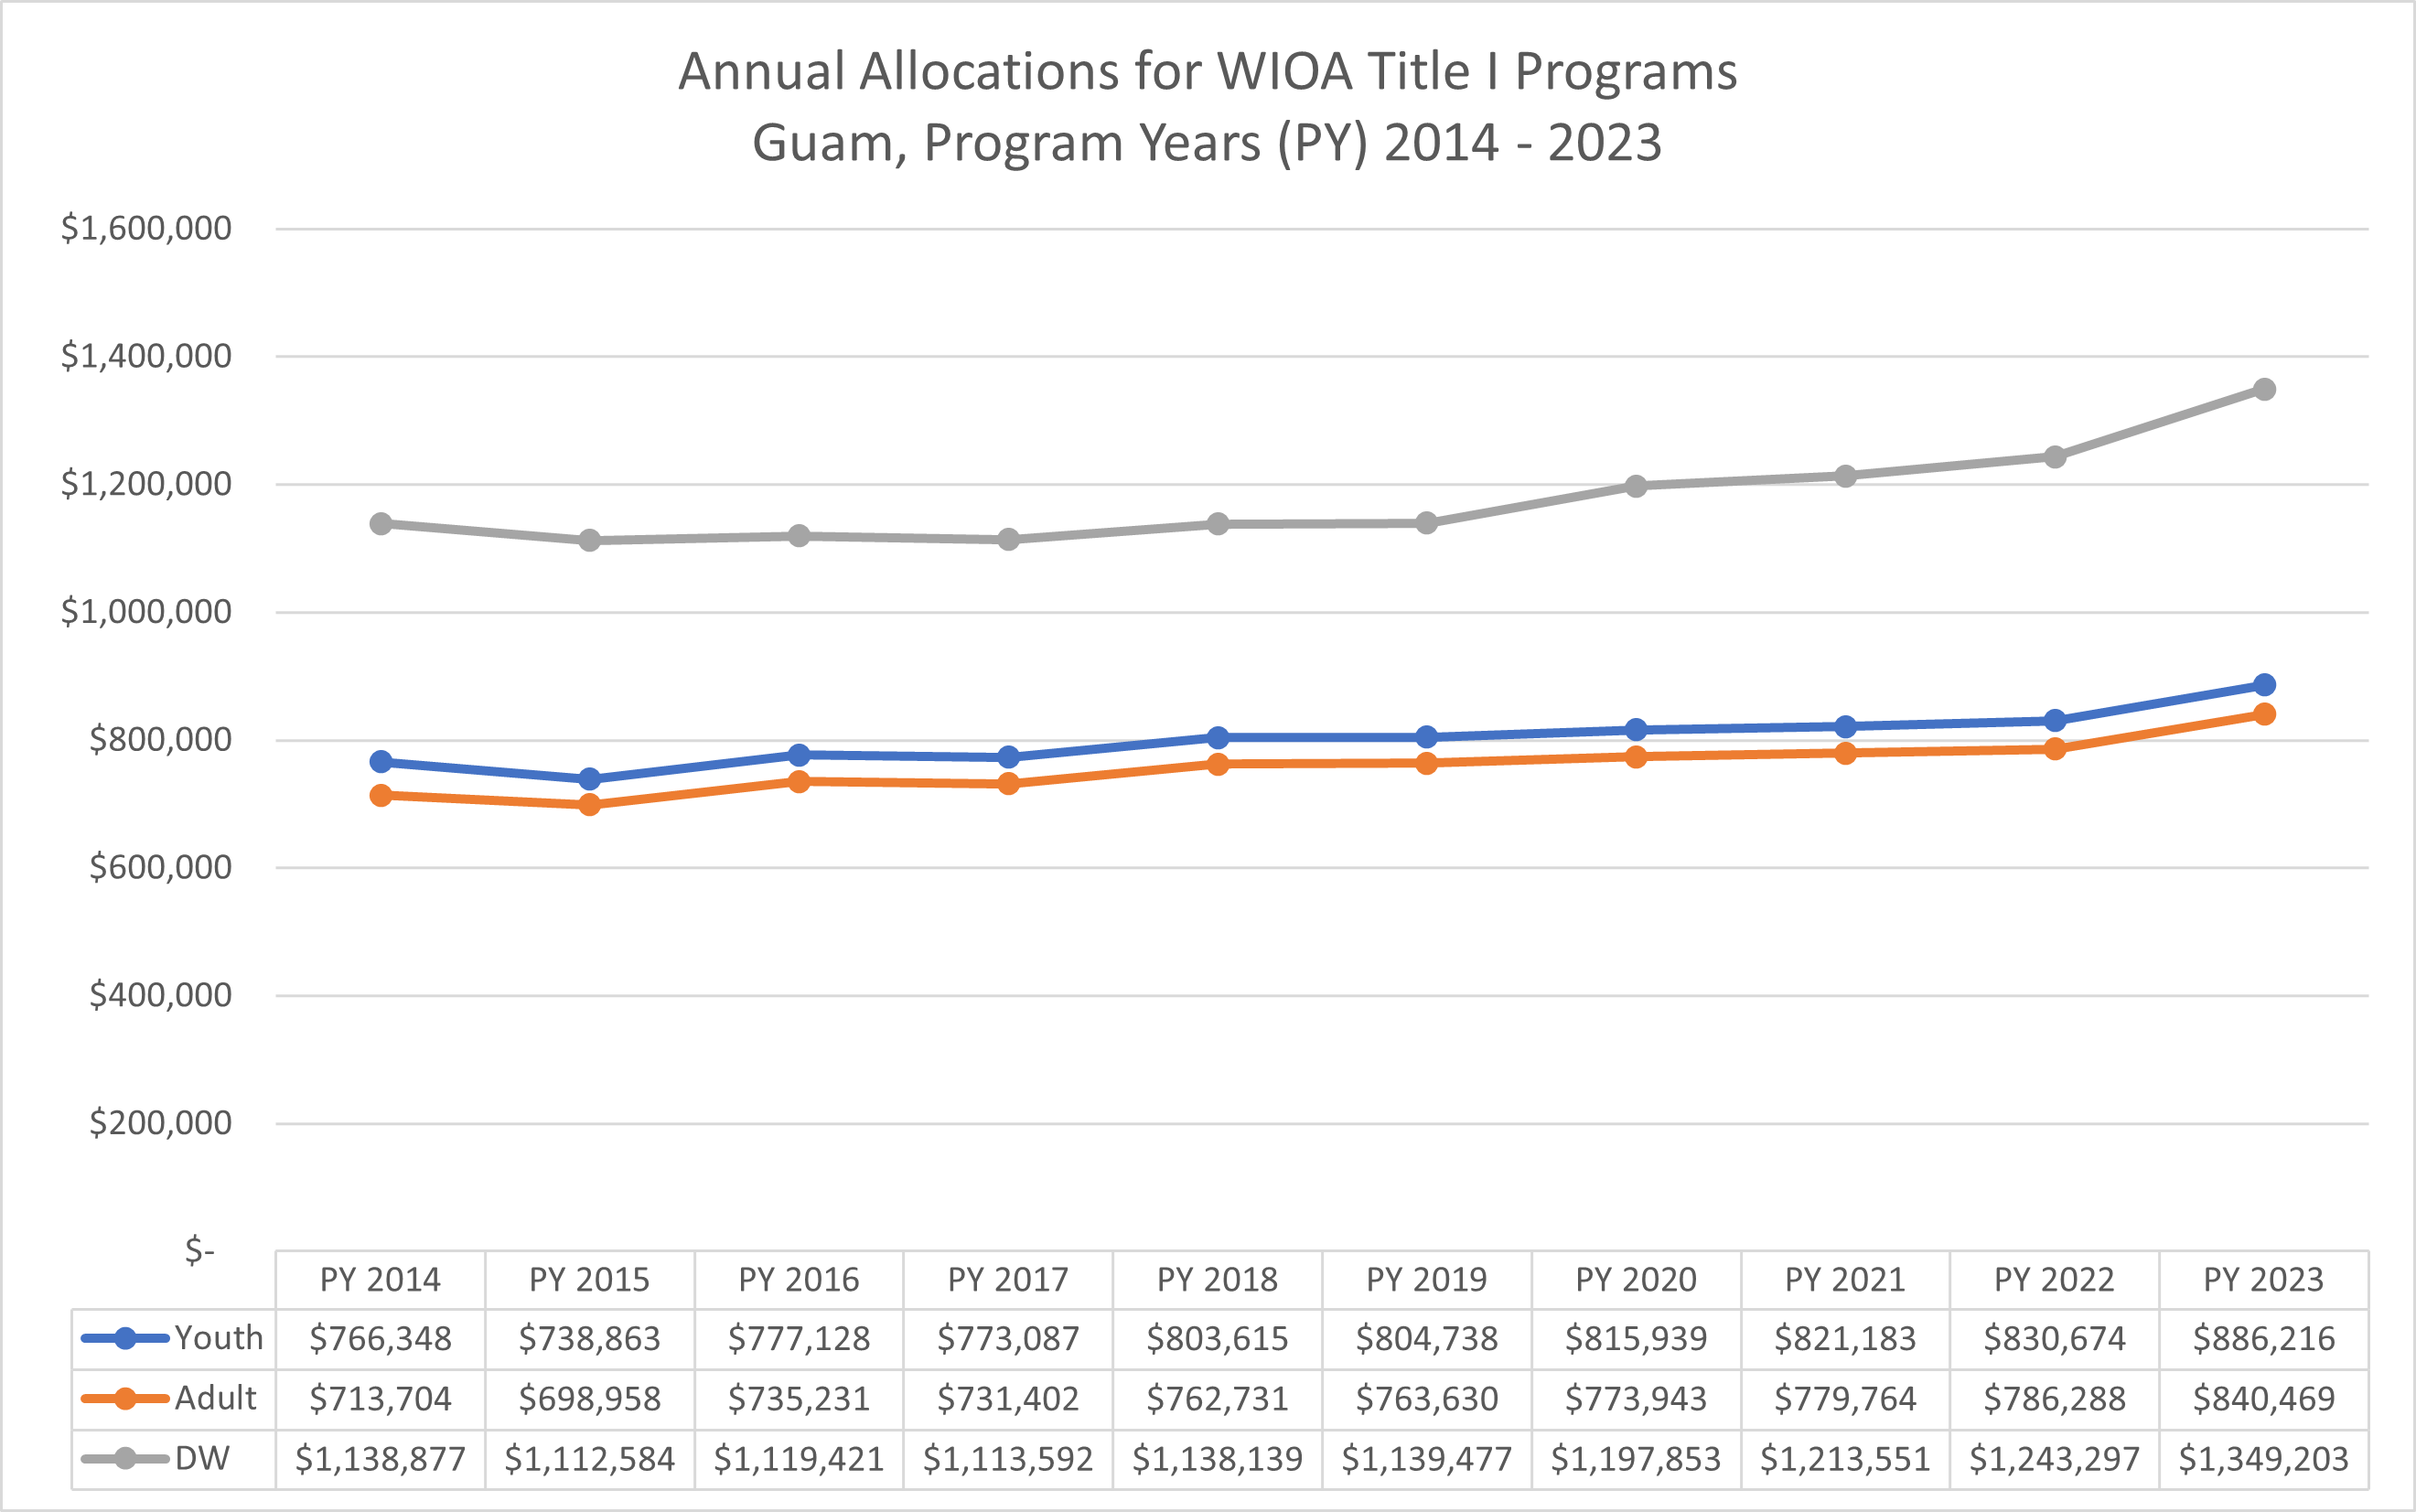
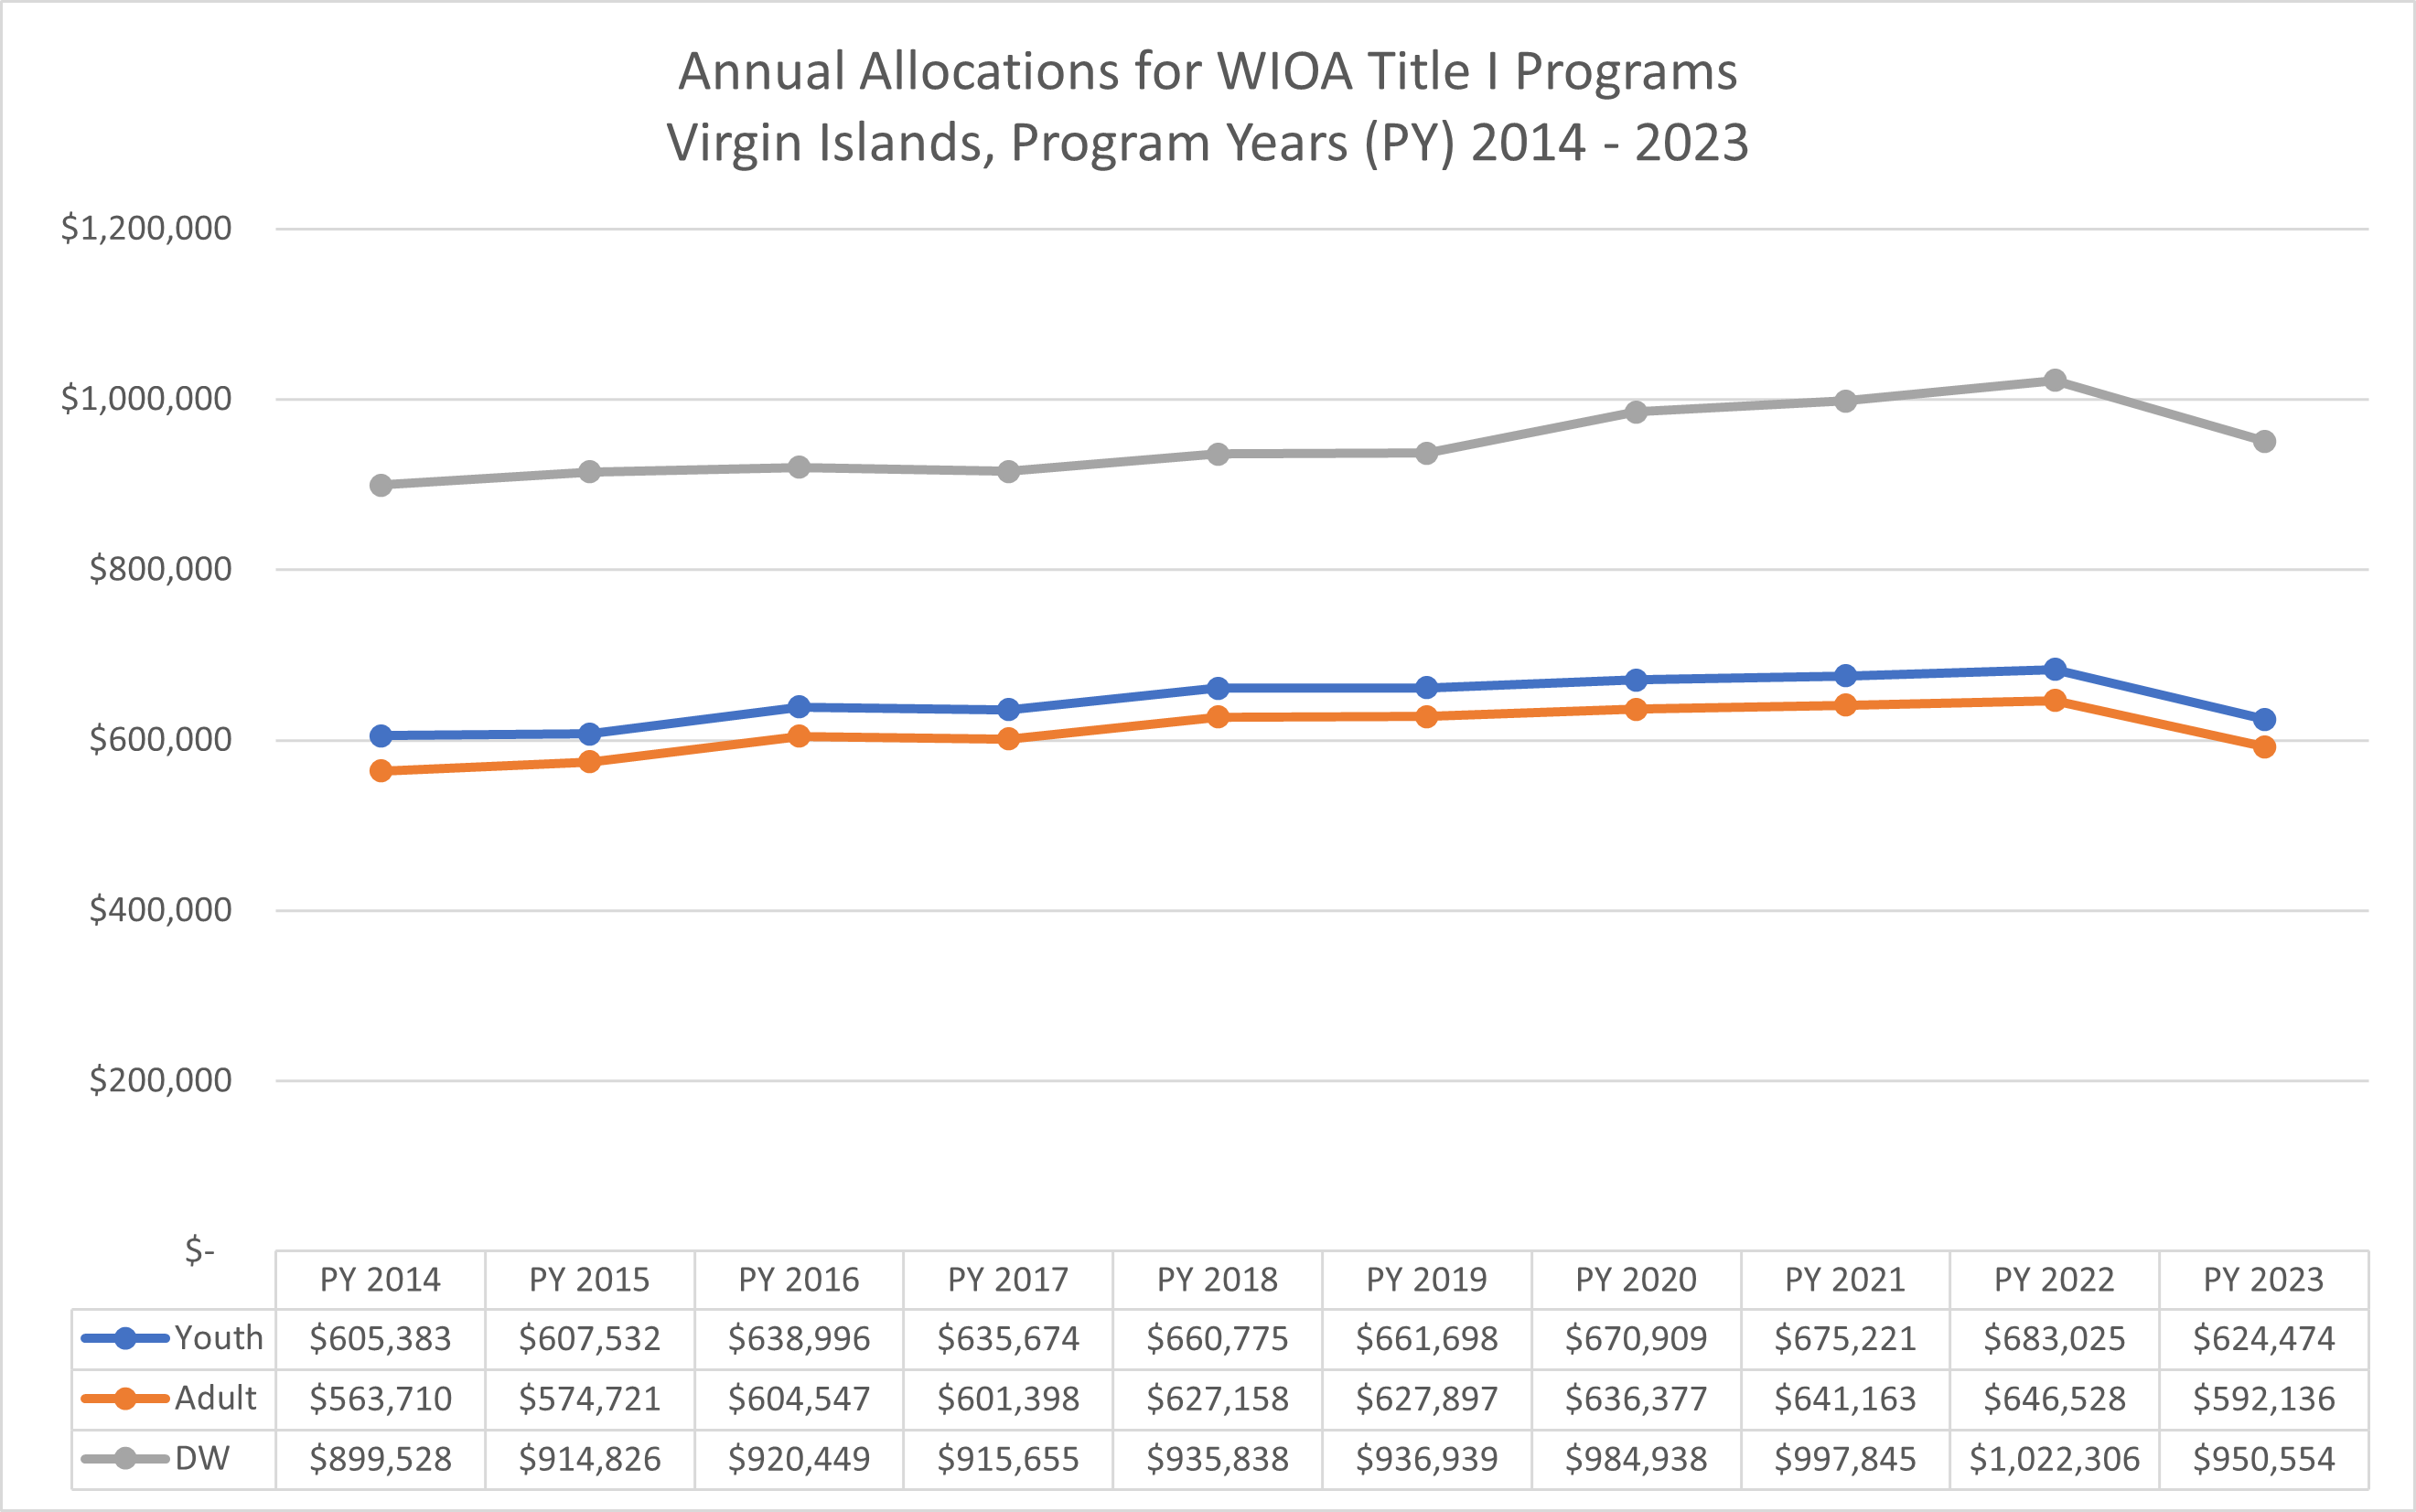
Click on a state below for the funding history across WIOA Title I programs dating back to 2014. Please keep in mind these are nominal figures and not adjusted for inflation.