How States are Leveraging Data to Respond to and Recover from the COVID-19 Pandemic
by Jess Kirchner, Jordan Hynes, and Belle Cuneo
In the fight against COVID-19, one of the most significant weapons in the government’s arsenal was not cleaning supplies or hand sanitizer, but data. Governors were at the forefront of a race to create systems and processes to leverage data in innovative ways. In 2019, only 12 states had significant public-facing performance management systems, but by the end of 2020, all 50 states had created COVID-19 dashboards to track public health and emergency response data. This data revolution presents a unique opportunity for Governors to ride the momentum and continue to prioritize the use of data and evidence to solve future problems.
This post focuses on three primary questions:
- 1. The Product: What did states do with data?
- 2. The Process: How did states create and evolve their data systems?
- 3. The Path Forward: How can Governors harness data and apply it in the future?
The Product – What did states do with data?
The push to create a user-friendly dashboard to track health trends was a massive initiative across all 50 states. Government officials, public health researchers and private citizens alike had the ability to access real-time data — for example, prevalence data and hospital capacity — which informed decisions about resource allocation and personal risk.
Many states have quantified the impact of the pandemic through additional measures such as masking rates, testing rates and now, vaccination rates. Some states, like Colorado, went above and beyond using data for internal tracking purposes to provide their citizens with contextual data. In addition to featuring hospital and outbreak information, Colorado’s COVID-19 dashboard included testing counts and epidemic curves, and the state’s investments in accessible data tools allowed residents to have a rounded pulse on the state’s prognosis.
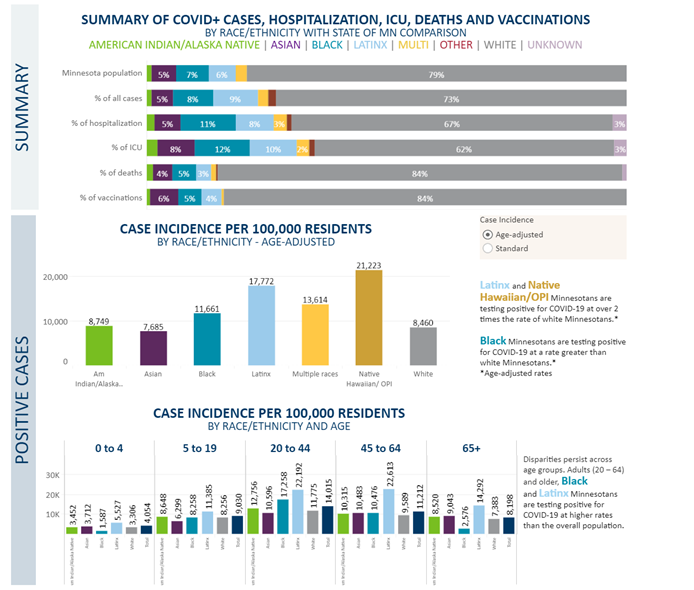
Analysis of compiled data also brought to light disproportionately higher COVID-19 infection rates among racial and ethnic minorities, as well as lower access to care, and worse health outcomes than other groups. As a result of such findings, some states prioritized investment in collecting and reporting demographic data as part of a broader strategy of addressing racial equity. A standout example is Minnesota, which, under the guidance of Governor Tim Walz and the administration’s Community Resiliency and Recovery work group, created an interactive race and ethnicity dashboard that allowed Minnesotans to see prevalence data, as well as economic impact, by race and ethnicity. According to the dashboard’s homepage, the purpose is to “educate and spark community leaders, nonprofits, foundations, governments, and corporations to work together to reduce and eliminate systemic barriers so communities of color and Indigenous communities can recover with dignity and resiliency.”
Additionally, Minnesota created a COVID Response Capacity Tracker, which monitored the secondary impacts of COVID-19 such as economic and food security metrics, critical care supplies, and social distancing trends. The inclusion and transparency of such diverse measures helped providers and facilities across the state to react and prepare for changing conditions and to facilitate communication in order to mitigate adverse impacts on Minnesotans.
The Process: How did states create and Evolve their data systems?
States with the preexisting ability to link, share and integrate data were well-positioned to take rapid action in response to the pandemic. The Colorado Office of Budget and Planning, credited the state’s data advancement to the “Vision 2018” initiative launched by former Governor John Hickenlooper and continued under Governor Jared Polis. For several years, Colorado has maintained a Governor’s Dashboard that provides interactive and robust models on “The Big Four” policy priorities: economic development, environment and renewables, health, and education and workforce. On a monthly basis, agency performance data is collected as part of the performance review process for agency leadership. When COVID-19 hit, Colorado was able to swiftly pivot and build on this existing technology to create a pandemic dashboard. The CO Department of Public Health and Environment built and maintained the COVID dashboard, and sourced data from multiple bodies, including county health departments, hospitals and labs. When Colorado was “facing the recession, we were in a good place to use the structure we had already build to answer a different question,” according to Aaron Ray of the Colorado Office of Budget and Planning.
As Colorado was “facing the recession, we were in a good place to use the structure we had already build to answer a different question”
Aaron Ray, Colorado Office of Budget and Planning.
A similar story emerged in Virginia, where under Governor Ralph Northam, the state expanded its Framework for Addiction Analysis and Community Transformation (FAACT) dashboard, which has been tracking the effects of the opioid epidemic. FAACT’s cloud-based data sharing and analytics platform had been successfully combining data from disparate sources, including the Department of Criminal Justice Systems, local correctional agencies, the Virginia State Police, the Community Service Board, the Department of Forensic Sciences, the Winchester Police, private health care systems, and the U.S. Census and Bureau of Labor Statistics. Based on the framework provided by the COVID-19 dashboard, several public and private organizations, including the Virginia Department of Emergency Management and the Virginia Hospital and Healthcare Association, joined forces to provide relevant pandemic data that was updated daily. Armed with real-time data, Virginia was able to closely track and respond to surge and supply needs.
In addition to response time and adaptability, community partnerships were an important weapon in states’ arsenal against COVID-19. The state of Minnesota has partnered with the Minnesota Electronic Health Record Consortium to publish the state’s race and vaccination data with the goal of ensuring equitable distribution of COVID-19 vaccines. The data are generated when health systems across Minnesota submit a report on patients who have received a vaccine to the Minnesota Immunization Information Connection. That information is then updated weekly as a new component of the state’s COVID-19 dashboard. The partnership between the government of Minnesota and the state’s health systems is one of the first of its kind and has allowed Minnesota to use data to identify demographic gaps in vaccine distribution.
Response time, adaptability and community partnerships are vital during an emergency, and both Colorado and Virginia’s existing commitment to data-sharing systems and Minnesota’s collaboration with private organizations proved to be investments that paid dividends.
The Path Forward: How can governors harness data for future applications?
As states emerge from the pandemic, and Governors shift their focus to longer-term recovery, the data revolution presents an opportunity to develop the foundation for tomorrow. Some of the most agile states leveraged existing systems. Given how many states recently developed data-sharing platforms, Governors have ample opportunity to capitalize on the systems and data infrastructure they’ve developed during the pandemic to address future disasters. Governors need not start from scratch; states can pivot and use data to answer a different question for tomorrow’s emergency.
While sharing data via dashboards, several states have continued to emphasize the importance of data and evidence in policy decisions as the country navigates the economic impact of the pandemic. Tennessee’s Office of Evidence, first created in 2019, has implemented a process that requires state agencies to demonstrate use of data and evidence when proposing spending reductions. In response to a revenue shortfall caused by the pandemic, Tennessee is aiming for a 12 percent reduction in state spending, and data identifying which programs are yielding desirable outcomes is critical to their informed decision-making process.
In Ohio, under the leadership of Governor Mike DeWine and Lieutenant Governor Jon Husted, the state launched the InnovateOhio initiative, which required all state agencies to transition onto the same data-sharing platform. InnovateOhio’s platform strives to look at every state service from the perspective of the consumer (the businesses and citizens of Ohio) and to use technology to transform government services. One of InnovateOhio’s key priorities is DataOhio, a website that provides access to data on statewide initiatives, including the Early Intervention Dashboard, which was created in partnership with the Department of Developmental Disabilities (DODD). The dashboard compiles demographic data on referrals, number of children served, exit reasons and length of stay. It is updated by the DODD every month and can be spliced by county to track progress across regions.
The InnovateOhio platform continues to help tackle complex problems as they arise. For example, InnovateOhio also served as the catalyst for the Unemployment Insurance Claims Dashboard in collaboration with the Governor’s Office for Workforce Transformation, the Ohio State Center for Education Research (OERC), and the Ohio Department of Job and Family Services to expand and refine unemployment claims data in the wake of COVID-19. The dashboard, sourced from the Ohio Longitudinal Data Archives, was updated weekly on the OERC website, and included breakdowns by industry, occupation, gender and education. According to DataOhio, the dashboard serves to help “Ohioans to better understand the changing labor market and patterns and trends that emerge” as Ohio implements strategies to overcome the COVID-19 pandemic. DataOhio plans to keep the dashboard live after the pandemic and maintain the real-time insight it receives about Ohio’s labor market.
COVID-19 demanded innovation from states, and Governors have the opportunity to further capitalize on the developments born of these unprecedented times.
These innovations are only the start — states and Governors can continue to leverage these advancements by:
- Investing in data-system modernization,
- Institutionalizing data and evidence usage as a driver of the policymaking process,
- Building robust partnerships with key community organizations,
- Fostering data-sharing agreements between relevant state agencies,
- Leveraging outcomes-based contracting to promote efficient use of public funds, and,
- Developing an evidence framework, guidelines or standards to inform state funding decisions.